Drawing Circular Pie Charts
|
|
|
Converting Data for Circular Pie Charts
The SVG code in Listing 15.2 defines an array of values that represent the angle subtended by circular arcs. What would you do if you had a set of numeric data instead of the pre-computed angles for the corresponding circular arc? The code below shows you how to convert numeric data into the corresponding angles in order to create the associated circular pie chart.
The SVG document in Listing 15.2 demonstrates how to draw a circular pie chart.
Listing 15.2 circularPieChartData1.svg
<?xml version="1.0" standalone="no"?> function initializeDataPoints() { dataPoints[0] = 100.; dataPoints[1] = 200.; dataPoints[2] = 300.; dataPoints[3] = 450.; dataPoints[4] = 250.; dataPoints[5] = 350.; dataPoints[6] = 500.; dataPoints[7] = 275.; dataSum = 0.; for(var v=0; v<vertexCount; v++) { dataSum += dataPoints[v]; } } function initializeChart() { initializeDataPoints(); for(var v=0; v<vertexCount; v++) { angles[v] = 360.*dataPoints[v]/dataSum; } } // initializeChart
Remarks
The code in Listing 15.2 contains the ECMAScript function initializeChart() that invokes the ECMAScript function initializeDataPoints(), which in turn initializes an array with numeric values, while the former computes the associated angle values. The section of code that computes the corresponding angle value is given below:
for(var v=0; v<vertexCount; v++) { angles[v] = 360.*dataPoints[v]/dataSum; } The preceding loop assigns each pie slice the number of degrees that is proportionate to the sum of all the pie chart values.
The file , which can be found on the CD-ROM, is a complete listing that computes a set of angles based on a set of numeric data and then renders a circular pie chart.
Drawing Elliptic Pie Charts
Consider the elliptic pie chart shown in Figure 15.2.
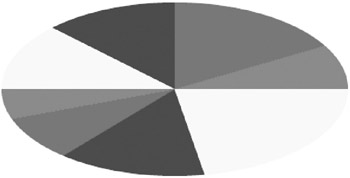
Figure 15.2: An elliptic pie chart.
The SVG document in Listing 15.3 demonstrates how to draw an elliptic pie chart.
Listing 15.3 ellipticPieChart1.svg
<?xml version="1.0" standalone="no"?> <!DOCTYPE svg PUBLIC "-//W3C//DTD SVG 20010904//EN" "http://www.w3.org/TR/2001/REC-SVG-20010904/DTD/svg10.dtd"> <svg width="100%" height="100%" onload="init(evt)" xmlns="http://www.w3.org/2000/svg"> <script type="text/ecmascript"> <![CDATA[ var basePointX = 300.; var basePointY = 150.; var currentX = 0.0; var currentY = 0.0; var offsetX1 = 0.0; var offsetY1 = 0.0; var offsetX2 = 0.0; var offsetY2 = 0.0; var minorAxis = 100.; var majorAxis = 200.; var angleSum1 = 0.; var angleSum2 = 0.; var vertexCount = 8.; var xPts = Array(vertexCount); var yPts = Array(vertexCount); var angles = Array(vertexCount); var pointPath = ""; var ellipseColors = ['red','green', 'blue','yellow']; var colorCount = 4.; var pieNode = null; var svgDocument = null; var target = null; var gcNode = null; function init(event) { target = event.getTarget(); svgDocument = target.getOwnerDocument(); gcNode = svgDocument.getElementById("gc"); initializeChart(); drawChart(); } function initializeChart() { angles[0] = 30.; angles[1] = 60.; angles[2] = 45.; angles[3] = 45.; angles[4] = 20.; angles[5] = 30.; angles[6] = 50.; angles[7] = 80.; } // initializeChart function drawChart() { for(var v=0; v<vertexCount; v++) { angleSum2 = angleSum1 + angles[v]; offsetX1 = majorAxis*Math.cos( angleSum1*Math.PI/180); offsetY1 = minorAxis*Math.sin( angleSum1*Math.PI/180); offsetX2 = majorAxis*Math.cos( angleSum2*Math.PI/180); offsetY2 = minorAxis*Math.sin( angleSum2*Math.PI/180); currentX = basePointX+offsetX2; currentY = basePointY-offsetY2; // the vertical offset must be subtracted, // so we need to "flip" the sign of offsetY1 offsetY1 *= -1; pointPath = "M"+basePointX+","+basePointY; pointPath += " l"+offsetX1+","+offsetY1; pointPath += " A"+majorAxis+","+ minorAxis+" 0 0 0 "; pointPath += currentX+","+currentY; pointPath += " L"+basePointX+","+ basePointY+"z"; fillColor = "fill:"+ ellipseColors[v%colorCount]; pieNode = svgDocument.createElement("path"); pieNode.setAttribute("d", pointPath); pieNode.setAttribute("style",fillColor); gcNode.appendChild(pieNode); angleSum1 += angles[v]; } } // drawPattern ]]> </script> <!-- ============================ --> <g transform="translate(10,10)"> <rect x="0" y="0" width="800" height="500" fill="none" stroke="none"/> </g> </svg>
Remarks
The SVG code in Listing 15.3 is based on the code for generating a circular pie chart. The actual changes are as follows: replace the variable radius with the variables majorAxis for the horizontal axis and minorAxis for the vertical axis:
var minorAxis = 100.; var majorAxis = 200.; offsetX1 = majorAxis*Math.cos(angleSum1*PI/180); offsetY1 = minorAxis*Math.sin(angleSum1*PI/180); offsetX2 = majorAxis*Math.cos(angleSum2*PI/180); offsetY2 = minorAxis*Math.sin(angleSum2*PI/180);
With the preceding changes, you have now converted a circular pie chart into an elliptic pie chart.
Since a circle is a special case of an ellipse, you can generate a circular pie chart in the preceding code by assigning the same value to minorAxis and majorAxis.
As you saw in the case of a circular pie chart, you can easily create a 'separation' effect between adjacent pie elliptic slices by adding the following code in the function drawChart():
var style = ""; var strokeWidth = 4.; var strokeColor = 'white'; stroke = "stroke:"+strokeColor+";"; stroke += "stroke-width:"+strokeWidth+";"; fillColor = "fill:"+ellipseColors[v%colorCount]; style = stroke+fillColor; pieNode.setAttribute("style",style); Another simple variation of the code involves creating a shadow-like three-dimensional effect for the elliptic pie chart; this change requires adding the following code to the function drawChart():
function drawChart() { ellipseNode = svgDocument.createElement("ellipse"); ellipseNode.setAttribute("cx", basePointX+10); ellipseNode.setAttribute("cy", basePointY+10); ellipseNode.setAttribute("rx", majorAxis); ellipseNode.setAttribute("ry", minorAxis); ellipseNode.setAttribute("style","fill:black;"); // the remaining code is the same.... } The complete code for the preceding modifications is available on the CD-ROM in the SVG documents and .
Rotating Circular Pie Charts
Consider the circular pie chart rendered in Figure 15.3.
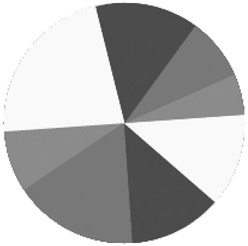
Figure 15.3: A rotating circular pie chart.
The SVG document in Listing 15.4 demonstrates how to draw a rotating circular pie chart.
Listing 15.4 rotatingCircularPieChart1.svg
<?xml version="1.0" standalone="no"?> <!DOCTYPE svg PUBLIC "-//W3C//DTD SVG 20010904//EN" "http://www.w3.org/TR/2001/REC-SVG-20010904/DTD/svg10.dtd"> <svg width="100%" height="100%" onload="init(evt)" xmlns="http://www.w3.org/2000/svg"> <script type="text/ecmascript"> <![CDATA[ var basePointX = 300.; var basePointY = 150.; var currentX = 0.0; var currentY = 0.0; var offsetX1 = 0.0; var offsetY1 = 0.0; var offsetX2 = 0.0; var offsetY2 = 0.0; var shortPause = 80.; var radius = 100.; var startAngle = 0.; var angleDelta = 8.; var angleDirection = 1.; var maxAngle = 180.; var angleSum1 = 0.; var angleSum2 = 0.; var vertexCount = 8.; var xPts = Array(vertexCount); var yPts = Array(vertexCount); var angles = Array(vertexCount); var pointPath = ""; var circleColors = ['red','green', 'blue','yellow']; var colorCount = 4.; var pieNode = null; var theTimeout = null; var svgDocument = null; var target = null; var gcNode = null; function init(event) { target = event.getTarget(); svgDocument = target.getOwnerDocument(); gcNode = svgDocument.getElementById("gc"); initializeChart(event); drawChart(event); } function initializeChart(event) { angles[0] = 30.; angles[1] = 60.; angles[2] = 45.; angles[3] = 45.; angles[4] = 20.; angles[5] = 30.; angles[6] = 50.; angles[7] = 80.; } // initializeChart function updateCoordinates() { startAngle += angleDelta*angleDirection; } // updateCoordinates function drawChart(event) { for(var v=0; v<vertexCount; v++) { angleSum2 = angleSum1+angles[v]; offsetX1 = radius*Math.cos( (startAngle+angleSum1)*Math.PI/180); offsetY1 = radius*Math.sin( (startAngle+angleSum1)*Math.PI/180); offsetX2 = radius*Math.cos( (startAngle+angleSum2)*Math.PI/180); offsetY2 = radius*Math.sin( (startAngle+angleSum2)*Math.PI/180); currentX = basePointX+offsetX2; currentY = basePointY-offsetY2; // the vertical offset must be subtracted, // so we need to "flip" the sign of offsetY1 offsetY1 *= -1; pointPath = "M"+basePointX+","+basePointY; pointPath += " l"+offsetX1+","+offsetY1; pointPath += " A"+radius+","+radius+" 0 0 0 "; pointPath += currentX+","+currentY; pointPath += " L"+basePointX+","+ basePointY+"z"; fillColor = "fill:"+ circleColors[v%colorCount]; pieNode = svgDocument.createElement("path"); pieNode.setAttribute("d", pointPath); pieNode.setAttribute("style",fillColor); gcNode.appendChild(pieNode); angleSum1 += angles[v]; } theTimeout = setTimeout( "window.drawChart()", shortPause); if( startAngle > maxAngle ) { stopAnimation(event); } updateCoordinates(); } // drawChart function stopAnimation(event) { window.clearTimeout(theTimeout); } ]]> </script> <!-- ============================ --> <g transform="translate(10,10)"> <rect x="0" y="0" width="800" height="500" fill="none" stroke="none"/> </g> </svg>
Remarks
Although Listing 15.4 contains code that is similar to a static pie chart, let's examine the logic of the code. The key idea involves the variable startAngle, which is the start angle for the display of the rotated pie chart. Since this variable is incremented by the amount angleDelta*angleDirection each time the pie chart is refreshed, the result is a rotating pie chart. The variable shortPause (which equals 80 in this example) controls the rate at which the pie chart is refreshed; note that this value is interpreted in milliseconds. The setTimeout() function waits for shortPause milliseconds before invoking the drawChart() function. When the value of startAngle exceeds the value of maxAngle (which happens to be 180 in this example), the stopAnimation() function is invoked, which stops the animation.
Now let's return to the details of Listing 15.4. The SVG code starts with a block of global ECMAScript variables, followed by the ECMAScript function init() that initializes the variables theTimeout, svgDocument, target, and gcNode.
The init() function invokes the ECMAScript function initializeChart(), which assigns a value (measured in degrees) to each sector of the pie chart as listed below:
function initializeChart(event) { angles[0] = 30.; angles[1] = 60.; angles[2] = 45.; angles[3] = 45.; angles[4] = 20.; angles[5] = 30.; angles[6] = 50.; angles[7] = 80.; } // initializeChart The last line of the init() function invokes the function drawChart(), which performs all the necessary calculations for determining the coordinates of the circular pie sectors.
The first part of the function drawChart() updates the current cumulative angle and then computes the x-coordinates and the y-coordinates of the two 'end points' of the current circular arc that lie on the circumference of the outer circle:
angleSum2 = angleSum1 + angles[v]; offsetX1 = radius*Math.cos(angleSum1*Math.PI/180); offsetY1 = radius*Math.sin(angleSum1*Math.PI/180); offsetX2 = radius*Math.cos(angleSum2*Math.PI/180); offsetY2 = radius*Math.sin(angleSum2*Math.PI/180);
Next, drawChart() constructs the string pointPath that will be used in an SVG path element:
currentX = basePointX+offsetX2; currentY = basePointY-offsetY2; // the vertical offset must be subtracted, // so we need to "flip" the sign of offsetY1 offsetY1 *= -1; pointPath = "M"+basePointX+","+basePointY; pointPath += " l"+offsetX1+","+offsetY1; pointPath += " A"+radius+","+radius+" 0 0 0 "; pointPath += currentX+","+currentY; pointPath += " L"+basePointX+","+ basePointY+"z";
The next section of code in drawChart() dynamically creates an SVG path element and assigns values to the attributes path and style:
fillColor = "fill:"+circleColors[v%colorCount]; pieNode = svgDocument.createElement("path"); pieNode.setAttribute("d", pointPath); pieNode.setAttribute("style",fillColor); gcNode.appendChild(pieNode); The next part of drawChart() causes this function to call itself after a pause of shortPause milliseconds:
theTimeout = setTimeout("window.drawChart()", shortPause); The following conditional code block in drawChart() invokes the function stopAnimation() in order to stop the animation effect:
if( startAngle > maxAngle ) { stopAnimation(event); } The last portion of the function drawChart() invokes the ECMAScript function updateCoordinates(), which updates the value of angleSum1 in order to create the rotating animation effect:
function updateCoordinates() { startAngle += angleDelta*angleDirection; } // updateCoordinates If you were watching closely, or if you've written this type of code in other languages, you might have noticed that the code can easily be modified to alternate the direction of rotation. The following type of code block can accomplish this:
startAngle += angleDelta*angleDirection; if( startAngle >= maxAngle ) { angleDirection *= -1; startAngle = maxAngle; ++changeDirection; } if( startAngle <= minAngle ) { angleDirection *= -1; startAngle = minAngle; ++changeDirection; } if(changeDirection > maxChangeCount ) { stopAnimation(event); } This code block requires the following new variables with sample initial values:
var changeDirection = 0.; var minAngle = 0.; var maxChangeCount = 10.;
|
|
|
EAN: 2147483647
Pages: 362