Converting Data for Circular Pie Charts
|
|
|
Mouse-Controlled Rotating Circular Pie Charts
Consider the circular pie chart and the two rectangles rendered in Figure 15.4.
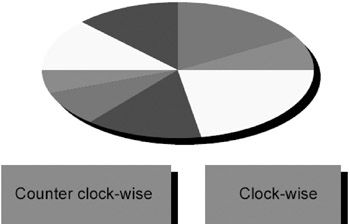
Figure 15.4: A mouse-based rotating circular pie chart.
The SVG document in Listing 15.5 demonstrates how to rotate a circular pie chart either clockwise or counterclockwise before rendering the pie chart.
Listing 15.5 mouseCircularPieChartShadow1.svg
<?xml version="1.0" standalone="no"?> <!DOCTYPE svg PUBLIC "-//W3C//DTD SVG 20010904//EN" "http://www.w3.org/TR/2001/REC-SVG-20010904/DTD/svg10.dtd"> <svg width="100%" height="100%" onload="init(evt)" xmlns="http://www.w3.org/2000/svg"> <script type="text/ecmascript"> <![CDATA[ var basePointX = 300.; var basePointY = 150.; var currentX = 0.0; var currentY = 0.0; var offsetX1 = 0.0; var offsetY1 = 0.0; var offsetX2 = 0.0; var offsetY2 = 0.0; var radius = 100.; var startAngle = 0.; var angleDelta = 8.; var angleDirection = 1.; var maxAngle = 180.; var angleSum1 = 0.; var angleSum2 = 0.; var vertexCount = 8.; var xPts = Array(vertexCount); var yPts = Array(vertexCount); var angles = Array(vertexCount); var pointPath = ""; var circleColors = ['red','green', 'blue','yellow']; var colorCount = 4.; var pieNode = null; var circleNode = null; var svgDocument = null; var target = null; var gcNode = null; function init(event) { target = event.getTarget(); svgDocument = target.getOwnerDocument(); gcNode = svgDocument.getElementById("gc"); initializeChart(); drawChart(event); } function initializeChart() { angles[0] = 30.; angles[1] = 60.; angles[2] = 45.; angles[3] = 45.; angles[4] = 20.; angles[5] = 30.; angles[6] = 50.; angles[7] = 80.; } // initializeChart function rotateCounterClockwise(event) { startAngle += angleDelta*angleDirection; if( startAngle > 360 ) startAngle = 0; drawChart(event); } function rotateClockwise(event) { startAngle -= angleDelta*angleDirection; if( startAngle < 0 ) startAngle += 360; drawChart(event); } function drawChart(event) { circleNode = svgDocument.createElement("circle"); circleNode.setAttribute("cx", basePointX+10); circleNode.setAttribute("cy", basePointY+10); circleNode.setAttribute("r", radius); circleNode.setAttribute("style","fill:black;"); parent.appendChild(circleNode); for(var v=0; v<vertexCount; v++) { angleSum2 = angleSum1+angles[v]; offsetX1 = radius*Math.cos( (startAngle+angleSum1)*Math.PI/180); offsetY1 = radius*Math.sin( (startAngle+angleSum1)*Math.PI/180); offsetX2 = radius*Math.cos( (startAngle+angleSum2)*Math.PI/180); offsetY2 = radius*Math.sin( (startAngle+angleSum2)*Math.PI/180); currentX = basePointX+offsetX2; currentY = basePointY-offsetY2; // the vertical offset must be subtracted, // so we need to "flip" the sign of offsetY1 offsetY1 *= -1; pointPath = "M"+basePointX+","+basePointY; pointPath += " l"+offsetX1+","+offsetY1; pointPath += " A"+radius+","+radius+" 0 0 0 "; pointPath += currentX+","+currentY; pointPath += " L"+basePointX+","+ basePointY+"z"; fillColor = "fill:"+ circleColors[v%colorCount]; pieNode = svgDocument.createElement("path"); pieNode.setAttribute("d", pointPath); pieNode.setAttribute("style",fillColor); gcNode.appendChild(pieNode); angleSum1 += angles[v]; } } // drawChart ]]> </script> <!-- ============================ --> <g transform="translate(10,10)"> <rect x="0" y="0" width="800" height="500" fill="none" stroke="red"/> </g> <g transform="translate(50,300)"> <rect fill="black" x="10" y="10" width="250" height="100"/> <rect onclick="rotateCounterClockwise(evt)" fill="red" x="0" y="0" width="250" height="100"/> <text font-size="24" x="20" y="50"> Counter clock-wise </text> <rect fill="black" x="310" y="10" width="200" height="100"/> <rect onclick="rotateClockwise(evt)" fill="red" x="300" y="0" width="200" height="100"/> <text font-size="24" x="350" y="50"> Clock-wise </text> </g> </svg>
Remarks
The SVG code in Listing 15.5 for rendering a circular chart is the same as the code in Listing 15.1. This example also contains two 'mouse-aware' rectangles that are used for rotating the pie chart clockwise and counterclockwise:
<rect onclick="rotateCounterClockwise(evt)" fill="red" x="0" y="0" width="250" height="100"/> <text font-size="24" x="20" y="50"> Counter clock-wise </text> <rect fill="black" x="310" y="10" width="200" height="100"/> <rect onclick="rotateClockwise(evt)" fill="red" x="300" y="0" width="200" height="100"/> <text font-size="24" x="350" y="50"> Clock-wise </text>
When you click your mouse inside the left rectangle, the pie chart will rotate counterclockwise, and when you click in the right rectangle, the rotation is clockwise. The ECMAScript functions that make this possible are given below:
function rotateCounterClockwise(event) { startAngle += angleDelta*angleDirection; if( startAngle > 360 ) startAngle = 0; drawChart(event); } function rotateClockwise(event) { startAngle -= angleDelta*angleDirection; if( startAngle < 0 ) startAngle += 360; drawChart(event); } As you can see, the previous functions either increment or decrement the value of the variable startAngle and ensure that its value lies between 0 and 360. Next, the ECMAScript function drawChart() is invoked, which then renders the rotated pie chart.
The CD-ROM for this chapter contains the SVG document that renders a 'mouse-aware' circular pie chart that allows you to 'explode' individual wedges of the pie chart.
|
|
|
EAN: 2147483647
Pages: 362