Drawing Simple Line Graphs
|
|
|
Drawing Multiple Line Graphs
Consider the line graphs in Figure 10.7.
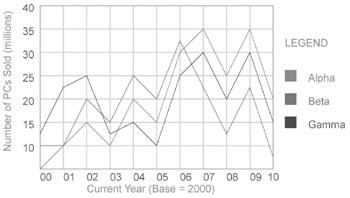
Figure 10.7: Multiple line graphs.
The SVG document in Listing 10.7 demonstrates how to render a set of line graphs.
Listing 10.7 multiLineGraph1.svg
   <?xml version="1.0" encoding="iso-8859-1"?>    <!DOCTYPE svg PUBLIC "-//W3C//DTD SVG 20001102//EN"    "http://www.w3.org/TR/2000/CR-SVG-20001102/DTD/svg-
      20001102.dtd">    <!-- *** STEP 7:  render line graphs *** -->    <!-- Company Name: Alpha -->    <g transform="translate(80,30)">    <path       d="m0,240         l40,0   40,-40  40,40  40,-80          40,40  40,-120 40,-40 40,80          40,-80 40,120"      style="fill:none;stroke:red;fill-opacity:1;"/>    </g>    <!-- Company Name: Beta -->    <g transform="translate(80,30)">    <path      d="m0,280        l40,-40 40,-80  40,40  40,-80         40,40  40,-100 40,80  40,80         40,-80 40,120"      style="fill:none;stroke:green;fill-opacity:1;"/>    </g>    <!-- Company Name: Gamma -->    <g transform="translate(80,30)">    <path      d="m0,220        l40,-80 40,-20  40,100 40,-20         40,40  40,-120 40,-40 40,80         40,-80 40,120"      style="fill:none;stroke:blue;fill-opacity:1;"/>    </g>    <!-- *** STEP 8:  company legend *** -->    <g transform="translate(500,100)">      <text  x="0" y="0"            fill="red"            font-size="18">            LEGEND      </text>      <rect fill="red"            x="0" y="40" width="20" height="20"/>      <text  x="40" y="60"            fill="red"            font-size="18">            Alpha      </text>   <rect fill="green"         x="0" y="80" width="20" height="20"/>     <text  x="40" y="100"           fill="green"           font-size="18">           Beta      </text>      <rect fill="blue"            x="0" y="120" width="20" height="20"/>      <text  x="40" y="140"            fill="blue"            font-size="18">            Gamma      </text>    </g>    </svg>
Remarks
The SVG code in Listing 10.7 extends the previous example by showing you how to render multiple line graphs in the same SVG document. You can find the complete code for in the folder for this chapter on the accompanying CD-ROM.
Step 7 of the SVG code consists of three SVG polygon elements that render the actual line graph for three fictional companies named Alpha, Beta, and Gamma.
Step 8 of the SVG code consists of a legend that consists of three colored squares that correspond to the three fictional company names. The color of each square is the association between each company and its corresponding line graph.
You can use different colors in conjunction with the various attributes of the SVG line element (such as the stroke-dasharray and stroke-width) in order to render line graphs that create a nice contrasting effect.
|
|
|
EAN: 2147483647
Pages: 362