Performance and Scalability Enhancements
| MRTG uses flat-file databases to store its results. Also, every time the database is updated, new HTML and graphic pages are generated, creating high CPU utilization and disk activity. These factors contribute to the performance and scalability limitations of MRTG; the most notable limitations are as follows:
Additionally, MRTG can only display two variables in a single graph. When monitoring a large number of nodes, you can use one of the following two options:
RRDToolRRDTool, an acronym for Round Robin Database Tool, is a fixed-size database tool with the capability to generate graphs. It was created by Tobias Oetiker, the author of MRTG. RRDTool acts as a database and graphing back end. RRDTool can be integrated into MRTG for improved performance, reduced data-collection intervals, and better graphs. However, after adding RRDTool, MRTG (version 2.x) also needs an external script to generate HTML pages. According to the author, RRDTool will be fully integrated in MRTG version 3. CricketCricket, according to its author, Jeff Allen, is the MRTG on steroids. Cricket can easily monitor more than 50 nodes, providing a significant performance improvement over MRTG. Cricket also uses RRDTool as its back-end component. Although Cricket is similar to MRTG, the configuration files are not compatible. Cricket provides the config-tree command to apply configuration parameters in a hierarchical manner to the child objects. This makes it comparatively easy to manage a large number of monitored devices. Cricket enjoys community-wide support and can be downloaded from http://cricket.source-forge.net. Figure 6-6 shows a sample screen shot of traffic flow through the Fast Ethernet interface of the host Router-NewYork. Notice the similarity of the graphs to those generated by MRTG. Also, in the upper-right corner, Cricket includes a link for generating various views, such as daily, weekly, monthly, and yearly. Figure 6-6. Cricket Sample Page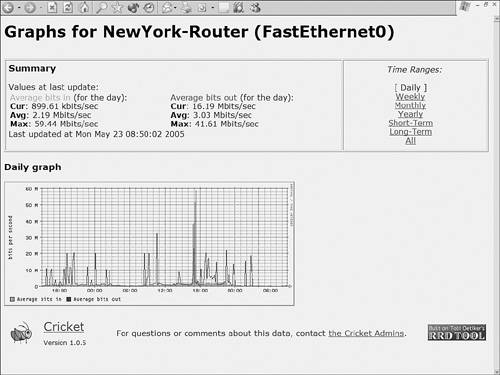 Cricket has been further enhanced into another product called Percival, which can be downloaded from http://percival.sourceforge.net. According to the developers of Percival, it can monitor 22,000 interfaces within a polling interval of 300 seconds. Deploying a Windows-Based Performance-Monitoring System CactiCacti, available at http://www.cacti.net, is another performance-monitoring tool that is based on the original work of MRTG. Similar to MRTG, Cacti creates HTML reports that contain histogram graphs. Unlike its predecessor, Cacti graphs can be customized on-thefly by using drop-down menus. Cacti periodically polls and collects performance-monitoring data from network devices through built-in SNMP scripts. The Cacti architecture consists of the RRDTool and MySQL database back ends for storing the monitoring data and creating graphs. However, the biggest advantage of using Cacti rather than other tools is its web-based graphical user interface (GUI). This allows complete administration of Cacti with no knowledge of its internal configuration files. After the initial installation and some manual tweaking, routine administration of Cacti can be done by IT staff with basic Windows and web-browser skills. This feature is important in environments that need better monitoring tools but have IT personnel with only basic skills and little (or no) Linux knowledge. Some other useful features of Cacti are as follows:
The following sections cover the details of deploying Cacti on a Windows machine. Note that with the exception of the installation procedure and location of the system files, the discussion is equally applicable to deploying Cacti on Linux machines. Installing CactiCacti is ideally suited for deployment in Windows-based (read click-n-run) environments but requires significant installation efforts. Cacti needs the Windows version of the following third-party applications or tools to run correctly:
Cacti can have incompatibility issues with various versions of these tools because they are under constant development. Check the Cacti documentation at http://www.cacti.net for more up-to-date details on using the correct version of each tool and to obtain the associated installation steps. After installing each of these tools, you can download and install the Windows version of Cacti from http://www.cacti.net. Configuring CactiAfter installing Cacti and the prerequisite tools (or applications), you can configure Cacti through the web-based GUI. The GUI provides an interface for configuring as well as viewing the performance-monitoring graphs. To access the Cacti GUI, point your web browser to the URL http://cacti-server-ip-address/cacti and enter the following default authentication information:
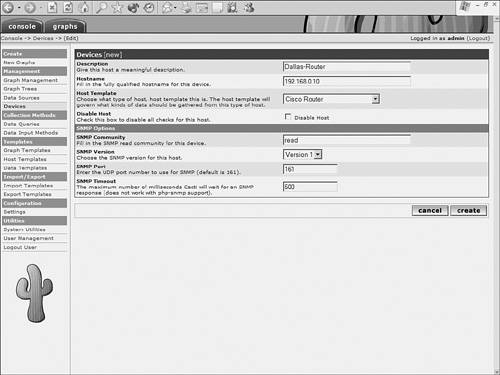
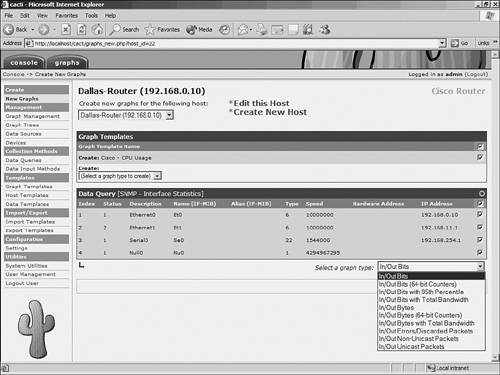
After logging in, Cacti might prompt you to change the default password of admin. After changing the default password, you see the Cacti console screen, as shown in Figure 6-7. The navigation bar on the left side of the console page provides links for adding devices and graphs. Figure 6-7 provides details regarding some of the useful links. Figure 6-7. Cacti Console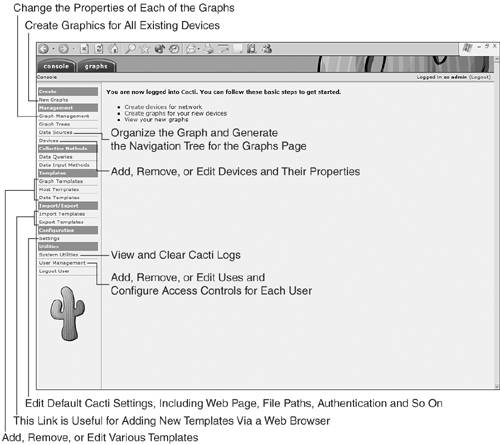 Next, navigate to the Paths page by clicking Configuration > Settings > Paths in the navigation bar at the left of the default console screen. Enter the destination path for each tool according to your installation. Correct configuration of this screen is important and any misconfiguration can render Cacti inoperable. The entries shown in Figure 6-8 are based on the working copy of Cacti on the author's Cacti server. Note that the installation was done according to the Cacti installation manual provided at the Cacti website (http://www.cacti.net). Figure 6-8. Cacti Settings Paths Page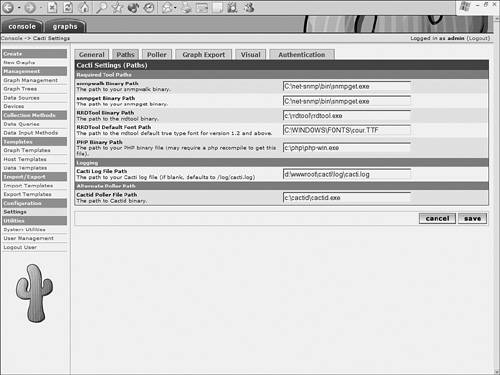 Out of the box, Cacti contains the entry for monitoring the host machine itself (the Localhost entry). Additionally, Cacti contains built-in templates for monitoring CPU usage and interface statistics on Cisco routers. To configure Cacti to monitor a Cisco device, follow these steps:
Figure 6-11. Creating a Graph Tree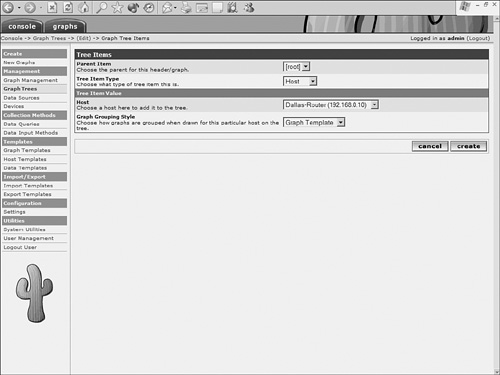 Cacti can also monitor other statistics, such as CPU usage on CatOS-based Catalyst switches, free memory on PIX Firewalls, VPN sessions on VPN 3000 concentrators, and so on. You can manually copy and tweak the built-in templates to suit your needs. However, the user forum on the Cacti website has a section dedicated to such add-on scripts. Moreover, these additional templates are available in XML format that can be easily imported into your existing Cacti server. You can find many such useful templates in the Scripts and Other Addons for Cacti section of the Cacti user forum at http://www.cacti.net. Download the desired templates and save them on your local computer. To import these templates into Cacti, follow these steps:
After you import the template, it is ready for use. Figure 6-12 illustrates the use of the new host template Cisco - VPN 3000. This template adds a Cisco VPN 3000 concentrator with host name VPN-Dallas and IP address 192.168.0.5. Note the four graph template entries in the Associated Graph Templates section. These entries were automatically added by Cacti as result of selecting the Cisco - VPN 3000 template. Figure 6-12. Adding a Device Using the Cisco-VPN 3000 Template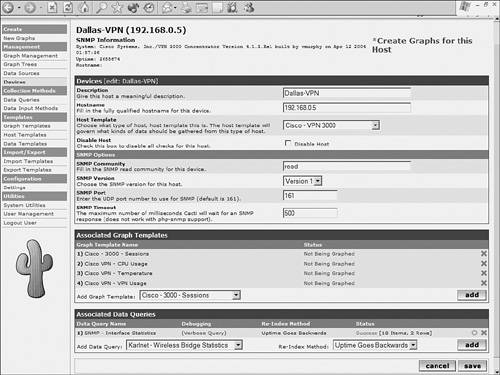 Running the Cacti ServerCacti uses poller.php script for polling all the devices to collect the monitoring data. To test the configuration and operation of Cacti, you must first run the poller.php script from the Windows CLI as follows: C:\php>PHP.EXE d:\wwwroot\cacti\poller.php OK u:0.01 s:0.00 r:0.96 OK u:0.01 s:0.00 r:1.06 OK u:0.01 s:0.00 r:1.07 OK u:0.01 s:0.01 r:1.98 05/22/2005 12:47:42 AM - SYSTEM STATS: Time: 2.0913 s, Method: cmd.php, Processes: 1, Threads: N/A, Hosts: 2, Hosts/Process: 2 This command also shows the total time taken by the poller.php script to poll all the devices. As highlighted in the command output, poller.php took 2.0913 seconds. You can use this command to diagnose performance issues caused by monitoring a larger number of devices or parameters. For Cacti to work properly, the total time should not exceed 300 seconds. The 300-second limitation is discussed in the following paragraphs. After manually testing the poller.php script, you can automate the polling process by using the Windows Scheduler service. The poller.php script must run every 5 minutes using the suitable PHP executable file. For details regarding setting up the Windows Scheduler, along with other details such as filenames and paths, refer to the Cacti installation manual. After the poller.php script runs a couple of times, you can view the graphs by clicking the graphs tab at the top of the navigation bar on the Cacti page. The navigation bar on the graph page is based on the Graph Tree configuration in the console page. Figure 6-13 shows the default tree, which contains four host entries in the navigation bar. Additionally, the page shows various graphs associated with Dallas-Router. Note that the graphs show the activities monitored during the last hour. You can choose different views through the Presets drop-down menu; views can range from the last half-hour to the last 2 years. The bottom of every graph contains the color legend used in creating the graph. Additional text provides a snapshot of the current, average, and maximum values of the monitored parameters. For example, as shown in Figure 6-13, during the last hour, CPU utilization of Dallas-Router reached a maximum of 3 percent, an average of 2 percent, and a current value of 2 percent at the time of the snapshot. Figure 6-13. Cacti Graphs Host View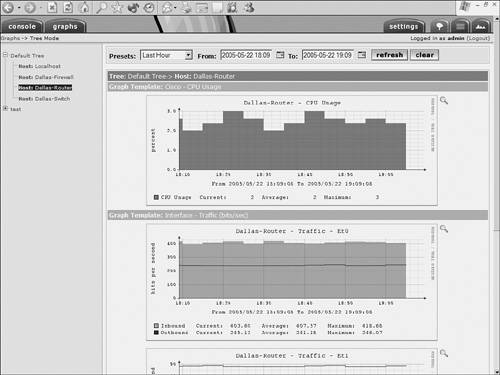 You can click each of the hosts to view the graphs associated with the hosts. Furthermore, you can click each graph to check the daily, weekly, monthly, and yearly views. Figure 6-14 shows the weekly, monthly, and yearly views for the CPU usage of Dallas-Router. Such reports are useful for providing a quick snapshot of the overall status of the device (or the associated network) and to help avoid potential bottlenecks; they are also handy for capacity planning for your future needs. Figure 6-14. Cacti Graphs Detailed View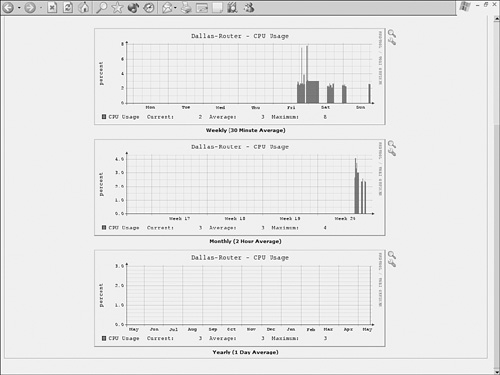 After it is configured, Cacti is easy to maintain and administer. You can control access to the Cacti web pages through the User Management link in the Utilities section of the navigation bar. Moreover, you can also use the following URL to provide guest access to the Cacti pages:
This URL lacks a tab for the console section, does not require authentication, and is handy for providing view-only access to help desk personnel. You can also use the URL to integrate network performance-monitoring graphs into company intranets. The poller.php script runs every 5 minutes and uses the cmd.php script. Consequently, Cacti has 300 seconds to poll all the devices, collect the information, and update the RRDTool database. This can lead to performance bottlenecks when monitoring a large number of hosts or graphs. To circumvent this potential problem, Cacti offers Cactid as a replacement for the slower cmd.php. To use Cactid, first install it on the same machine that is hosting the Cacti server. Next, choose Console > Configuration > Settings > Poller, and in the Poller Type section, choose Cactid from the drop-down menu. Click the save button to save the settings. Cacti now uses Cactid instead of cmd.php every time the Windows Scheduler runs the poller.php script. |
EAN: 2147483647
Pages: 106