Deploying Network Performance-Monitoring Tools
| When deploying a performance-monitoring system, you can install performance-monitoring tools on a Linux or Windows computer. The host computer should be connected to the network with appropriate Transmission Control Protocol/Internet Protocol (TCP/IP) settings. Typically, the performance-monitoring tool consists of an SNMP-manager engine for polling the monitored devices. The SNMP manager also listens for SNMP traps sent by the monitored devices. Performance-monitoring tools also use custom scripts or plug-ins to collect other information that cannot be measured through SNMP. The results of SNMP polls, SNMP traps, and custom scripts are stored in an internal database. The performance-monitoring tool then creates trending reports from the database and publishes these reports through a web server. In comparison with the network-monitoring system (discussed in the previous chapter), which provides only host-up or -down status, a performance-monitoring system provides far more details, such as traffic flowing into and out of an interface or the CPU utilization on the router. Although SNMP-based network-management systems are often referred to as NMSs, network performance-monitoring tools can also be loosely classified as NMSs. Figure 6-2 shows the architecture of a network performance-monitoring system. Figure 6-2. Network Performance Monitoring System The following sections discuss deploying Linux- and Windows-based performance-monitoring tools based on the operating system used. Deploying a Linux-Based Performance-Monitoring System MRTGThe Multi-Router Traffic Grapher (MRTG), by Tobias Oetiker, is arguably one of the most popular open source tools used by the Cisco community. MRTG is an excellent tool for performance monitoring of network devices. Although the name suggests that MRTG is for routers, it can also monitor other network devices, including switches, firewalls, VPN concentrators, web servers, and so on. MRTG was originally developed as a Perl script to monitor the traffic load on router interfaces and provide a visual representation. Since then, the product has matured into a fully functional SNMP-based tool capable of monitoring any SNMP parameters in network devices. The internal architecture of MRTG consists of a collection of Perl scripts that query target SNMP agents. The results of the queries are logged in a database that generates graphic and HTML files that can be published by Apache or other web servers. Note that the MRTG reports only contain histogram graphs that depict the monitoring results over time intervals ranging from hourly to yearly periods. The MRTG reports do not provide other formats such as text, spreadsheets, or pie charts. Following are some features of MRTG:
Figure 6-3 provides a sample of MRTG. The figure shows the Daily Graph for traffic flowing into and out of the Ethernet0 interface of Router-Dallas. The graph is created by MRTG using samples collected from the router at regular intervals. Although not included in the screenshot, by default, MRTG creates four separate histogram graphs for each monitored parameter. Figure 6-3. MRTG Sample Page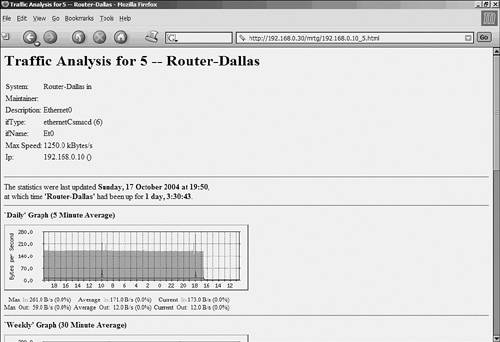 The histogram for the daily view is created by using samples collected every 5 minutes. The weekly graph is created by calculating a 30-minute average from the collected samples, while the monthly and yearly graphs use 2-hour averages and 1-day averages, respectively. Additional information at the bottom of each graph provides a snapshot of the maximum, average, and current value in absolute and percentage terms. For example, the daily graph in Figure 6-3 shows that the maximum traffic flowing in is 261 bytes per second. The 0.0% in parentheses indicates the value relative to the maximum speed of 1250.0 kilobytes per second (kBps) of the Ethernet interface, according to the following equation:
Although not apparent in this text, different colors indicate different parameters within the graph. This particular graph shows the bytes per second flowing into and out of the Ethernet interface. The darker line (closer to the x axis of the graph) indicates the bytes per second flowing out of the interface, while the lighter shaded region (covering the middle part of the graph) indicates the bytes per second flowing into the interface. Such views provide a quick snapshot of the overall performance of that particular interface (or the device on the associated network) and help to identify potential bottlenecks. For deployment in a Linux environment, you must first install and configure MRTG according to your needs. You can then start running MRTG to monitor various devices. The following sections cover several of these tasks in detail. Additionally, for clarity, the configuration section is based on a sample Cisco network. Installing MRTGMRTG is available in source code for download at http://www.mrtg.org. For MRTG to function correctly, it requires the precompiled libraries listed in Table 6-1.
To install MRTG, follow these steps:
These installation steps are generic and should work for most Linux distributions. MRTG is also available as a precompiled package with many Linux distributions. Debian users can avoid the previous installation steps by using the apt-get command, as follows: linuxbox:~# apt-get install mrtg This command is a timesaver and provides a hassle-free method of deploying MRTG. Note Linux users often spend too much time troubleshooting dependency issues when installing multiple libraries. Try to use the precompiled version of MRTG. The precompiled MRTG Debian packages are stable and suitable for use in Cisco environments. Configuring the MRTGMRTG is configured through the mrtg.cfg text file. This file contains the details of the network devices and their interfaces that are to be monitored by MRTG. Based on the contents of the mrtg.cfg file, MRTG generates graphs that illustrate the traffic pattern for each monitored interface. Although you can manually edit the mrtg.cfg file, MRTG includes a handy utility called cfgmaker. The cfgmaker tool provides a quick-and-easy way of populating the mrtg.cfg file with details of the monitored devices. However, cfgmaker can only help monitor the interface statistics. To monitor other parameters, such as CPU utilization, VPN sessions, or firewall connections, you must manually edit the mrtg.cfg file. To simplify the learning and deployment process, the following sections first discuss the cfgmaker tool and demonstrate its use for creating a sample mrtg.cfg file. Next are the details regarding the mrtg.cfg file itself. Finally, you learn about the indexmaker utility. Understanding the cfgmaker ToolAs previously mentioned, the purpose of cfgmaker is to create mrtg.cfg files on-the-fly. The cfgmaker tool queries each monitored host through SNMP, collects interface-related details, and generates the configuration for monitoring each discovered interface. The output of cfgmaker is ready for use within the mrtg.cfg file. The default location of this tool is the /usr/bin/cfgmaker directory. The command syntax is as follows: cfgmaker [ options] [snmpstring@] router > destination_file In this syntax, router can be the IP address or host name of the any SNMP-capable device, including routers or switches; snmpstring is the SNMP community configured on the monitored device. The SNMP community is used as a password by cfgmaker to poll the target hosts and collect information through SNMP. Multiple devices can be specified in a single instance. For a large number of devices, separate each entry using the backslash (\) character. By default, the output of cfgmaker is stdout, meaning that the output is displayed onscreen. The output should be redirected to a file for MRTG to use, as indicated by the > destination_file option within the syntax. Figure 6-4 shows the network of ABC Investments. The Netadmin is using the Linux machine to monitor the performance of Cisco devices using SNMP. Figure 6-4. ABC Investments Network Monitoring Example 6-1 shows the use of cfgmaker to create the /etc/mrtg.cfg file for the LAN devices of ABC Investments. The example uses the IP address of the monitored device. You can also specify the host name if the MRTG server can resolve the host name through the Domain Name System (DNS). The example also shows the contents of the resultant file. Note that lines starting with a hash mark or pound sign (#) are treated as comments. Example 6-1. Sample mrtg.cfg Filelinuxbox~# cfgmaker read@192.168.0.5 read@192.168.0.10 read@192.168.0.20 > /etc/ mrtg.cfg linuxbox~# cat /etc/mrtg.cfg # Created by # /usr/bin/cfgmaker read@192.168.0.5 read@192.168.0.10 read@192.168.0.20 ### Global Config Options # for Debian WorkDir: /var/www/mrtg # or for NT # WorkDir: c:\mrtgdata ### Global Defaults # to get bits instead of bytes and graphs growing to the right # Options[_]: growright, bits ###################################################################### # System: 1 # Description: Cisco Systems, Inc./VPN 3000 Concentrator Version 4.1.3.Rel built by vmurphy on Apr 12 2004 01:57:36 # Contact: # Location: ###################################################################### ### Interface 1 >> Descr: '' | Name: '' | Ip: '192.168.0.5' | Eth: '00-90-a4-00-4c- 5c' ### Target[192.168.0.5_1]: 1:read@192.168.0.5: SetEnv[192.168.0.5_1]: MRTG_INT_IP="192.168.0.5" MRTG_INT_DESCR="" MaxBytes[192.168.0.5_1]: 12500000 Title[192.168.0.5_1]: Traffic Analysis for 1 -- 1 PageTop[192.168.0.5_1]: <H1>Traffic Analysis for 1 -- 1</H1> <TABLE> <TR><TD>System:</TD> <TD>1 in </TD></TR> <TR><TD>Maintainer:</TD> <TD></TD></TR> <TR><TD>Description:</TD><TD> </TD></TR> <TR><TD>ifType:</TD> <TD>ethernetCsmacd (6)</TD></TR> <TR><TD>ifName:</TD> <TD></TD></TR> <TR><TD>Max Speed:</TD> <TD>12.5 MBytes/s</TD></TR> <TR><TD>Ip:</TD> <TD>192.168.0.5 ()</TD></TR> </TABLE> ###################################################################### # System: Router-Dallas # Description: Cisco Internetwork Operating System Software # IOS (tm) 1600 Software (C1600-OSY56I-L), Version 12.1(16), RELEASE SOFTWARE (fc1) # Copyright 1986-2002 by cisco Systems, Inc. # Compiled Mon 08-Jul-02 18:51 by kellythw # Contact: # Location: ###################################################################### ### Interface 5 >> Descr: 'Ethernet0' | Name: 'Et0' | Ip: '192.168.0.10' | Eth: '00- 50-73-21-d0-67' ### Target[192.168.0.10_5]: 5:read@192.168.0.10: SetEnv[192.168.0.10_5]: MRTG_INT_IP="192.168.0.10" MRTG_INT_DESCR="Ethernet0" MaxBytes[192.168.0.10_5]: 1250000 Title[192.168.0.10_5]: Traffic Analysis for 5 -- Router-Dallas PageTop[192.168.0.10_5]: <H1>Traffic Analysis for 5 -- Router-Dallas</H1> <TABLE> <TR><TD>System:</TD> <TD>Router-Dallas in </TD></TR> <TR><TD>Maintainer:</TD> <TD></TD></TR> <TR><TD>Description:</TD><TD>Ethernet0 </TD></TR> <TR><TD>ifType:</TD> <TD>ethernetCsmacd (6)</TD></TR> <TR><TD>ifName:</TD> <TD>Et0</TD></TR> <TR><TD>Max Speed:</TD> <TD>1250.0 kBytes/s</TD></TR> <TR><TD>Ip:</TD> <TD>192.168.0.10 ()</TD></TR> </TABLE> ###################################################################### # System: Firewall-Dallas # Description: Cisco PIX Firewall Version 6.3(3) # # Contact: SPOPE # Location: DALLAS ###################################################################### ### Interface 2 >> Descr: 'PIX Firewall 'inside' interface' | Name: '' | Ip: '192.168.0.20' | Eth: '00-07-50-57-e2-69' ### Target[192.168.0.20_2]: 2:read@192.168.0.20: SetEnv[192.168.0.20_2]: MRTG_INT_IP="192.168.0.20" MRTG_INT_DESCR="PIX Firewall 'inside' interface" MaxBytes[192.168.0.20_2]: 12500000 Title[192.168.0.20_2]: Traffic Analysis for 2 -- Firewall-Dallas PageTop[192.168.0.20_2]: <H1>Traffic Analysis for 2 -- Firewall-Dallas</H1> <TABLE> <TR><TD>System:</TD> <TD>Firewall-Dallas in DALLAS</TD></TR> <TR><TD>Maintainer:</TD> <TD>SPOPE</TD></TR> <TR><TD>Description:</TD><TD>PIX Firewall 'inside' interface </TD></TR> <TR><TD>ifType:</TD> <TD>ethernetCsmacd (6)</TD></TR> <TR><TD>ifName:</TD> <TD></TD></TR> <TR><TD>Max Speed:</TD> <TD>12.5 MBytes/s</TD></TR> <TR><TD>Ip:</TD> <TD>192.168.0.20 ()</TD></TR> </TABLE> Tip By default, cfgmaker generates the configuration for all the interfaces but comments out the configurations for inactive (or administratively down) interfaces. Use the --no-down option with cfgmaker to override this behavior. Additionally, cfgmaker selects the interfaces by their number, which can change because of the addition or removal of modules. This change can cause MRTG to misinterpret the contents of the mrtg.cfg file. In such cases, cfgmaker provides the --ifref descr option, to select the interfaces by their description, or the --ifref ip option, to select interfaces by IP addresses. The cfgmaker utility is great for setting up a basic MRTG system that can monitor traffic flowing into and out of interfaces. Readers interested in only setting up such a basic MRTG system can skip the next section, which covers the details of the mrtg.cfg file. Understanding the mrtg.cfg FileAs previously discussed, cfgmaker has a major limitation in that it can only create mrtg.cfg files to monitor interface traffic. To monitor other SNMP variables, such as CPU and memory utilization, router uptime, and chassis environments, Netadmins should manually edit the mrtg.cfg file. However, before editing, you must have a thorough understanding of the various options that are used within the mrtg.cfg file. The default location of the mrtg.cfg file for the precompiled Debian package is /etc/mrtg.cfg. The mrtg.cfg file uses predefined keywords to specify various monitoring options. The keywords must be specified at the beginning of the line. Also, lines starting with a hash mark or pound sign (#) are treated as comments. Table 6-2 provides a partial list of global keywords that affect the default behavior of MRTG.
As mentioned in the introduction to the MRTG, all the reports generated by the MRTG are histogram graphs. The generation and display of these graphs can be customized by using various keywords in the mrtg.cfg file. Additional keywords within the mrtg.cfg file control the MRTG properties, such as the web-page formats, SNMP variables, and even external scripts for pulling non-SNMP statistics. Table 6-3 provides a partial list of these keywords that are helpful in customizing monitoring properties and graphs generated by the MRTG.
In Table 6-3, the Target keyword is the most important local directive of the mrtg.cfg file. Table 6-4 provides a list of commonly used Target options.
Now that you have a better understanding of the various components of the mrtg.cfg file, this section provides several templates that can be added to this file. These templates help Netadmins to monitor some of the common parameters, such as memory and CPU utilization, of Cisco IOS-based routers and switches, VPN 3000 Series concentrators, and PIX Firewalls. Note that these templates do not come preinstalled with MRTG installation files, but they are included here for Netadmins. You can use each of these templates by replacing community by the read-only SNMP community string and host by the IP address of your device. Additionally, some of the templates include embedded comments for specific information. You can add the following templates to the mrtg.cfg file:
Understanding the indexmaker ToolWhen monitoring multiple interfaces and variables, the number of HTML pages can get very large. Fortunately, MRTG provides a tool, called indexmaker, that parses the mrtg.cfg file and generates a summary page in HTML format. The single-page summary provides the daily view of the histogram graph that depicts the current status of all the monitored parameters. Moreover, each graph contains embedded hyperlinks that, when clicked, take you to the page that contains the daily, weekly, monthly, and yearly views of the histogram graphs. The command syntax is indexmaker [ options ] mrtg.cfg. Similar to cfgmaker, indexmaker also outputs the result to the screen. You should redirect the output to a file using the > option. Example 6-2 shows the command that creates the summary page index.html from the /etc/mrtg.cfg file. Example 6-2. Indexmaker Toollinuxbox:~# indexmaker /etc/mrtg.cfg > /var/www/mrtg/index.html linuxbox:~# cat /var/www/mrtg/index.html <!DOCTYPE html PUBLIC "-//W3C//DTD HTML 4.0 Transitional//EN"> <HTML> <HEAD> <TITLE>MRTG Index Page</TITLE> <META HTTP-EQUIV="Refresh" CONTENT="300"> <META HTTP-EQUIV="Cache-Control" content="no-cache"> <META HTTP-EQUIV="Pragma" CONTENT="no-cache"> <META HTTP-EQUIV="Expires" CONTENT="Sat, 16 Oct 2004 07:56:58 GMT"> </HEAD> # --- output truncated --- The resulting web page from the index.html code (generated in the previous example) is illustrated in Figure 6-5. Figure 6-5. Output of index.html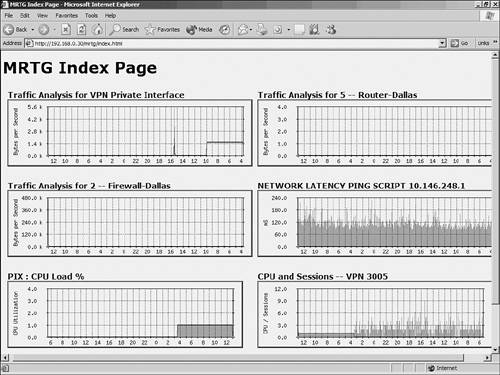 Running MRTGBefore running MRTG, test the mrtg.cfg file by using the following mrtg script: linuxbox:~#/usr/bin/mrtg /etc/mrtg.cfg Note that the first two instances of running MRTG will generate error messages regarding the missing log files. After successfully testing the mrtg.cfg file, you can automate MRTG process using cron, which is a Linux utility that periodically runs specified tasks in the background. Crontab is a file that contains the schedule of cron entries to be run and the specified times. The steps for running MRTG through cron are as follows:
These steps run MRTG every 5 minutes, poll the devices listed in the mrtg.cfg file, and update the graphs. Note By default, the MRTG package for Debian installs the script in the /etc/cron.d/ directory for running the MRTG program daily every 5 minutes. MRTG Debian package users can ignore the previous steps. Deploying a Windows-Based Performance-Monitoring System MRTGBecause MRTG also comes in a Windows version, the Netadmin can easily deploy it on a Windows machine. The Windows version of MRTG supports Windows NT, XP, 2000, and 2003 servers. The file options and tools are identical to those of the Linux counterpart. However, several minor differences are specific to the Windows environment. These differences are covered in the following steps. MRTG in Windows requires fully functional installations of Perl and web servers to work correctly. The general guidelines for deploying a Windows-based MRTG system are as follows:
Tip To run MRTG in the background, use the following command, as suggested by MRTG website: d:\mrtg\bin> start /Dc:\mrtg\bin wperl mrtg --logging=eventlog mrtg.cfg You can also use Microsoft's RunsAsService tool to run MRTG as a background service. |
EAN: 2147483647
Pages: 106