Implementing NURBS in Code
| | | ||||||||||||||||||||||||||
| ||||
| | ||||
The Effects of Weighting Factors
In the previous chapter, I showed how the relative effect of each control point could be influenced by changes to the knot vector and/ or multiplicity of control points. In the case of the knot vector, changes had an effect on the range of influence for control points. In a given range, one control point might have more influence than the others due to a nonuniform knot vector.
Multiple control points were a crude way of affecting how the curve was pulled toward a given point. If all points have the same amount of "pull", doubling a control point effectively doubled its overall influence on the curve.
The addition of a weighting factor has a similar effect. If all the entries in the weight vector are set to 1, the result is the same as the B-splines seen in Chapter 4. Increasing the weights of control points relative to the others will give those points more pull on the curve, thereby influencing the shape of the curve. These effects are easiest to see when applied to a single control point. In the following examples, the curve is given with an open uniform knot vector (k=4) and the weight vector [1 1 w 1 1]. The next seven figures demonstrate the effect of changing the value of w.
Figures 5.1 and 5.2 show the curve and basis functions when w = 1. This curve is the same as an irrational B-spline (B-splines are just special cases of NURBS).
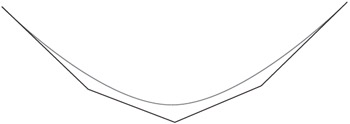
Figure 5.1: B-spline from NURBS (w = 1).
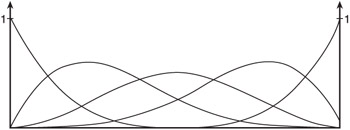
Figure 5.2: Basis functions for Figure 5.1.
In Figures 5.3 and 5.4, the value of w has been set to 0. If k=3, this would produce a straight line between the second and fourth control points. This wouldn't be surprising, because a weight of 0 would effectively remove the third control point from the equation. The third control point has no influence on the curve points in that range.
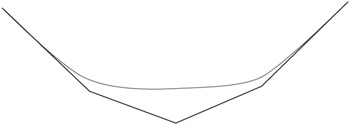
Figure 5.3: Removing the influence of a control point (w = 0).
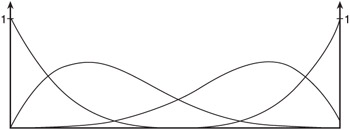
Figure 5.4: Basis functions for Figure 5.3.
The ability to dynamically "remove" the effects of control points or to create straight line segments could come in handy for some applications.
Figures 5.5 and 5.6 show what happens when w is set to some large number. As you can see, the relative influence of that point becomes much greater and the curve is pulled closer to that control point. In fact, the curve is pulled exactly to the control point when w equals infinity, but infinity is frequently an inconvenient value in code.
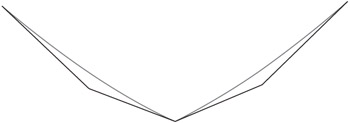
Figure 5.5: Pulling a curve to a control point (w = 10).
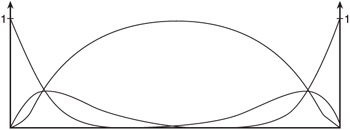
Figure 5.6: Basis functions for Figure 5.5.
Figure 5.6 shows that "heavier" basis functions "overpower" functions with lower weighting factors. This is something you should be mindful of.
Figure 5.7 shows several curves overlaid on top of each other with different values of w.

Figure 5.7: Several values of w.
| Note | Mathematically speaking, the endpoints of an open curve should always correspond to the first and last control points. In practical terms, this might not be true if some weights are extremely high. Rounding errors in the basis functions or parametric values could cause a very high weight to pull an endpoint away from the last control point. For instance, the curve point at t=0.9999 might be pulled toward an extremely "heavy" interior control point. Be aware of this, even though you will probably not need to set weights to extremely high values. |
Each of these examples has been based on the same open uniform knot vector. The basic effect is the same for periodic knot vectors. The only difference is that, as Figures 5.4 and 5.6 show, the resulting basis functions will not be translates of each other if the relative weights are different. The "peaks" of the basis functions will be pulled higher as they are weighted.
After you become familiar with the source code at the end of this chapter, explore the relative difference of different weighting factors on multiple control points, curves with k > 3, and different configurations. Also, try using negative weights. The basic structure of the source code is very similar to the code in Chapter 4.
As you will see in the source code, changes to the weight vector can be more computationally expensive than changes to the control points.
Therefore, you will probably want to make rough changes to the shape of the curve by moving the control points. You might find that changes to the weight vector are best suited for making very specific changes or specific shapes . One such specific case could be for drawing conic sections such as circles.
| | ||||
| ||||
| | ||||
EAN: 2147483647
Pages: 104