13. Statistics
Authors: Dahnert, Wolfgang
Title: Radiology Review Manual, 6th Edition
Copyright 2007 Lippincott Williams & Wilkins
> Table of Contents > Statistics
Statistics
Terminology
Incidence = number of diseased people per 100,000 population per year
Prevalence = number of existing cases per 100,000 population at a target date
Mortality = number of deaths per 100,000 population per year
Fatality = number of deaths per number of diseased
Decision matrix
| GOLD STANDARD | |||||
|---|---|---|---|---|---|
| normal | abnormal | subtotal | |||
| T E S T | |||||
| normal | TN | FN | T- | NPV | |
| abnormal | FP | TP | T+ | PPV | |
| subtotal | D- | D+ | total | preval | |
| specificity | sensitivity | acc | |||
TP = test positive in diseased subject
FP = test positive in nondiseased subject
FN = test negative in diseased subject
TN = test negative in nondiseased subject
T+ = abnormal test result
T- = normal test result
D+ = diseased subjects
D- = nondiseased subjects
Sensitivity
= ability to detect disease
= probability of having an abnormal test given disease
= number of correct positive tests / number with disease
= true positive ratio = TP / (TP + FN) = TP / D+
D+ column in decision matrix
 Independent of prevalence
Specificity
= ability to identify absence of disease
= probability of having a negative test given no disease
= number of correct negative tests / number without disease
= true negative ratio = TN / (TN + FP) = TN / D-
D- column in decision matrix
- Independent of prevalence
Accuracy
= number of correct results in all tests
= number of correct tests / total number of tests
= (TP + TN) / (TP + TN + FP + FN) = (TP + TN) / total
- Depends much on the proportion of diseased + nondiseased subjects in studied population
Not valuable for comparison of tests
Example: same test accuracy of 90% for two tests A and B
Positive Predictive Value
= positive test accuracy
= likelihood that a positive test result actually identifies presence of disease
= number of correct positive tests / number of positive tests
= TP / (TP + FP) = TP / T+ Test A: 90% accuracy
Test A: 90% accuracy
| GOLD STANDARD | |||||
|---|---|---|---|---|---|
| normal | abnormal | subtotal | |||
| T E S T | |||||
| normal | 90 | 10 | 100 | 90% | |
| abnormal | 10 | 90 | 100 | 90% | |
| subtotal | 100 | 100 | 200 | 50% | |
| 90% | 90% | 90% |
Test B: 90% accuracy
| GOLD STANDARD | |||||
|---|---|---|---|---|---|
| normal | abnormal | subtotal | |||
| T E S T | |||||
| normal | 170 | 20 | 190 | 89% | |
| abnorma | 0 | 10 | 10 | 100% | |
| subtotal | 170 | 30 | 200 | 15% | |
| 100% | 33% | 90% | |||
T+ row in decision matrix
- Dependent on prevalence
- PPV increases with increasing prevalence for given sensitivity + specificity
- PPV increases with increasing specificity for given prevalence
Negative Predictive Value
= negative test accuracy
= likelihood that a negative test result actually identifies absence of disease
= number of correct negative tests / number of negative tests
= TN / (TN + FN) = TN / T-
T- row in decision matrix
- Dependent on prevalence
- NPV increases with decreasing prevalence for given sensitivity + specificity
- NPV increases with increasing sensitivity for given prevalence
False-positive Ratio
= proportion of nondiseased patients with an abnormal test result
D- column in decision matrix
= FP / (FP + TN) = FP / D-
= 1 - specificity = (TN + FP - TN) / (TN + FP)
False-negative Ratio
= proportion of diseased patients with a normal test result
D+ column in decision matrix
= FN / (TP + FN) = FN / D+
= 1 - sensitivity = (TP + FN - TP) / (TP + FN)
Disease Prevalence
= proportion of diseased subjects to total population
= (TP + FN) / (TP + TN + FP + FN) = D+ / total
P.1127
Test C: prevalence of 10%, 90% sensitivity + 90% specificity
| GOLD STANDARD | |||||
|---|---|---|---|---|---|
| T E S T | |||||
| normal | abnormal | subtotal | |||
| normal | 162 | 2 | 164 | 99% | |
| abnormal | 18 | 18 | 36 | 50% | |
| subtotal | 180 | 20 | 200 | 10% | |
| 90% | 90% | 90% | |||
Test D: prevalence of 90%, 90% sensitivity + 90% specificity
| GOLD STANDARD | |||||
|---|---|---|---|---|---|
| T E S T | |||||
| normal | abnormal | subtotal | |||
| normal | 18 | 18 | 36 | 50% | |
| abnorma | 2 | 162 | 164 | 99% | |
| subtotal | 20 | 180 | 200 | 90% | |
| 90% | 90% | 90% | |||
- Sensitivity + specificity are independent of prevalence
Affects predictive values + accuracy of a test result
Example:
Test A, C, D: 90% sensitivity + 90% specificity
Bayes Theorem
= the predictive accuracy of any test outcome that is less than a perfect diagnostic test is in. uenced by
pretest likelihood of diseaseReceiver Operating Characteristics
criteria used to de.ne a test result for 3 Different Tests
Receiver Operating Characteristics (ROC)
= degree of discrimination between diseased + nondiseased patients using varying diagnostic criteria instead of a single value for the TP + TN fraction
= curvilinear graph gen er at ed by plotting TP ratio as a function of FP ratio for a number of different diagnostic criteria (ranging from de.nitely normal to definitely abnormal)
Y-axis: true-positive ratio = sensitivity
X-axis: false-positive ratio = 1 - specificity; reversing the values on the X-axis results in an identical sensitivity-specificity curve
Use: variations in diagnostic criteria are reported as a continuum of responses ranging from de. nitely abnormal to equivocal to de.nitely normal due to 0.2 subjectivity + bias of individual radiologist
- A minimum of 4-5 data points of diagnostic criteria are needed!
Difficulty: subjective evaluation of image features; subjective diagnostic interpretation; data must be ordinal (= Specificity discrete rating scale from definitely negative to definitely positive)
Interpretation:
- Increase in sensitivity leads to decrease in specificity!
- Increase in specificity leads to decrease in sensitivity!
- The most sensitive point is the point with the highest TP ratio
- equivalent to overreading by using less stringent diagnostic criteria (all findings read as abnormal)
- The most specific point is the point with the lowest FP ratio
- equivalent to underreading by using more strict diagnostic criteria (all findings read as normal)
- The ROC curve closest to the Y-axis represents the best diagnostic test
- Does not consider disease prevalence in the population
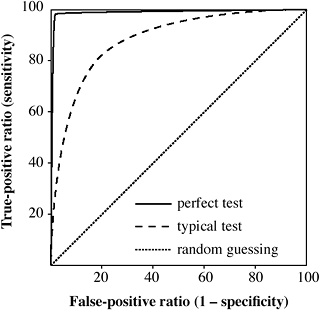 |
Receiver Operating Characteristics for 3 Different Tests |
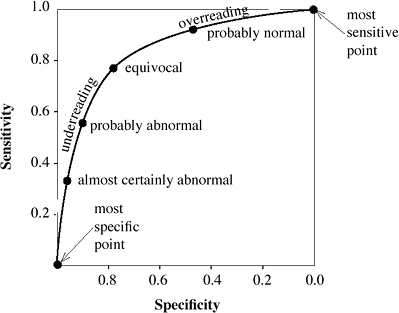 |
Interpretation of Receiver Operating Characteristics |
P.1128
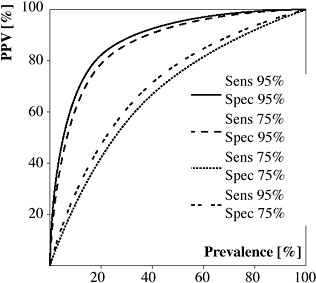 |
Receiver Operating Characteristics for Positive Predictive Value of Various Tests with Different Sensitivities and Specificities |
Confidence Limit
= degree of certainty that the proportion calculated from a sample of a particular size lies within a specific range (binomial theorem)
- Analogous to the mean 2 SD
Clinical Epidemiology
= application of epidemiologic principles + methods to problems encountered in clinical medicine with the purpose of developing + applying methods of clinical observation that will lead to valid clinical conclusions
Epidemiology = branch of medical science dealing with incidence, distribution, determinants in control of disease within a de. ned population
Screening Techniques
Principle question: can early detection in. uence the natural history of the disease in a positive manner?
Outcome measure: early detection + effective therapy should reduce morbidity + mortality, ie, increase survival rates (observational study)!
Biases:
Lead time = interval between disease detection at screening + the usual time of clinical manifestation; early diagnosis always appears to improve survival by at least this interval, even when treatment is ineffective
Length time = differences in growth rates of tumors:
slow-growing tumors exist for a long time before manifestation thus enhancing the opportunity for detection
fast-growing tumors exist for a short time before manifestation thus providing less opportunity for detection at screening interval cancers = clinically detected between scheduled screening exams are likely fast-growing tumors; patients with tumors detected by means of screening tests will have a better prognosis than those with interval cancers
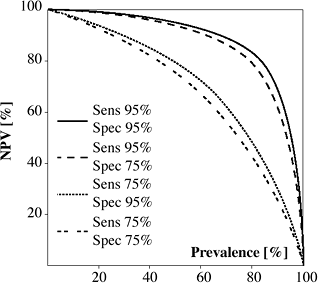
Receiver Operating Characteristics for Negative Predictive Value of Various Tests with Different Sensitivities and Specificities
Self-selection = decision to participate in screening program; usually made by patients better educated + more knowledgeable + more health-conscious; mortality rates from noncancerous causes can be expected to be lower than in general population
Overdiagnosis = detection of lesions of questionable malignancy, eg, in situ cancers, which might never have been diagnosed without screening + have an excellent prognosis
Randomized Trials
Design: two arms consisting of (a) study group and (b) control group with patients assigned to each arm on randomized basis
Endpoint: difference in mortality rates of both groups
Power: study must be of suf.cient size + duration to detect a difference, if one exists; analogous to sensitivity of a diagnostic test
Impact on effective size of groups:
Compliance = proportion of women allocated to screening arm of trial who undergo screening
Contamination = proportion of women allocated to control group of trial who do undergo screening
Case-control Studies
Retrospective inquiry, which is less expensive, takes less time, is easier to perform:
determine the number of women who died from breast cancer
chose same number of women of comparable age who have not died from breast cancer
ascertain the number of women who were screened + who were not screened in both arms
Calculation of odds ratio = ad / bc
Kappa (K)
measures concordance between test results and gold standard
- Analogous to Pearson correlation coef.cient (r) for continuous data!
P.1129
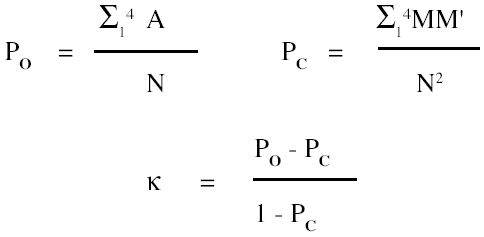
Example: = 0.743
Predictive value of :
| 0.00 - 0.20 | little or none |
| 0.20 - 0.40 | slight |
| 0.40 - 0.60 | group |
| 0.60 - 0.80 | some individual |
| 0.80 - 1.00 | individual |
Case-control Studies
| cases of deaths from breast cancer | controls not died from breast cancer | |
|---|---|---|
| screened | a | b |
| not screened | c | d |
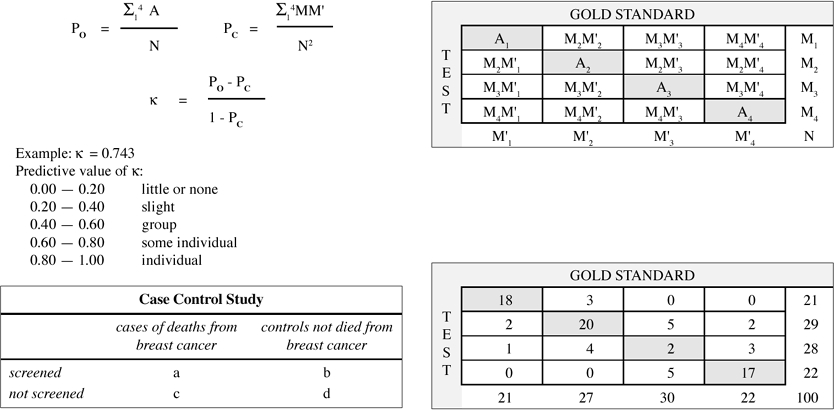 |
| GOLD STANDARD | |||||
|---|---|---|---|---|---|
| T E S T | |||||
| 18 | 3 | 0 | 0 | 21 | |
| 2 | 20 | 5 | 2 | 29 | |
| 1 | 4 | 2 | 3 | 28 | |
| 0 | 0 | 5 | 17 | 22 | |
| 21 | 27 | 30 | 22 | 100 | |
EAN: 2147483647
Pages: 24