Configuring Event Logs and Diagnostic Logging
Log files, although sometimes difficult and certainly tedious to read, are the best way to expose the kind of detailed information needed to resolve operational issues. There are two categories of logs:
-
Event logs These are the binary logs generated by Windows.
-
Generic log These log files are specific to the application or are part of the application.
Windows SharePoint Services and SharePoint Server use both types to log informational, warning, or error data. A very important and extremely useful new feature is the ability to select the type of events you would like to log.
Selecting the Type of Events to Log
-
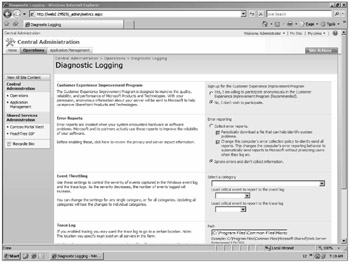
Browse to Diagnostic Logging by going to Central Administration > Operations > Diagnostic Logging, which is under Logging and Reporting. The options shown in Figure 15-5 allow you to configure event logging with an increased level of granularity.
-
The first option in the section deals with the Microsoft Customer Experience Improvement Program. Although the overhead of this feature is minimal, it still has an impact.
-
Next, you can choose to send your error reports automatically to Microsoft and their partners to help diagnose problems for future patches and service packs. If you choose to enable Error Reporting, you are given two options. The first option updates a file on the system to help diagnose problems. This is an automated version searching the Microsoft support site that brings possible solutions back without manual searches. The second option sends error reports to Microsoft without action required from an administrator.

Figure 15-5: These are the default settings for Diagnostic Logging.
Event Throttling
Event Throttling allows you to determine the kinds events that you want to log in the Windows Server 2003 Event Log. You have the ability to choose a category and select the Least Critical Type Of Event To Report To The Event Log and the Least Critical Type Of Event To Report To The Trace Log.
Configuring Event Logging
-
Start by choosing the category of event you want to log. For example, choose MS Search Indexing.
-
Select the minimum level of event to write to the Event Log. Be aware that the lower the level of the event, the more items will be written to the event log. As an example, choose Warning under Least Critical Event To Report To The Event Log. After you understand how this works, go back and change the level to a setting that correlates to your organization's monitoring policy.
-
Choose the level of the Trace Log. You should set the Least Critical Event To Report To The Trace Log to Critical. There is no requirement that either log has to be selected for any category. Always set your event throttling to limit events and then scale when problems are suspected in your installation.
-
Click OK. Unfortunately, you must click OK after every category and level combination. You cannot make all of your choices and then select OK.
Configuring Logging and Reporting
Because you must click OK after every event level for every category, you probably want to document and script the process. In addition to the problem of clicking OK on every setting, accidentally selecting the category All will overwrite your previous settings. The most reliable and expedient manner to configure your Logging and Reporting settings is via the command-line tool Stsadm.exe. If you have an existing farm, you can run the command:
stsadm.exe -o listlogginglevels (-showhidden is optional)
This command lists all of your logging categories and the current trace level and logging level. If you use the -showhidden parameter, the categories such as Gatherer-Backup trace/logging level and IndexerPlugin trace/logging level can be seen and documented. Using the command line to set your Logging and Reporting levels has several advantages, but the two most noteworthy are setting hidden values not seen in Central Administration and creating a batch file that is easily redeployed. The following script is an example of setting the E-Mail Trace Log to Unexpected and the Event Log to Error:
stsadm.exe -o setlogginglevel -category e-mail -tracelevel unexpected -windowslogginglevel error
Note that -windowslogginglevel refers to the Windows Server 2003 Event Log. If the category has spaces in the name, such as Forms Services Administration, then you must surround the service with quotation marks, like "Forms Services Administration." For example:
stsadm.exe -o setlogginglevel -category "Forms Services Administration" -tracelevel unexpected -windowslogginglevel error
To configure all or part of the categories' event and trace logs, simply write a batch file to complete all of the settings. Although you can set the trace and event log settings simultaneously by using a semicolon between categories, it is generally better to put each command on a separate line. However, if you must set multiple categories simultaneously, follow this example that sets E-mail and Forms Services Administration in the same command:
stsadm.exe -o setlogginglevel -category e-mail;"Forms Services Administration" -tracelevel unexpected -windowslogginglevel error
Note that you must set all simultaneous categories to the same trace level and event log level.
| Caution | Choosing a low event value or the category All causes a very high number of items to be written to the Event Log. It is possible to completely fill a drive with superfluous Event Logs. In addition, it is possible to run the CPU usage to 100%. If a system is slowing beyond usefulness, check to see if Owstimer.exe is using the majority of the CPU. If it is, check any timer events, such as logging or backups, and delete or disable the timer job definition. You may re-enable the timer job when the problem is resolved. |
Trace Logs
The Trace Log section allows you to determine details for the Trace Logs. It first allows you to specify a location for the Trace Log, which by default is C:\Program Files\Common Files\Microsoft Shared\Web Server Extensions\12\LOGS\. Be careful with how many logs you choose and how long the system will write to that log. To help better manage your logs, consider changing the default location of the Trace Logs to the same parent directory as your IIS logs. This has the combined effect of relieving some of the workload on the system drive and helping maintain its organization. You also have the option of moving your existing log files. To ensure log integrity, disable Trace Logs before you move the existing files. If you have chosen a level of tracing that produces more logs, such as Verbose, it is important to set these limits. The default for Number Of Log Files is 96, and the Number of Minutes To Use A Log File is 30. The default numbers are good for a normal to critical level of logging, but not if the level is set to Unexpected or Monitorable. The numbers here are multiplied to find out how much data you are keeping. The default is 2 days (96 files × 30 minutes = 2,880 minutes).
There are cases in which one or more categories need an extended amount of time for Trace Logs.
Using Trace Logs also helps you resolve issues with configuration changes to your SharePoint environment. At times these logs can help resolve serious system issues. It recommended that you save these log files each time you make configuration changes to your test and production environments. These logs can be used to understand what changes were made and the impact of those changes, which is not always directly apparent.
Site Collection Auditing
Auditing specific actions for every document is critical to many different industries. Administrators now have the ability to audit items at the site collection level. Actions, such as opening, downloading, deleting, and moving, can be tracked throughout an item's entire life cycle. To audit events related to your site collection, follow these steps:
-
After you have reached the site, click on Site Actions > Site Settings.
-
Under Site Collection Administration, click Configure Audit Settings.
-
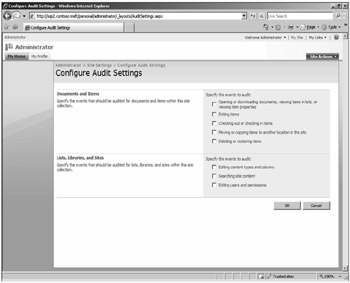
The Documents And Items section, as seen in Figure 15-6, controls auditing items and documents for the site collection. In addition to auditing changes to documents, you may also audit the opening of documents. This works much like a Web page hit counter by letting you know how many times documents have been read.
-
In the Lists, Libraries, And Sites section, you can choose to audit such actions as editing content types and columns, searching site content, and editing users and permissions.

Figure 15-6: You can specify which events to audit for documents and items, as well as lists, libraries, and sites.
By default, auditing log reports is not turned on. To enable the auditing of reports, do the following:
-
Go to Site Actions > Site Settings > Site Collection Features.
-
Click the Activate button in the Reporting Row.
-
Go back to Site Settings and under Site Collection Administration there is a link to Audit Log Reports. You can view standard reports or create your own custom reports.
If you do not wish to audit an entire site collection, you can define the Information Management Policies for a single Content Type. Refer to Chapter 6, "Using Workflows and Information Management Policies," for more information on configuring Content Type auditing.
EAN: 2147483647
Pages: 110