Implementing a Value System
| There remained the problem of designing some system that would permit the user to assign numeric values to the components of the simulation while preventing psychotic behavior in the system. It's one thing to design a balanced system of equations when the coefficients are all stable but preserving balance when the user can change the coefficients seemed beyond the realm of possibility. An even more serious implementation problem loomed beyond this one: How was I to design a system of equations that would be accessible to the average user? I had handled games with complex internal systems of equations, but a system that the average user could handle? That seemed completely out of the question. The design problem clearly called for linear equations of this form:
There might also be a need for additive equations of this form:
Such equations permitted the user to adjust the single coefficient to increase or decrease the severity of the phenomenon. The interesting design problem here is, how did I decide which variables to include and which to reject? A variety of factors affected my decision. Obviously, I needed some form of point system reflecting what might constitute success or failure; this required variables for various forms of points. I also needed to include obvious factors such as nuclear power, coal power, and various forms of pollution. Ultimately, however, the choice of variables to include rested on my familiarity with the issues underlying environmental problems. There was no cookbook method that I can offer you; I simply had to apply my judgment based on my expertise. As it happens, I spent several years working on environmental policy issues during the 1970s, so I required little more than a few books' worth of reading to bring my expertise up to date. Had I lacked such expertise, I would have been reluctant to attempt the design.
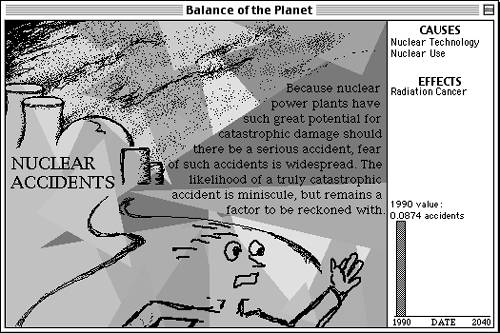
Few game topics are closely tied to reality; by placing games in a fantasy environment, designers seldom need to worry about the constraints of reality. There are plenty of exceptions, of course, flight simulators being the most obvious. As the industry advances, game designers will be required to integrate more real-world knowledge into their work. This will in turn make it ever more important that designers bring some real-world expertise into their work. Content experts are invaluable, but they're not enough; the knowledge they offer must be integrated into the overall design, and that integration process can take place only inside the designer's mind. Thus, content experts must be treated as teachers, not direct contributors. I created the following list of 154 variables for my simulation: AcidRain AveEnergyPrice BasicResearch BeefProduction BeefTax BiodiversityPoints BioResearch Biotechnology BirthRate CarbonDioxide CFCProduction CFCTax CoalPrice CoalResearch CoalSupply CoalTax CoalTechnology CoalUse ComputerGamesPts ConsumerGoods Crops CropStrains CropTechnology CropYields Dam DamPrice DamUse DeathPoints DebtForNature Desertification DrinkingWater EnergyConservation EnergyDemand FallPoints FallsFromRoofs FamilyPlanning FarmLand FertilizerTax FertilizerUse FloodDeathPoints FloodDeaths FoodSupply ForestClearing ForestHabitats ForestLand ForestLifePoints FuelwoodUse Garbage GlobalGenePool GlobalTemperature Grasslands GrossGlobalProduct GroundwaterSupply GroundwaterUse HeavyMetalDeaths HeavyMetalPoints HeavyMetalPrice HeavyMetalSupply HeavyMetalTax HeavyMetalUse Housing IndustrialInput IndustrialOutput InundationPoints LakeAcidity LakeHabitats LakeLifePoints LandAbuse LandAbusePoints LifePoints Logging LoggingTax LungDiseaseDeaths LungDiseasePts MarineLife MarineLifePoints MaterialsDemand Medicines Methane NaturalGasPrice NaturalGasSupply NaturalGasTax NaturalGasUse NetEnergy NitrousDioxide NonrenewEnergy NorthernLifestyle NuclearAccidents NuclearPrice NuclearResearch NuclearSupply NuclearTax NuclearTechnology NuclearUse OilPrice OilResearch OilSpills OilSupply OilTax OilTechnology OilUse Overgrazing Ozone PesticideDeathPts PesticideDeaths PesticideTax PesticideUse Phytoplankton Population Price PropertyDamage QualityOfLife QualityPoints Radiation RadiationCancer RadiationPoints RadWaste RadWastePoints RecycledAluminum RecycledPaper RecyclingCenter RenewableEnergy ReservoirCapacity RiparianHabitats SeaLevel SeaFood SkinCancerDeaths SkinCancerPoints SoilErosion SolarEnergy SolarEnergyPrice SolarEnergyUse SolarResearch SolarTechnology SouthernLifestyle Starvation StarvationPoints StratosphericCFC StripMining Subsidy SulfurDioxide Sustainability SustainabilityPts Tax Total TotalCoalUse TotalNatGasUse TotalNuclearUse TotalOilUse TotHeavyMetUse TroposphericCFCs UV WaterPollution WaterSupply WoodStove It's a long list, isn't it? You can see why I was so worried about the simulation getting out of control. My next task was to set up a huge dependencies chart showing with simple lines and arrows what other variables were affected by each variable. This chart covered quite a few pages; it took me a while to find clean breaks in the chart so that it could cover many pages without too many arrows departing from each page. Once I had that chart, the only task was to write out one equation for each arrow. Here's an example: One of my variables was Nuclear Accidents. This was presented to the user with the display shown in Figure 25.1. 25.1. Nuclear accidents.
Note that there are two causal factors in this display: Nuclear Technology and Nuclear Use. The former represents the results of subsidized research that, presumably, lessens the dangers presented by these plants. The latter represents the actual number of nuclear power plants in existence. The formula display for this variable, accessible to the user, looks like what appears in Figure 25.2. 25.2. Nuclear accidents formula.
Note how clearly this presents the formula used in the simulation and the three values that go into the formula. It also explains how the formula works. One of the secrets behind the functioning of this game lies in that scroll bar. I pre-programmed it with upper and lower limits that ensured that the simulation would remain within reasonable bounds. In other words, the user was free to alter the values, but only within limits that I felt were reasonable. This restriction was crucial to keeping the entire simulation balanced. In practice, we found that there were four ways of playing the simulation. The first was simply surfing the web of causality. With 156 different screens linked together, many people were happy just to browse through all the connections. This in itself made an important point about how deeply intertwined environmental and economic issues are. Once users had satisfied their immediate curiosity, they settled down to playing the game, using the coefficients that I had built into the game.
|
EAN: 2147483647
Pages: 248