Analyzing a Crash Dump
When a crash occurs, Windows 2000 can save the state of the system in a dump file. To enable this feature, the System Control Panel applet (Advanced tab, Startup and Recovery) must be configured. Crash dumps allow an immediate reboot of the system without losing the state of memory at the moment of failure. This section explains how to analyze a system crash dump. Goals of the AnalysisWith WinDbg and a crash dump file, the state of the failed system can be examined. It is possible to find out almost as much information as if it were still running or if a live debugger were attached at the moment of failure. This kind of forensic pathology can help develop a convincing explanation of what led to the crash. Some of the questions that should be asked during the analysis include
Starting the AnalysisTo begin the analysis, the crash dump file must be obtained. If WinDbg is available on the target system (the system that crashed), the file is present wherever the Control Panel configuration specified (e.g., WINNT\Memory.DMP). If the system that crashed is at a remote site, the dump file must be transported. Since dump file sizes range from large to very large, be sure to use appropriate techniques for transport (e.g., compression and/or CD-R media). On the analyzing machine, invoke WinDbg. Then choose the menu option File and select Open Crash Dump. Choose the dump file name to open. After the dump file loads, information is displayed as shown in the following excerpt: Kernel Debugger connection established for D:\WINNT\MEMORY.DMP Kernel Version 2195 Free loaded @ ffffffff80400000 Bugcheck 0000001e : c0000005 f17a123f 00000000 00000000 Stopped at an unexpected exception: code=80000003 addr=8045249c Hard coded breakpoint hit ... Module Load: CRASHER.SYS (symbol loading deferred) The initial information reveals the same STOP message information from the original blue screen. The bugcheck code is 0x1E, signifying KMODE_EXCEPTION_NOT_HANDLED. The second bugcheck argument is the address where the problem occurred (0xF17A123F). To see where this instruction falls within the source code, choose Edit, then Goto Address and enter the address from the bugcheck information. If symbol information is located (don't forget to set the symbol path from the Options dialog of the View menu), the source file is opened. For this example, a function that purposefully generates an unhandled exception, TryToCrash, is displayed with the cursor placed on the line of code that was executing. The screen shot of Figure 17.2 displays this remarkably helpful feature. Figure 17.2. Crash dump analysis screen shot.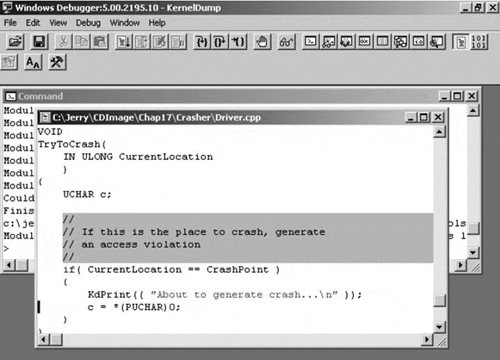 The first parameter for bugcheck 0x1E is the unhandled exception code, 0xC0000005. This signifies an access violation, which is not surprising given the code of TryToCrash. Dereferencing a NULL pointer is never a great idea. Do not be misled by the message about the unexpected exception with code 0x80000003. This is just the breakpoint used by KeBugCheck itself to halt the system, so it has no significance. Tracing the StackThe stack trace is one of the most important steps in analyzing a crash dump. The stack state at the time of the crash is a record of the calls made from the oldest frame (at the stack bottom) to the crash point itself (at the top). Unfortunately, finding the right stack to trace is often quite involved. This is due to the fact that systems operate with many threads, each with their own context (which includes a private stack). At the time of an unhandled exception (as in the example), control is transferred to a system routine that switches to a safe context. (After all, the unhandled exception could have been caused by a corrupt stack. Further processing within that context would be unsafe.) The Windows 2000 kernel routine that performs the unhandled exception processing for most driver operations is PspUnhandledExceptionInSystemThread. HIGH IRQL CRASHESIf the system crashed while it was running at or above DISPATCH_LEVEL IRQL, a straightforward stack trace is in order. To obtain a stack trace from a crash dump under analysis by WinDbg, the Call Stack option can be selected from the View menu, or the k command can be used directly. To continue the example, the following is displayed: > k f79a6678 8045251c f79a66a0 8045cc77 f79a66a8 NTOSKRNL!PspUnhandledExceptionInSystemThread+0x18 f79a6ddc 80465b62 80418ada 80000001 00000000 NTOSKRNL!Psp- SystemThreadStartup+0x7a (EBP) 00000000 00000000 00000000 00000000 00000000 NTOSKRNL!KiThreadStartup+0x16 (No FPO) > Each line shows the address of the stack frame, the return address of the function, and the first three arguments passed to the function. (The kb stack backtrace command can be used instead of k to better format the display.) CRASHES BELOW DISPATCH_LEVELAs demonstrated, the function PspUnhandledExceptionInSystemThread indeed was called to handle the NULL pointer dereference, but there is no obvious linkage back to the faulty driver code itself. The first input parameter to PspUnhandledExceptionInSystemThread is a pointer to a structure that contains the exception and context records. The !exr and !cxr extension commands can be used to format and display these vital records. After the !cxr command executes, the very useful !kb command displays a stack trace using the context of the last !cxr command. This should be the call stack that was in context at the time of the unhandled exception. > dd f79a66a0 l 2 ; this is a lowecase L, not a 1 0xF79A66A0 f79a6b28 f79a6780 > !exr f79a6b28 Exception Record @ F79A6B28: ExceptionAddress: f17a123f (TryToCrash+0xf) ExceptionCode: c0000005 ExceptionFlags: 00000000 NumberParameters: 2 Parameter[0]: 00000000 Parameter[1]: 00000000 > !cxr f79a6780 CtxFlags: 00010017 eax=00000001 ebx=00000000 ecx=01000100 edx=f79a6dcc esi=e1eba118 edi=fcdb8c38 eip=f17a123f esp=f79a6bf0 ebp=f79a6bf4 iopl=0 nv up ei pl zr na po nc vip=0 vif=0 cs=0008 ss=0010 ds=0023 es=0023 fs=0030 gs=0000 efl=00210246 0000123F > !kb Chi=00210246 0000123F > !kb Chi=00210246 0000123F > !kb ChildEBP RetAddr Args to Child f79a6bf4 f17a11b5 00000001 00000000 7cdb3738 CRASHER!TryToCrash+0xf f79a6c78 f17a102e fcdb3750 00000000 804a43c4 CRASHER!CreateDevice+0x162 f79a6c90 804a4431 fcdb3750 fcd67000 f79f2d08 CRASHER!DriverEntry+0x2e f79a6d58 804d9281 0000035c fcd67000 f79f2d08 NTOSKRNL!_NtSetInformationFile@20+0x5a0 f79a6d78 80418b9f f79f2d08 00000000 00000000 NTOSKRNL!_NtSetInformationFile@20+0x7e1 f79f2d58 80461691 00f1f784 00000000 00000000 NTOSKRNL!_ExpWorkerThread@4+0xae f79f2d58 77f9a31a 00f1f784 00000000 00000000 NTOSKRNL!_KiSystemService+0xc4 f79a6bec 01000100 f79a6c78 f17a11b5 00000001 +0xffffffff 00f1f794 00000000 00000000 00000000 00000000 +0xffffffff Indirect Methods of InvestigationIf a driver was not the direct cause of the crash, it still cannot be ruled out as an indirect cause. Perhaps a device DMA operation scribbled into memory. To analyze such situations, considerable information must be gathered. This can involve creativity and imagination (a.k.a. snooping and patience). FINDING I/O REQUESTSA good starting point is to identify any IRPs that the driver was processing at the time of the crash. Begin by obtaining a list of the active IRPs on the entire system with the !irpfind command. > !irpfind Searching NonPaged pool (8090c000 : 8131e000) for Tag: Irp 8097c008 Thread 8094d900 current stack belongs to \Driver\Crasher 8097dec8 Thread 8094dda0 current stack belongs to \FileSystem\Ntfs 809861a8 Thread 8094dda0 current stack belongs to \Driver\symc810 809864e8 Thread 80951ba0 current stack belongs to \Driver\Mouclass 80986608 Thread 80951ba0 current stack belongs to \Driver\Kbdclass 80986728 Thread 8094dda0 current stack belongs to \Driver\symc810 From this list, select the IRP belonging to the driver under test. Then the !irp command is used to format the specific IRP. > !irp 8097c008 Irp is active with 1 stacks 1 is current No Mdl System buffer = ff593d88 Thread 80987da0: Irp stack trace. cmd flg cl Device File Completion-Context > 4 0 1 809d50d0 00000000 00000000-00000000 pending \Driver\Crasher Args: 0000000C 00000000 00000000 00000000 The cmd field shows the major function, and the Args field displays the Parameters union of the I/O stack location. The flg and cl fields show the stack location flags and control bits, defined in NTSTATUS.H. For this example, the IRP major function code is 4, signifying IRP_MJ_WRITE, with a Parameters.Write.Length of 12 (0xC). Further, no completion routine is associated with the IRP and it has been marked pending at the time of the crash. There is a system buffer associated with the IRP (at location 0xFF593D88), which can be examined with the dd command or the Memory option in the View menu. This device is performing buffered I/O. To examine the Device object the IRP was sent to, use the !devobj command on the address specified by the IRP. > !devobj 809d50d0 Device object is for: Crash0 \Driver\Crasher DriverObject ff53e1d0 Current Irp 8097c008 RefCount 1 Type 00000022 DevExt ff58bc58 DeviceQueue: The Device Extension can also be dumped using the dd command. Later in this chapter, a WinDbg extension that makes the Device Extension easier to display is demonstrated. Of course, the IRP may not yield as much information as the stack trace, but it does reveal some possibly relevant information. For example, the IRP reveals that the driver was performing buffered I/O and that the request was passed to the Start I/O routine, since it was marked as pending. Detective work does not always yield a quick path to the truth. EXAMINING PROCESSESSometimes, it is helpful to know what processes were running on a system at the time of a crash. This can help spot patterns of system usage or even specific user programs that trigger a driver to fail. For general information, the !process command is used. > !process 0 0 **** NT ACTIVE PROCESS DUMP **** PROCESS 80a02a60 Cid: 0002 Peb: 00000000 ParentCid: 0000 DirBase: 00006e05 ObjectTable: 80a03788 TableSize: 150. Image: System PROCESS 80986f40 Cid: 0012 Peb: 7ffde000 ParentCid: 0002 DirBase: 000bd605 ObjectTable: 8098fce8 TableSize: 38. Image: smss.exe PROCESS 80958020 Cid: 001a Peb: 7ffde000 ParentCid: 0012 DirBase: 0008b205 ObjectTable: 809782a8 TableSize: 150. Image: csrss.exe PROCESS 80955040 Cid: 0020 Peb: 7ffde000 ParentCid: 0012 DirBase: 00112005 ObjectTable: 80955ce8 TableSize: 54. Image: winlogon.exe PROCESS 8094fce0 Cid: 0026 Peb: 7ffde000 ParentCid: 0020 DirBase: 00055005 ObjectTable: 80950cc8 TableSize: 222. Image: services.exe PROCESS 8094c020 Cid: 0029 Peb: 7ffde000 ParentCid: 0020 DirBase: 000c4605 ObjectTable: 80990fe8 TableSize: 110. Image: lsass.exe PROCESS 809258e0 Cid: 0044 Peb: 7ffde000 ParentCid: 0026 DirBase: 001e5405 ObjectTable: 80925c68 TableSize: 70. Image: SPOOLSS.EXE For more information, the CID number of a specific process can be used to increase the level of verbosity. > !process 0 7 **** NT ACTIVE PROCESS DUMP **** PROCESS fb667a00 Cid: 0002 Peb: 00000000 ParentCid: 0000 DirBase: 00030000 ObjectTable: e1000f88 TableSize: 112. Image: System VadRoot fb666388 Clone 0 Private 4. Modified 9850. Locked 0. FB667BBC MutantState Signalled OwningThread 0 Token e10008f0 ElapsedTime 15:06:36.0338 UserTime 0:00:00.0000 KernelTime 0:00:54.0818 QuotaPoolUsage[PagedPool] 1480 Working Set Sizes (now,min,max) (3, 50, 345) PeakWorkingSetSize 118 VirtualSize 1 Mb PeakVirtualSize 1 Mb PageFaultCount 992 MemoryPriority BACKGROUND BasePriority 8 CommitCharge 8 THREAD fb667780 Cid 2.1 Teb: 00000000 Win32Thread: 80144900 WAIT: (WrFreePage) KernelMode Non-Alertable 80144fc0 SynchronizationEvent Not impersonating Owning Process fb667a00 WaitTime (seconds) 32278 Context Switch Count 787 UserTime 0:00:00.0000 KernelTime 0:00:21.0821 Start Address Phase1Initialization (0x801aab44) Initial Sp fb26f000 Current Sp fb26ed00 Priority 0 BasePriority 0 PriorityDecrement 0 DecrementCount 0 ChildEBP RetAddr Args to Child fb26ed18 80118efc c0502000 804044b0 00000000 KiSwapThread+0xb5 fb26ed3c 801289d9 80144fc0 00000008 00000000 KeWaitForSingleObject+0x1c2 For multithreaded processes, this form of the !process command lists thread information, including objects on which they might be waiting. It also provides information about the I/O requests issued by a given thread, which may help in resolving deadlock conditions.
|
EAN: 2147483647
Pages: 156