Interactive Debugging
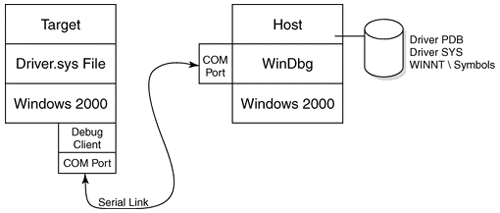
 [oR] [oR] Post mortem analysis is a necessary skill, but many driver problems are easier to diagnose while the driver is actively running. This section briefly describes how to debug driver code interactively. Starting and Stopping a Debug SessionWinDbg is the primary tool for interactive debugging. To use it, two machines are needed: the target (machine under test) and the host (development machine running WinDbg). Appendix A describes the basics of making the connection between machines, but essentially a serial link is used to control and monitor activity on the target. Figure 17.3 shows the positioning of the host and target machines and files. Figure 17.3. Interactive debugging using WinDbg. The first secret to successful interactive debugging is to ensure that the necessary files are installed on the proper machines. The steps are outlined below.
The host is now in complete control of the target. The interactive version of a WinDbg session is a superset of the post mortem mode of crash dump analysis. Breakpoints can be established, even on top of code that has yet to be loaded into kernel memory. To disconnect a debug session, perform the following steps:
The target may still run sluggishly for a time after disconnecting from the host, but should recover shortly. This may be due to the fact that KdPrint and DbgPrint routines no longer have a connected debugger to which they can send output. Setting BreakpointsSetting breakpoints in live code is often the most attractive way to chase bugs in drivers. The technique is actually overblown in that stopping the system for a breakpoint is a remarkably invasive action. Frequently, intermediate or trace output judiciously placed in driver code yields superior results. However, there is comfort in the knowledge that this incredibly fast system has completely paused while the slow human takes time to sort things out and poke around. To set a breakpoint with WinDbg, perform the following:
To remove a breakpoint, pause the target, select the source code line, and click on the breakpoint button. The Edit, Breakpoints menu item allows the removal of multiple breakpoints. Setting Hard BreakpointsGiven WinDbg's interactive capabilities, there are not many reasons for putting hard breakpoints into driver code. When the need arises, the following two calls can be used: VOID DbgBreakPoint(); VOID KdBreakPoint(); KdBreakPoint is just a macro that wraps a conditional compilation directive around a call to DbgBreakPoint. The macro generates no call if the driver is built for release (free build). Beware: Windows 2000 crashes with a KMODE_EXCEPTION_NOT_HANDLED STOP message if a driver encounters a hard-coded breakpoint and the kernel's debug client is not enabled. If a driver hits a breakpoint and there is no debugger connected to the serial line, the target hangs. Sometimes, this situation can be rectified by launching WinDbg on the host, after the fact. Intermediate OutputDebugging code by sprinkling printf statements throughout has a long and honored tradition. The technique is sometimes called generating intermediate output. In fact, there is probably no bug that cannot be found by sufficient and proper use of intermediate output. The technique lacks the glamour of breakpoint debugging, but is often better suited for chasing timing-sensitive bugs. The two routines to generate trace messages DbgPrint and KdPrint are described in Table 17.2. Both send a formatted string generated on the target to WinDbg on the host.
Since KdPrint is actually a macro (defined in NTDDK.H), an extra set of parentheses is required in order to pass a variable-length list of arguments. The KdPrint macro becomes a no-op in retail (free) builds of a driver.
|
EAN: 2147483647
Pages: 156