| You can use a wizard to quickly create a report that is bound to the information in one table or in several related tables. However, reports often include multiple sets of information that are related to the topic of the report, but not necessarily related to each other. A report might, for example, include charts, spreadsheets, and other forms of information about several divisions or activities of a company. Or it might include information about production, marketing, sales, compensation, and the company's pension plan. All these topics are related to running the business, but they don't all fit nicely into the structure of an individual Access report. One solution to this problem is to create separate reports and store them together, for example by printing them and placing them in a binder or by saving them in electronic format in a folder or on an intranet site. An easier and more graceful solution is to use subreports. A subreport is a report inserted within another report (usually with others). You create a subreport as you would any other report, and then use a wizard either to insert it in a main report or to insert a subreport control in the main report. In either case, both the main report and the subreport appear as objects in the Reports pane of the database window. You might frequently use queries as the basis for reports that require summary calculations or statistics. But you can also enhance the usefulness of both regular reports and subreports by performing calculations in the reports themselves. By inserting unbound controls and then using the Expression Builder to create the expressions that tell Access what to calculate and how, you can make information readily available in one place instead of several. Tip After establishing the correct relationships, you can quickly insert an existing report as a subreport of another by opening the main report in Design view and then dragging the second report from the Reports pane to the section of the main report where you want to insert it as a subreport.
In this exercise, you will select a record source for a calculated query, and then add a subreport displaying calculated totals to a main report. USE the 05_AddSubreport database. This practice file is located in the Chapter08 subfolder under SBS_Access2007. OPEN the 05_AddSubreport database. Display the Sales By Category report in Design view, and then display the Property Sheet pane.
Troubleshooting The database created for this exercise contains additional queries; do not continue with the database from a previous exercise.
1. | If the Report Selector in the upper-left corner of the report does not display a black dot to indicate that the report is selected, click it.
| 2. | On the Data tab of the Property Sheet pane, click the Record Source arrow, and in the list, click Sales by Category. Then close the Property Sheet pane,
| 3. | On the Design contextual tab, in the Controls group, click the Subform/Subreport button, and then click a point about two gridlines below the left edge of the Product label.
Subform/Subreport  Access opens a blank, unbound subreport in the main report and then the SubReport wizard starts.
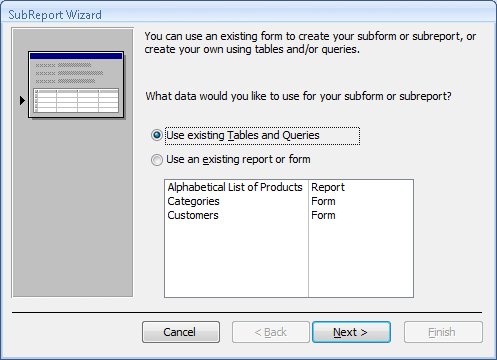 | 4. | With the Use existing Tables and Queries option selected, click Next.
| 5. | In the Tables/Queries list, click Query: Sales by Category.
| 6. | In the Available Fields list, double-click CategoryID, ProductName, and ProductSales to move them to the Selected Fields list, and then click Next.
| 7. | With the Choose from a list option and Show Sales by Category for each record in Sales by Category using CategoryID selected, click Next.
| 8. | Click Finish to create a subreport with the suggested name, Sales by Category subreport.
The Sales By Category subreport takes the place of the unbound subreport in the main report.
| 9. | If the entire subreport isn't selected, click its top edge to select it. If the Property Sheet pane does not open automatically, press  . .
| 10. | On the Format tab, set the Width property to 6.6" and the Height property to 1.5". Then press  . .
 | 11. | In the subreport, click an empty section of the Report Header grid, then press  to select all the controls. to select all the controls.
| 12. | On the Arrange tab, in the Control Layout group, click the Remove button.
 Removing the Stacked layout allows you to delete the Report Header without deleting the controls in the Detail section.
| 13. | In the subreport, right-click the Report Header section header, and then click Report Header/Footer to delete the existing header and footer sections. In the Microsoft Office Access message box warning you that any controls in the sections will be deleted, click Yes.
| 14. | In the subreport, right-click the Page Header section header, and then click Page Header/Footer to delete the corresponding header and footer sections.
The subreport now consists of only a Detail section.
 | 15. | In the Detail section, click the CategoryID text box, and then press the  key. key.
| 16. | Click the ProductName text box, and in the Property Sheet pane, change its Width property to 2.125".
| 17. | Click the ProductSales text box, and in the Property Sheet pane, change its Left property to 2.3" and its Width property to 1".
The labels overlap.
| 18. | In the main report, delete the partially hidden Sales by Category subreport label.
Tip If you accidentally delete a control, press Ctrl+Z or click the Undo button to undo the deletion.  | 19. | Right-click in the grid below the subreport Detail section header, and then click Report Header/Footer to display those sections.
| 20. | Scroll the subreport to display the Report Footer section. (You might have to adjust the report window to see the scrollbar.) In the Controls group, click the Text Box button, and then click in the center of the Report Footer section.
Text Box  Access inserts an unbound control and its label. You will use this control to perform the calculation.
| 21. | Click the label of the unbound control, and then in the Property Sheet pane, set the following properties:
Property | Setting |
|---|
Caption | Total: | Font Name | Arial | Font Size | 9 | Font Weight | Bold |
| 22. | Click the unbound text box control, and then in the Property Sheet pane, on the Data tab, click the ellipsis button in the Control Source property to start the Expression Builder.
Ellipsis  Troubleshooting If you haven't previously used the Expression Builder, Office might install it at this time. The installation process might require you to insert the Office installation CD. | 23. | In the first column, double-click Functions, and then click Built-In Functions.
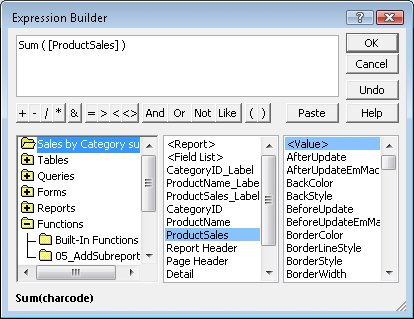
| 24. | In the third column, double-click Sum.
Access displays Sum (<<expr>>) in the expression box.
| 25. | Click <<expr>>. Then click Sales by Category subreport in the first column, and double-click ProductSales in the second column.
 | 26. | Click OK to close the Expression Builder, and then press to enter the calculation in the unbound text box in the Property Sheet pane.
| 27. | Set the font properties for the unbound text box as you did in Step 21.
| 28. | In the Property Sheet pane, on the Format tab, click the Format arrow, click Currency, and then press .
Access will now display the results of the calculation as currency.
| 29. | Set the Left and Width properties of the calculated control and its label to match the two controls in the Detail section.
| 30. | Save your changes. Then on the View toolbar, click the Print Preview button to display the results of your work.
Print Preview   | 31. | On the View toolbar, click the Design View button to switch views.
Tip Several factors affect the layout of the subreport in the main report when it is displayed in Print Preview. The width of the subreport sets the width of the space available for the display of text. The height of the subreport sets the minimum height of the area where product information is displayed (because the Can Shrink property for the subreport is set to No). The maximum height of the product display area is the length of the list (because the Can Grow property is set to Yes) plus the space between the bottom of the subreport and the bottom of the Detail section. | 32. | Click the subreport to select it. In the Property Sheet pane, on the Format tab, change the Border Style property to Transparent.
| 33. | Save your changes, and then preview the report.
|
CLOSE the Sales By Category report and the 05_AddSubreport database.
|