Interfacing to ADDM
Interfacing to ADDMYou can interface to the ADDM using either the Oracle Enterprise Monitor (OEM) or the advisor APIs described in this section. First, you will look at how you can use OEM Database Control to get to ADDM. For the purpose of generating load on the database, we used a variation of the example in previous chapters. This is based on the HR Demo schema, and the code can be seen in the various listings in this chapter. Using OEM for ADDMADDM can be accessed from OEM in a variety of ways:
Figure 12.1 shows the Advisor Central screen. This is the launching point for most of the advisors. The last ADDM task is always displayed. You can use the Search facility to obtain previous ADDM tasks based on a time period under Advisor Runs or use the search to specify a required name. You can also click the ADDM link in the top of the page to create a new ADDM task. Figure 12.1. Advisor Central page: Launch point for all advisors.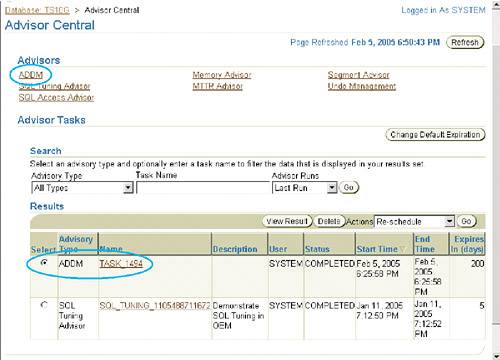 This now displays the ADDM main page with camera icons denoting currently available snapshots and ADDM reports as well as a graph showing the number of sessions waiting, performing I/O, and so on. This will enable you to quickly identify a period of interest. You can also use the arrow keys to move back and forth to the correct period. Hovering the cursor over any of the camera icons will display the actual snapshot time period. You can now select the starting and ending snapshot using these icons, which will create an ADDM task that is automatically named and results in producing an ADDM report that lists the findings. Alternatively, you can choose the currently listed ADDM snapshot. In both cases, OEM will display a screen similar to that shown in Figures 12.2 and 12.3. (This screen is shown in two figures because there is a wealth of information displayed, which you must scroll down to access.) Figure 12.2. Top half of the ADDM Main page, showing database activity, recent snapshots, and the ADDM task name.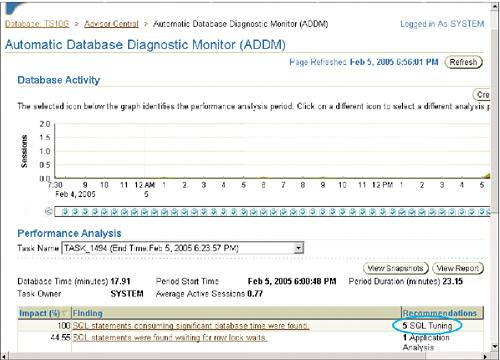 Figure 12.3. Bottom half of the ADDM Main page, showing the findings and recommendations.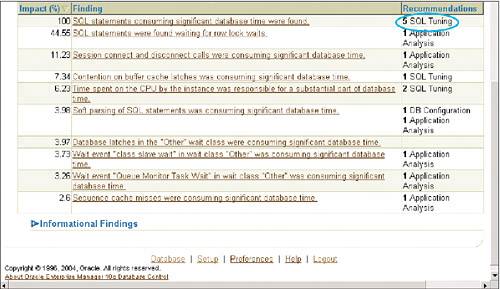 The findings shown in Figure 12.3 are the heart of the matter, and are discussed in detail in the next section. First, however, you need to look at the various drill-downs available in this screen. Notice that each finding, which is actually text with links, has an impact denoted as a percentage. For example, clicking the link for the statement "SQL statements consuming significant database time were found" opens the Performance Finding Details screen, shown in Figure 12.4. Figure 12.4. The Performance Finding Details screen for the first finding.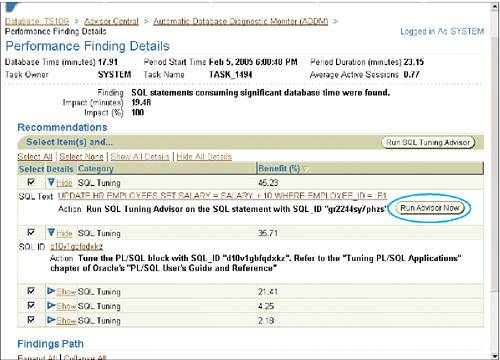 If applicable, the ability to link to an advisor also appears. As well, each finding has a benefit percentage attached to it. This denotes the expected benefit that could be obtained by tuning this SQL. In this particular case, because you clicked on a finding involving SQL, the Run SQL Tuning Advisor button is shown. Notice also that there were five findings for the SQL statements, as seen in the Recommendation column, which shows the text "5 SQL Tuning" for this finding. Thus, you will notice that the details of five separate SQL statements are shown in this screen. You will also notice that further drill-down is enabled for each of SQL statement, and you can choose to hide or display these details. If the link is clicked, these details will be shown in a separate drill-down screen. Short SQLs will be shown where possible; for larger PL/SQL blocks, the link is shown with the SQL ID as the text. Clicking on this link will take you to the screen shown in Figure 12.5. Figure 12.5. SQL details for the PL/SQL block.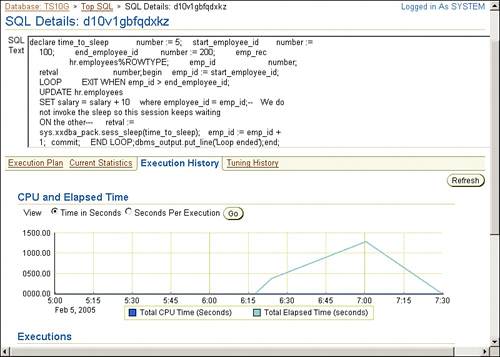 In this screen, you can view the details of the PL/SQL block as well as its execution details, such as the number of times the block was executed, a graph showing both the CPU and elapsed time as total seconds or as seconds per execution, as well as other transitory details such as the execution plan and other statistics. Note that these details are available for both SQL and PL/SQL blockswe chose to expose just the PL/SQL block because we are aware that the SQL is actually part of the PL/SQL block and is thus considered recursive.
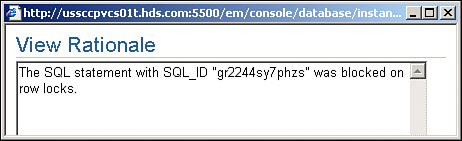
Just to create a complete picture, let's see what happens for other types of findings. Clicking the finding labeled "SQL statements were found waiting for row lock waits" on the ADDM main page shown in Figure 12.3 will take you to the screen shown in Figure 12.6. Figure 12.6. Performance finding details.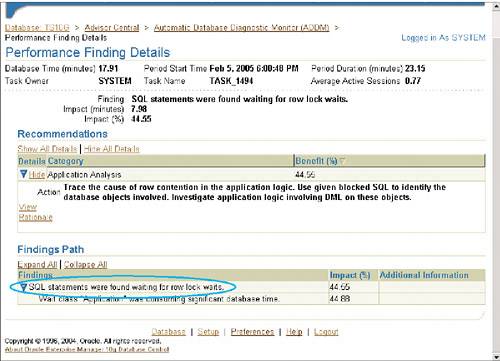 This screen does not show any advisors or other details, but instead states the following: "Trace the cause of row contention in the application logic. Use given blocked SQL to identify the database objects involved. Investigate application logic involving DML on these objects." This does not really state what caused the row locking, although there is a clue in the form of the SQL that was blocked. This is shown in the View Rationale link when available. Clicking this link opens the window shown in Figure 12.7. Figure 12.7. Details of blocked SQL.
Notice that just the SQL ID is provided, although it may have been a simple matter to fetch the accompanying SQL. You will need to fetch this SQL from the AWR tables by yourself. The query is shown in Listing 12.3. Listing 12.3. SQL to Obtain the Blocked SQL from the Rationale ScreenSQL> set long 1000 SQL> select snap_id, sql_text 2 from sys.wrh$_sqltext where sql_id = 'gr2244sy7phzs'; SNAP_ID ---------- SQL_TEXT -------------------------------------------------------------------------------- 1571 UPDATE HR.EMPLOYEES SET SALARY = SALARY + 10 WHERE EMPLOYEE_ID = :B1 That you need to perform additional analysis was actually evident from the category of the recommendation, namely "Application Analysis." Clearly, the performance analyst is expected to perform more application tracing to determine the root cause. ADDM was kind enough to highlight the problem and provide an impact analysis, however. Before moving on, let us look at just one other high-impact finding. This is shown in Figure 12.8, and is an example of a recommendation to change the environment external to the database. Figure 12.8. Performance finding details recommendation for an external environment.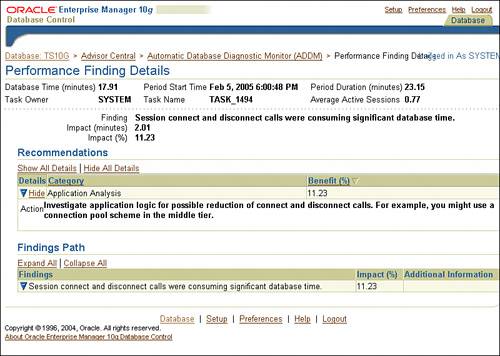 In this case, the recommendation text is "Investigate application logic for possible reduction of connect and disconnect calls. For example, you might use a connection pool scheme in the middle tier." This implies that you might be able to use a web server that supports connection pooling to mitigate this issue. You may have noticed in all these screens that both the impact of the finding as well as the benefit of implementing the recommendation are expressed as a percentage. Actually, these values are calculated using the DB Time value accumulated against that particular activity using an internal algorithm. The point is that using this common currency, ADDM can assign a number that can be used to compare problems and alternatives, rather than just stating that a problem exists. Using SQL to Get to ADDMOracle has provided a number of application program interfaces (APIs) to get to ADDM data. In fact, OEM uses them in the background to obtain and display the information. The simplest way to generate an ADDM report is to use the addmrpt.sql script. This script, along with addmrpti.sql, is stored in the $ORACLE_HOME/rdbms/admin directory for UNIX servers and the %ORACLE_HOME%\RDBMS\ADMIN directory for Windows servers. Similar to the AWR scripts that are named in the same fashion, the addmrpt.sql script is a wrapper that invokes the addmrpti.sql script, which in turn sets up and invokes various procedures in the DBMS_ADVISOR PL/SQL built-in package. Invoking the addmrpt.sql ScriptTo invoke the addmrpt.sql script, go to the $ORACLE_HOME/rdbms/admin directory and log in using an account that has privileges to access ADDM. This could be the SYSTEM account or any other account that has the DBA privilege. Alternatively, it must be a user that has both the SELECT_CATALOG_ROLE as well as the EXECUTE privilege assigned directly to the DBMS_ADVISOR package. An example of the partial dialogue for invoking this script and the resulting output, again partial, is shown in Listing 12.4. Listing 12.4. Running an ADDM Report Using SQL*PlusSQL> @addmrpt Current Instance ~~~~~~~~~~~~~~~~ DB Id DB Name Inst Num Instance ----------- ------------ -------- ------------ 845721274 TS10G 1 TS10G Instances in this Workload Repository schema ~~~~~~~~~~~~~~~~~~~~~~~~~~~~~~~~~~~~~~~~~~~~ DB Id Inst Num DB Name Instance Host ------------ -------- ------------ ------------ ------------ * 845721274 1 TS10G TS10G test10g Using 845721274 for database Id Using 1 for instance number Specify the number of days of snapshots to choose from ~~~~~~~~~~~~~~~~~~~~~~~~~~~~~~~~~~~~~~~~~~~~~~~~~~~~~~ Entering the number of days (n) will result in the most recent (n) days of snapshots being listed. Pressing <return> without specifying a number lists all completed snapshots. Listing the last 3 days of Completed Snapshots Snap Instance DB Name Snap Id Snap Started Level ------------ ------------ --------- ------------------ ----- TS10G TS10G 1629 08 Feb 2005 00:00 2 1630 08 Feb 2005 00:30 2 1631 08 Feb 2005 01:00 2 <snipped to reduce space> 1771 10 Feb 2005 23:00 2 1772 10 Feb 2005 23:30 2 Specify the Begin and End Snapshot Ids ~~~~~~~~~~~~~~~~~~~~~~~~~~~~~~~~~~~~~~ Enter value for begin_snap: 1515 Begin Snapshot Id specified: 1515 Enter value for end_snap: 1524 End Snapshot Id specified: 1524 Specify the Report Name ~~~~~~~~~~~~~~~~~~~~~~~ The default report file name is addmrpt_1_1515_1524.txt. To use this name, press <return> to continue, otherwise enter an alternative. Enter value for report_name: addmrpt_task1494 Using the report name addmrpt_task1494 Running the ADDM analysis on the specified pair of snapshots ... Generating the ADDM report for this analysis ... DETAILED ADDM REPORT FOR TASK 'TASK_1750' WITH ID 1750 ------------------------------------------------------ Analysis Period: 05-FEB-2005 from 17:00:13 to 19:30:07 Database ID/Instance: 845721274/1 Database/Instance Names: TS10G/TS10G Host Name: test10g Database Version: 10.1.0.2.0 Snapshot Range: from 1515 to 1524 Database Time: 3037 seconds Average Database Load: .3 active sessions <Rest of the output snipped> All that you will have to input to this report is the starting and ending snapshot IDs covering the time period of choice; the listing of the snapshots in Listing 12.4 will help you choose the right snapshot IDs. It goes without saying that there should not have been a database restart between these snapshots, as with the AWR snapshots. Note that we used the same starting and ending snapshots that were used in the OEM screens. We will look at the rest of the report while discussing the details in the next section. For now, note the Database Time value, which is 3,037 seconds. This denotes the DB Time value as deduced from the AWR data for these two snapshots. While using the addmrpti.sql script instead of the addmrpt.sql script, you will be able to specify the database ID as well as the instance ID, and be able to list all the existing snapshots as well. As stated before, addmrpt.sql sets up all the variables before invoking addmrpti.sql. Using the DBMS_ADVISOR APIThe DBMS_ADVISOR built-in PL/SQL package is the main API for most of the advisors. This package contains interfaces to access and use most of the advisors. In this section, you will look only at those that pertain specifically to the ADDM. Of course, the source code for the DBMS_ADVISOR package is wrapped and hence cannot be viewed. There are general advisor parameters and procedure/function calls as well as advisor-specific parameters and related calls. Details of these procedures and calls can be found in the Oracle Database 10g PL/SQL Packages and Types Reference Manual as well as in the Oracle Database 10g Performance Tuning Guide. Only some of the relevant and specific procedures are listed here, in Table 12.2.
The PL/SQL segment shown in Listing 12.5 is taken from a relevant portion of the extended SQL trace file that is generated when the addmrpt.sql script is executed. Listing 12.5. PL/SQL Section Showing How the ADDM API Is Invoked begin declare id number; name varchar2(100); descr varchar2(500); BEGIN name := ''; descr := 'ADDM run: snapshots [' || :bid || ', ' || :eid || '], instance ' || :inst_num || ', database id ' || :dbid; dbms_advisor.create_task('ADDM',id,name,descr,null); :task_name := name; -- set time window dbms_advisor.set_task_parameter(name, 'START_SNAPSHOT', :bid); dbms_advisor.set_task_parameter(name, 'END_SNAPSHOT', :eid); -- set instance number dbms_advisor.set_task_parameter(name, 'INSTANCE', :inst_num); -- set dbid dbms_advisor.set_task_parameter(name, 'DB_ID', :dbid); -- execute task dbms_advisor.execute_task(name); end; end; The CREATE_TASK procedure sets up the task to be performed, while the task parameters START_SNAPSHOT, END_SNAPSHOT, INSTANCE, and DB ID are later set up. The final procedure, EXECUTE_TASK, performs the actual task of generating the ADDM report. Once this is done, the GET_TASK_REPORT function is executed, as shown in Listing 12.6, to print the report. Listing 12.6. Print the ADDM Task Report set long 10000 longchunksize 10000 select dbms_advisor.get_task_report('TASK_1494', 'TEXT', 'TYPICAL') from sys.dual; Even though the ADDM task was created manually, this fact is still recorded in DBA_ADVISOR_TASKS. Note that the GET_TASK_REPORT function returns a CLOB and hence has to be handled accordingly. For example, if executed within SQL*Plus, you will have to use SET LONG No_of_bytes and SET LONGCHUNKSIZE No_of_bytes to be able to view the output.
The task name was TASK_1494 in this case. For an excellent example of determining the snapshots and task name directly from the DBA_HIST_SNAPSHOT view given a start and end time, and displaying the results, have a look at Example 6-2 in the Oracle Database 10g Performance Tuning Guide. |
EAN: 2147483647
Pages: 214