Making Data Graphical with Charts When most people look at a page of numbers , they see abstract values. To give that data meaning and make it more understandable, Excel provides tools for charting (graphing) the data. Charts provide a way to transform your data into a picture that more effectively illustrates the significance of the data. For example, a bar chart is commonly used to illustrate how profits have increased or decreased over time. A nonprofit organization might use a pie chart to illustrate how much money is allocated to each of its various programs. Or you might use a line chart to examine how your investments have performed over the past 12 months. Excel features a wide selection of chart types to help display data in various ways. The type you choose depends on the data you are charting and how you want that data presented. Table 1.1 lists Excel's chart types, along with a description of each type. Figure 1.12 shows the most common chart types in action. Figure 1.12. Excel features several different chart types. 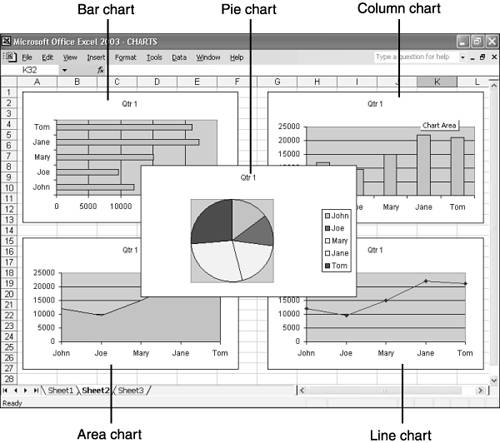 Table 1.1. Excel Chart Types | Chart Type | Description | | Column | A chart consisting of vertical rectangles of varying heights. Column charts are commonly used to compare values as they change over time but can be used in place of bar charts. | | Bar | A chart consisting of horizontal rectangles of varying lengths. Bar charts are useful for comparing values at a given point in time, such as the total monthly sales at three different stores. | | Line | A chart that looks like a connect-the-dots picture. Line charts illustrate changing values over time. You might use a line chart to plot the growing value of your portfolio over several years . | | Pie | A round chart that shows values as slices of a pie. Pie charts are useful for illustrating the relationship between parts of a whole, such as where various percentages of your paycheck are spent. | | XY (Scatter) | A chart that plots two or more sets of data as collections of dots on a graph to compare the distribution of the data sets. | | Area | A line chart that's colored in below the line. Area charts illustrate the amount of change over time and might look somewhat like sand drifts. | | Doughnut | A pie chart with the middle scooped out. This chart looks like a doughnut and is used, like a pie chart, to illustrate the relationship between parts of a whole. | | Radar | A chart that consists of several axes radiating out from a center point. Radar charts enable you to compare sets of values for various items. For example, a radar chart could illustrate the relative concentrations of vitamins and minerals in various food products. | | Surface | A three-dimensional chart that illustrates the optimum combination of two variables . For example, you might use a surface chart to illustrate how pressure and temperature affect the boiling point of a particular liquid. | | Bubble | A type of XY (Scatter) chart that uses a bubble to illustrate a third variable. For example, a bubble chart might graph the productivity of workers along the Y axis, using the size of the bubbles to represent each worker's salary. If a worker has a large bubble sitting low on the Y axis, the worker would be a highly paid, underproducing worker. | | Stock | A chart that displays the high, low, and close prices of stocks in a given day. | | Cylinder | A column or bar chart that uses cylinders rather than blocks. | | Cone | A column or bar chart that uses cones rather than blocks. | | Pyramid | A column or bar chart that uses pyramids rather than blocks. | Excel has three-dimensional versions of most of the basic chart types. For instance, the bars in bar charts can be made to look like blocks rather than flat rectangles. This 3D look can make a great impact in reports and presentations. Tip  | If you use PowerPoint to create presentations, you can copy charts from Excel and paste them on slides in your PowerPoint presentation. |
At first, you might think that charting data would be a complicated task, but Excel actually features a Chart Wizard that greatly simplifies the process. All you need to do is select the cells that contain the data you want to chart, start the Chart Wizard, and follow its instructions. The Chart Wizard leads you step-by-step through the process, prompting you to select the desired chart type and enter any other preferences. After you have answered all the wizard's questions, it creates the chart according to your specifications. You can then tweak the chart as desired to further customize it. All this is explained in greater detail in Chapter 8, "Charting (Graphing) the Worksheet Data." The Absolute Minimum In this chapter, you learned all the basic concepts and terminology required to start working with Excel worksheets. Congratulations! You now have a solid understanding of how worksheets are structured, what they do, and how they do it. You know that worksheets consist of columns and rows that intersect to form cells. You know that you can type text, values, or formulas into cells to create a functional worksheet. You know that you can chart your data to make it more graphical with Excel's Chart Wizard. At this point, you also have a clear picture of how Excel uses cell addresses to determine the location of cells and how Excel uses cell addresses in its formulas and functions. Of course you're not ready to start entering formulas and functions, but with the knowledge you have at this point, you're way ahead of the game and well prepared to get some hands-on experience with Excel in the next chapter. | |