13.3 Programming Techniques
13.3 Programming Techniques
The starting point for most of the examples of this chapter is a rather extensive table (11 columns , 2100 rows; see Figure 13-15). These data were imported with MS Query from nwind.mdb into the worksheet nwind-data . The worksheets nwind-1 , nwind-2 , etc., access these data. All these examples can be found in the file Pivot.xls . The following list gives a brief description of the worksheets contained in this file:
| intro1 | introductory example 1 (data and two pivot tables) |
| intro2 | introductory example2 (data and three pivot tables, time grouping) |
| intro2-details | detail data for intro2 (sales figures August 1996) |
| olap-cube | pivot table, based on olap.cub |
| pivot-chart | pivot table with chart, data basis nwind.mdb |
| nwind-link | pivot table, data basis nwind.mdb |
| nwind-data | data table (imported by MS Query from nwind.mdb ) |
| nwind1, -2 | various pivot tables based on the data in nwind-data |
| code1, -2 | various pivot tables plus VBA code |
Generating and Deleting Pivot Tables
CreatePivotTable Method
There are several ways in which you can generate a new pivot table. However, here we are going to present only two variants. The first corresponds to what can be produced with the macro recorder. We begin with the data basis of a PivotCache object, from which a pivot table, initially empty, is created with the method CreatePivotTable . The structure of the pivot table is then determined by changing the Orientation property of some pivot fields. The apostrophes in the pivot field names come from MS Query. This program uses this unnecessary character in the names of some imported columns. The method CreatePivotTable adopts this notation from the nwind-data worksheet. Therefore, we must stick with this notation.
| Tip | PivotField objects are presented more fully in the next subsection, and the PivotCache object in the one following. |
' Pivot.xls, code1 Private Sub btnCreatePivot1_Click () Dim pc As PivotCache, pt As PivotTable Dim ptName$ ' Me refers to the worksheet associated to this module ptName = Me.Name + "_ptsample1" btnDeletePivot_Click ' delete existing pivot table Set pc = ThisWorkbook.PivotCaches.Add(xlDatabase, _ "'nwind-data'!R3C1:R2158C11") Set pt = pc.CreatePivotTable([a8], ptName) With pt .PivotFields("Quantity").Orientation = xlDataField .PivotFields("'Category'").Orientation = xlColumnField .PivotFields("'EmployeeName'").Orientation = xlRowField .PivotFields("'CustomerCountry'").Orientation = xlPageField End With End Sub The result of this procedure is depicted in Figure 13-20.
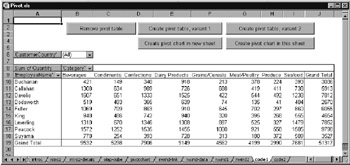
Figure 13-20: The result of the procedure code1.btnCreatePivot1_Click
PivotTableWizard Method
The second variant for creating new pivot tables is the PivotTableWizard method. Here all the information for generating an empty pivot table is passed in a number of parameters. The PivotCache object is generated automatically. The lines for generating the table structure are as in the first example.
' direct generation of a pivot table Private Sub btnCreatePivot2_Click () Dim pt As PivotTable Dim ptName$ ' Me references the worksheet associated to this module ptName = Me.Name + "_ptsample1" btnDeletePivot_Click 'delete existing pivot table Set pt = Me.PivotTableWizard(SourceType:=xlDatabase, _ SourceData:="'nwind-data'!R3C1:R2158C11", _ TableDestination:="R8C1", TableName:=ptName) With pt .PivotFields("...").Orientation = ... ' as in btnCreatePivot1_Click End With End Sub Generating a Pivot Chart
If you want to generate a new pivot chart, you will require first a pivot table. If one is at hand, then a new chart sheet can be generated with Charts.Add . SetSourceData assigns the range of the pivot table as data source. Done!
Private Sub btnPivotChart1_Click () Dim ch As Chart If Me.PivotTables.Count = 0 Then Exit Sub Set ch = Charts.Add ch.ChartType = xlColumnStacked ch.SetSourceData Source:=Me.PivotTables(1).TableRange2 End Sub
Things become a bit more complicated if the pivot chart is to be located in the same worksheet as the pivot table. Again the chart is generated with Charts.Add . However, this time, the new object is inserted into the worksheet with the Location method. At this point, and for some strange reason, the object variable ch can no longer be accessed. All further operations must therefore be carried out with ActiveChart .
Now the underlying ChartObject is accessed via Parent . (This object is responsible for embedding the chart in the worksheet; see Chapter 10.) With Left and Top the location of the object is set such that the chart appears directly under the table.
Private Sub btnPivotChart2_Click () Dim ch As Chart Dim pt As PivotTable If Me.PivotTables.Count = 0 Then Exit Sub Set pt = Me.PivotTables(1) Set ch = Charts.Add With ch .ChartType = xlColumnStacked .SetSourceData Source:=pt.TableRange2 .Location Where:=xlLocationAsObject, Name:="code1" End With ' from here on ActiveChart must be used With ActiveChart.Parent ' refers to ChartObject .Left = 20 .Top = pt.TableRange2.Top + pt.TableRange2.Height + 10 End With End Sub
Deleting a Pivot Table
In Excel there is no command for deleting a pivot table. It is thus a bit surprising that there is also no Remove or Delete method for the PivotTables enumeration. Nevertheless, it is a simple matter to delete a pivot table: Simply delete the entire range of cells reserved for the table, thereby automatically deleting the PivotTable object. ( TableRange2 refers to the cell range of the entire pivot table. The property is discussed in the following section.)
' delete all pivot tables in a worksheet Private Sub btnDeletePivot_Click () Dim pt As PivotTable, ws As Worksheet Set ws = Me 'references the worksheet connected to this module For Each pt In ws.PivotTables pt.TableRange2.Clear Next End Sub
If the table was linked to a pivot chart, this chart remains. The data therein displayed are now static, however. You can delete the chart with Charts( ).Delete ChartObjects( ).Delete . However, you can also link this chart with a new (or existing) pivot table by again executing the method SetSourceData .
Macro Recording with Pivot Tables
In the case of pivot tables the macro recorder once again leads to a rapid understanding of how particular operations can be executed in code. But as usual, code produced by the macro recorder is seldom optimal. In particular, if you record the insertion of a new pivot table (that is, the steps that you usually carry out with the pivot table wizard), the resulting code is unusually complex. This is due primarily to the fact that for some strange reason Excel breaks up long character strings into a two-dimensional Array . Instead of
.Connection= "..."
the macro recorder produces
.Connection = Array(Array("part1"), Array("partw") ...) Of course, the recorder splits the character strings in arbitrary locations, which has an adverse effect on readability. Before you begin to transform the Array conglomerate into a readable instruction, you should have the contents of the character string displayed in the immediate window, for example via the following instruction:
?ActiveSheet.PivotTables(1).PivotCache.Connection
You can then insert the result into the program code via the clipboard. You will still have to insert quotation marks and split the string into several lines as required, but this method is usually faster than working directly on the code produced by the macro recorder.
SQL2String
If your pivot table is based on a very complex SQL instruction (for example, in the case of an OLAP query), the macro recording often fails completely due to the maximum number of line extension characters (the underscore ) being exceeded. In this case you will have to write the code yourself, where again you can extract the character strings from the existing pivot tables.
If manual division of the SQL code results in more than twenty lines, you must work with a String variable, which you can extend via x = x + " " as much as you like. You can be assisted in this task with the small program sql2string.exe , which can be found in the book's sample files (Figure 13-21). It takes the text displayed in the upper window region and creates the variable allocation corresponding to Visual Basic syntax. The text in the upper window region can be edited as in a text editor (line folding).
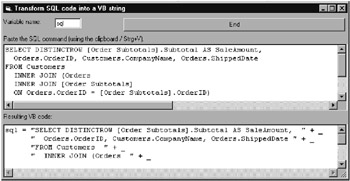
Figure 13-21: Converting long character strings into Visual Basic Syntax
Construction and Reconstruction of Existing Pivot Tables
Cell Ranges
The starting point for any manipulation in a pivot table is first of all the three enumerations PivotTables , PivotFields , and PivotItems : PivotTables refers to all pivot tables in a worksheet. With the PivotTable object, alongside the method PivotFields described below, you can evaluate the properties TableRange1 , TableRange2 , PageRange , ColumnRange , RowRange , DataBodyRange , and DataLabelRange . RowGrand and ColumnGrand specify whether the result rows or columns of a pivot table are to be displayed (see Figure 13-22).
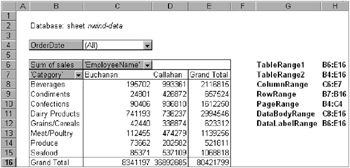
Figure 13-22: Ranges of a pivot table
Pivot Fields ( PivotField )
PivotFields contains all the pivot fields defined for a table. (Each pivot field represents a column of the source data.) The Orientation property of the PivotField object determines whether the field is used for structuring the data, returning results, or nothing at all. If you alter the Orientation property of a pivot field, you create thereby, for example, a data field, a page field, or you make the field disappear.
PivotField objects govern the structure of the pivot table. With the methods ColumnFields , DataFields , HiddenFields , PageFields , RowFields , and VisibleFields you can access all PivotField objects of a particular Orientation type.
A large number of PivotField properties govern the layout details of a pivot table: DataRange and LabelRange specify the location of the label and result cells. Function determines according to which function the results are to be calculated for the data fields. Subtotals contains a data field that specifies what types of subtotals are to appear in the pivot table. In the case of page fields, CurrentPage specifies which page is currently selected.
| Pointer | This description is anything but complete. A host of additional properties are listed in the object browser and described in the on-line help. You might also experiment with the macro recorder by changing a single detail of an existing pivot table. |
OLAP Fields (CubeField)
If your table is based on OLAP data, then the landscape takes on another cast altogether: In this case the manipulation of pivot fields is accomplished not with the aid of PivotFields , but with CubeFields . In the case of the CubeField object we are dealing with a reduced variant of PivotField that corresponds to the possibilities inherent in OLAP data. (With OLAP data you can carry out many fewer operations. The layout of the table is greatly limited by the query options that were chosen when the OLAP cube was created.)
Calculated Fields (Formula Fields)
It is possible to create a new pivot table from existing pivot fields: If, say, there are columns price and quantity in the source data, a new pivot field sales can be calculated from the product of these two. In interactive mode you execute the command FormulasCalculated Field on the pivot table toolbar. In VBA code you execute CalculatedFields.Add "sales", "=price * quantity" . Then you can use sales as you would any other pivot field. CalculatedFields refers to all pivot fields that do not come directly from the source data but are calculated. For these fields the equality IsCalculated=True holds. The property Formula contains the calculational formula.
| Tip | Calculated fields that are placed as data fields cannot be hidden with Orientation = xlHidden. (The error message reports that the Orientation property cannot be set.) Since the macro recorder produces precisely this code, this constitutes an error in Excel 2000. Despite lengthy experiments, the author has been unable to find another way to get such a field out of the table via code. There seems to be no other solution than to delete the entire table. |
Grouping of Pivot Tables
Some of the possibilities for analysis of pivot tables can be explored with the grouping function. The necessary Group method has an existence independent of pivot tables (see Chapter 11). As object reference it expects simply a cell or range of cells. If this range happens to lie within a pivot table, then the grouping will be carried out for that table.
As a rule, only date and time fields lend themselves to grouping. The key parameter of Group is then Periods : A data field is passed to it that specifies for what units of time the grouping is to be carried out (seconds, minutes, hours, days, months, quarters , or years ). As a result of the grouping new pivot fields arise, which can then be edited like all other pivot fields.
' group date fields (months, quarters, years) [c3].Group Start:=True, End:=True, _ Periods:=Array(False, False, False, False, True, True, True) pt.PivotFields("Years").Orientation = xlPageField When grouping takes place, then usually, subtotals are to be displayed. For this we have the Subtotals property, which must be applied directly to a pivot field. A data field is also associated to Subtotals . It is specified in several True and False values what types of subtotals are to be created (sum, mean, etc.)
The sequence of parameters is documented in the on-line help.
.PivotFields("Quarters").Subtotals = Array(False, True, False, _ False, False, False, False, False, False, False, False, False) Pivot Items ( PivotItem )
One level below Pivotfields and CubeFields are the PivotItem objects: These have to do with result columns or rows of the pivot table. PivotItem objects are associated to a PivotField . For example, with the Visible property of the PivotItem the visibility of individual result columns or rows can be changed. In interactive mode this corresponds to a change in the check boxes of a pivot field (see Figure 13-23).
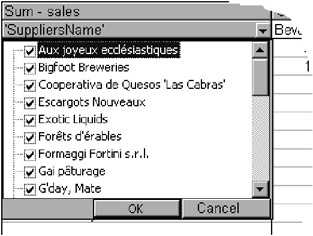
Figure 13-23: Showing or hiding individual rows (PivotItems) of a pivot field
Example
The following procedure demonstrates the application of many of the above- described objects and properties. The results can be seen in Figure 13-24.
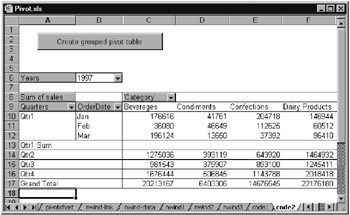
Figure 13-24: Result of the procedure code2.btnCreatePivot1_Click
' Pivot.xls, Code2 Private Sub btnCreatePivot1_Click () Dim pc As PivotCache, pt As PivotTable, pf As PivotField Dim ptName$ ' Me is sheet for this code ' remove existing pivot tables For Each pt In Me.PivotTables pt.TableRange2.Clear Next Set pc = ThisWorkbook.PivotCaches.Add(xlDatabase, _ "'nwind-data'!R3C1:R2158C11") Set pt = pc.CreatePivotTable([a8], ptName) With pt .PivotFields("OrderDate").Orientation = xlRowField .PivotFields("'Category'").Orientation = xlColumnField ' new field, number format without decimal places .CalculatedFields.Add "sales", "= Quantity * '"Price'''" .PivotFields("sales").Orientation = xlDataField .PivotFields("Sum of sales").NumberFormat = "0" ' group date field (months, quarters, years) ' use years fields as page field, show only 1997 ' results for each quarter .PivotFields("OrderDate").VisibleItems(1).LabelRange.Group _ Start:=True, End:=True, _ Periods:=Array(False, False, False, False, True, True, True) .PivotFields("Years").Orientation = xlPageField .PivotFields("Years").CurrentPage = "1997" .PivotFields("Quarters").Subtotals = Array(False, True, False, _ False, False, False, False, False, False, False, False, False) End With End Sub Internal Management (PivotCache)
The data basis of pivot tables is managed internally by PivotCache objects (one per pivot table). Such an object does not itself store the data, but contains a description of the parameters that are necessary for reading in external data (see Figure 13-25). The property MemoryUsed specifies the requirements for intermediate data storage. For example, if the large Northwind table from Figure 13-15 is used as a data basis, then the memory requirement is about 200 kByte. RecordCount specifies how many data records (rows) the data source comprises.
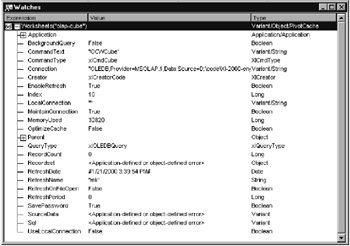
Figure 13-25: Analysis of the PivotCache object in the Watches wi
According to the data source, various properties of the object are employed. An attempt to access other properties leads to an error message. For some strange reason there is no property that is always available and that specifies the type of the data source. Thus if you execute a loop over all PivotCache objects, you must protect the code with On Error Resume Next and test Err after accessing particular properties to obtain information about the data source type.
| EXCEL TABLES AS DATA SOURCE | |
|---|---|
| QueryType | not initialized ; access results in an error |
| CommandType | not initialized; access results in an error |
| Connection | not initialized; access results in an error |
| CommandText | not initialized; access results in an error |
| SourceData | contains as a character string (not a Range object) the address of the table fields; the character string is localized for some unclear reason: Thus the German version of Excel contains, for example, "intro1!Z4S2:Z26S7" , while the English-language version has "intro1!R4C2:R26C7" |
| EXTERNAL DATA SOURCE (VIA MS QUERY) | |
|---|---|
| QueryType | contains xlODBCQuery |
| CommandType | contains xlCmdSql |
| Connection | contains connection information as with a QueryTable object ( "ODBC; " ) |
| CommandText | contains the SQL command |
| SourceData | contains again the SQL; however, it is broken into an Array of character strings of 256 characters each |
| OLAP CUBE AS DATA SOURCE | |
|---|---|
| QueryType | contains xlOLEDBQuery |
| CommandType | contains xlCmdCube |
| CommandText | contains "OCWCube" |
| Connection | contains in a single (usually huge) character string both the connection information and the SQL command for the OLAP cube |
| SourceData | not initialized; access results in an error |
Updating Relations Between Pivot Tables and Data Sources
The reason for the relatively extensive treatment of PivotCache is that the transfer of the pivot table example files in the book's sample files produces errors unless certain measures are taken. The file names Nwind.mdb and Olap.cub are stored in the Connection and CommandText character strings with drive and path information. If you were then to open these pivot example files on your computer, Excel would complain during an attempt to update the data that it was unable to find the source data (and I would be deluged with e-mail that my examples don't work).
Unfortunately, in contrast to the case of the QueryTable object, it is not permitted simply to change the properties of the PivotCache object in order to correct the path to the database files.
The only, and alas truly costly, alternative consists in deleting the pivot tables and recreating it based on existing information. The problem with this modus operandi is that some of the layout information for the pivot table is lost.
On the other hand, the "fix-it code" reveals a great deal of internal affairs about the management of pivot tables and is therefore of interest from the point of view of general understanding.
Code execution begins in Workbook_Open , that is, in the first procedure that is executed when an Excel file is opened. There the first thing that happens is that CheckMSQueryData is called, in order to set the paths to external Access files for all tables imported with MS Query (see Chapter 12).
' Pivot.xls, ThisWorkbook Private Sub Workbook_Open () CheckMSQueryData ' see Workbook_Open in Chapter 12 CheckPivotTableData End Sub
In CheckPivotTableData a loop is run over all PivotTable objects in the worksheet. For each table a test is made as to whether it is based on external data. (For tables for which this is not the case the attempt to read QueryType leads immediately to an error. The line of code is thus adequately protected.)
If there are external data, then with ExtractDir (see again Chapter 12) the directory with the data is returned. If this does not agree with ThisWorkbook.Path , then a question appears (only for the first such table) whether the tables should really be created anew. This task is then accomplished in RecreatePivotTable .
Sub CheckPivotTableData () Dim ws As Worksheet Dim pt As PivotTable Dim pc As PivotCache Dim qtype& Dim oldDir$, newDir$ Dim result& ' current directory (without \ at the end) newDir = ThisWorkbook.Path If Right(newDir, 1) = "\" Then newDir = Left(newDir, Len(newDir) - 1) End If For Each ws In ThisWorkbook.Worksheets For Each pt In ws.PivotTables Set pc = pt.PivotCache qtype = -1 On Error Resume Next qtype = pc.QueryType 'here an error can occur On Error GoTo 0 If qtype = xlODBCQuery Or qtype = xlOLEDBQuery Then ' extract previous path from Connection string oldDir = ExtractDir(pc.Connection) ' replace by new path If oldDir <> "" And LCase(oldDir) <> LCase(newDir) Then If result = 0 Then result = MsgBox("...?", vbYesNo, "Recreate pivot tables?") End If If result = vbYes Then RecreatePivotTable pt, oldDir, newDir End If End If End If Next Next End Sub RecreatePivotTable begins by determining the properties of the current pivot table. With the character strings for Connection and CommandText the prior path is replaced by the new path.
The new table should be recreated exactly in the place of the former table. Therefore, in determining the start cell (variable ptRange ) it is tested whether the table is equipped with pivot page fields. This test is necessary, since in creating a new pivot table space is automatically reserved for a row with pivot page fields.
Sub RecreatePivotTable (pt As PivotTable, oldDir$, newDir$) Dim pc As PivotCache Dim chrt As Chart, chobj As ChartObject Dim ws As Worksheet Dim i&, cmdType&, hasChart& Dim con$, cmdText$, ptName$ Dim ptRange As Range Dim ptLayout() ' retrieve current properties Set pc = pt.PivotCache con = Replace(pc.Connection, oldDir, newDir, Compare:=vbTextCompare) cmdType = pc.CommandType cmdText = Replace(pc.CommandText, oldDir, newDir, _ Compare:=vbTextCompare) ptName = pt.Name If pt.PageFields.Count > 0 Then '2 rows below first page field Set ptRange = pt.TableRange2.Cells(3, 1) Else 'first cell of table Set ptRange = pt.TableRange1.Cells(1) End If
The layout of the table is actually not completely recreated, but at least the principal features of its construction should be preserved. Therefore, the names and locations of all visible pivot fields are saved in the field ptLayout . One must take care that for OLAP pivot tables, CubeFields must be evaluated, while for traditional pivot tables, it should be VisibleFields .
If LCase(cmdText) = "ocwcube" Then ' OLAP pivot table ReDim ptLayout(pt.CubeFields.Count, 2) For i = 1 To pt.CubeFields.Count ptLayout(i, 1) = pt.CubeFields(i).Name ptLayout(i, 2) = pt.CubeFields(i).Orientation Next Else ' standard pivot table ReDim ptLayout(pt.VisibleFields.Count, 2) For i = 1 To pt.VisibleFields.Count ptLayout(i, 1) = pt.VisibleFields(i).SourceName ptLayout(i, 2) = pt.VisibleFields(i).Orientation Next End If
Then the entire workbook is searched for a Chart object that might just happen to be associated to the table. Thus a test is run whether a Chart object exists whose PivotLayout.PivotTable property refers to the PivotTable object under examination. For some mysterious reason a direct object comparison using Is fails. For this reason the properties Worksheet.Name and Address of TableRange1 are compared with the auxiliary function PtCompare (method trial by error ).
' connected chart in this sheet? hasChart = False For Each chrt In ThisWorkbook.Charts If PtCompare(chrt.PivotLayout.PivotTable, pt) Then hasChart = True Exit For End If Next ' connected chart in another sheet? If hasChart = False Then For Each ws In ThisWorkbook.Worksheets For Each chobj In ws.ChartObjects If Not (chobj.Chart.PivotLayout Is Nothing) Then If PtCompare(chobj.Chart.PivotLayout.PivotTable, pt) Then hasChart = True Set chrt = chobj.Chart Exit For End If End If Next Next End If
This completes the preliminary preparations . The old pivot table is deleted and immediately recreated. Then an attempt is made to place the pivot fields in their previous locations. Here problems can arise if there are no longer existing pivot fields in ptLayout . This case occurs, for example, if in the original table a data field was grouped. Then the grouping fields (such as "year," "month") are also valid. In the new table these fields are missing, in the absence of grouping. Be sure to note here as well the distinction between PivotFields and CubeFields (OLAP).
' delete old pivot table (including cache) pt.TableRange2.Clear ' build new pivot table Set pc = ThisWorkbook.PivotCaches.Add(xlExternal) pc.Connection = con pc.CommandType = cmdType pc.CommandText = cmdText Set pt = pc.CreatePivotTable(ptRange, ptName) For i = 0 To UBound(ptLayout(), 1) If ptLayout(i, 2) <> xlHidden Then On Error Resume Next 'error occurs if field from 'date group (e.g. 'years') If LCase(cmdText) = "ocwcube" Then ' OLAP pivot table pt.CubeFields(ptLayout(i, 1)).Orientation = ptLayout(i, 2) Else ' standard pivot table pt.PivotFields(ptLayout(i, 1)).Orientation = ptLayout(i, 2) End If On Error GoTo 0 End If Next
In Chart objects that are present the old data continue to be displayed. The underlying data are not dynamically linked, but only a static copy of the original data. With SetSourceData the new table can be relinked with the Chart object.
' reconnect new pivot table with existing chart If hasChart Then chrt.SetSourceData pt.TableRange2 chrt.Refresh End If End Sub ' for unknown reasons the expression 'pt2 Is pt2' is sometimes False ' even though pt1 and pt2 reference the same pivot table Function PtCompare (pt1 As PivotTable, pt2 As PivotTable) As Boolean Dim rng1 As Range, rng2 As Range Set rng1 = pt1.TableRange1 Set rng2 = pt2.TableRange1 If rng1.Address = rng2.Address And _ rng1.Worksheet.Name = rng2.Worksheet.Name Then PtCompare = True Else PtCompare = False End If End Function
| Caution | Just as in Chapter 12 the following warning should be issued: The following procedures depend on the path to the database file being stored in the attribute DefaultDir of the Connection property. In the current version of Excel this is the case is the data source in directly an Access file or an OLAP cube based on an Access file. It is thus uncertain whether this process functions for other data sources or whether it will function in future versions of Excel. Furthermore, the procedures assume that all affected databases are located in the same directory as the Excel file. The assumption holds as well only in the present case, but certainly not for every Excel application. |
Syntax Summary
wsh stands for a WorkSheet object, rng for a range of cells.
| PIVOT TABLES | |
|---|---|
| wsh. PivotTableWizard | creates or changes a pivot table |
| wsh. PivotTables(..) | access to pivot table objects |
| chrt.PivotLayout | access to the PivotLayout object |
| chrt.PivotLayout.PivotCache | access to the PivotCache object |
| chrt.PivotLayout.PivotFields | access to the PivotField object |
| chrt.PivotLayout.PivotTable | access to the PivotTable object |
| chrt.SetSourceData rng | associate chart to pivot table |
| PIVOTTABLE PROPERTIES AND METHODS | |
|---|---|
| TableRange1 | cell range of the table without page fields |
| TableRange2 | cell range of the table including page fields |
| PageRange | cell range of page fields |
| ColumnRange | cell range of column fields |
| RowRange | cell range of row fields |
| DataBodyRange | data range |
| DataLabelRange | label of data range (upper left corner) |
| PivotFields(..) | access to all pivot fields of the pivot table |
| VisibleFields(..) | access to all visible fields |
| PageFields(..) | access to page fields |
| ColumnFields(..) | access to column fields |
| RowFields(..) | access to row fields |
| DataFields(..) | access to data fields |
| HiddenFields(..) | access to currently visible pivot fields |
| CubeFields(..) | access to pivot fields for OLAP data ( CubeField object) |
| PivotCache | access to the PivotCache object |
| RefreshData | updates pivot table (rereads source data) |
| PIVOTFIELD PROPERTIES | |
|---|---|
| DataRange | cell range of the data fields of a pivot field |
| LabelRange | cell range of the label fields of a pivot field |
| Orientation | type of pivot field ( xlPageField , xlColumnField , xlRowField , xlDataField , xlHidden ) |
| Subtotals | governs which subtotals are displayed |
| Function | determines the calculational function (for data fields only) |
| CurrentPage | determines the currently visible page (for page fields only) |
| PivotItems(..) | access to individual pivot elements |
| CubeField | OLAP-specific additional properties |
| PIVOTCACHE PROPERTIES AND METHODS | |
|---|---|
| CommandType | type of SQL command (SQL, OLAP-Cube) |
| CommandText | SQL command with external data |
| Connection | access to data source with external data |
| MemoryUsed | memory requirement (RAM) in bytes |
| QueryType | data type with external data (ODBC, OLE DB) |
| RecordCount | number of data records (rows) |
| SourceData | address of source data in worksheet |
| CreatePivotTable | create pivot table from PivotCache |
EAN: 2147483647
Pages: 134