Section 4.1. Regression
4.1. RegressionFor more complex kinds of problems, a technique called regression is used. Excel has a regression tool from Tools The first example predicts a stock price. We have 223 days of technical data for a stock including the opening price, the high, the low, the closing price, and the volume for each day. We predict tomorrow's closing price using this information. We build a model using regression. But we will need a way to know if our model is any good. So, we start by making a simple prediction. Then we can compare the accuracy of our model to the simple prediction. If our model is not more accurate than the simple prediction, it does not add any value and we might as well just use the simple prediction. For the simple prediction, we assume the closing stock price tomorrow will be the same as today's closing price. Figure 4-1 shows the setup. The array formula in cell I7 gives the average error amount for the prediction. On average we are off by about $0.46 everyday. But we have six pieces of information about the stock, not just the closing price, so next we make the prediction using all six. Figure 4-1. A simple prediction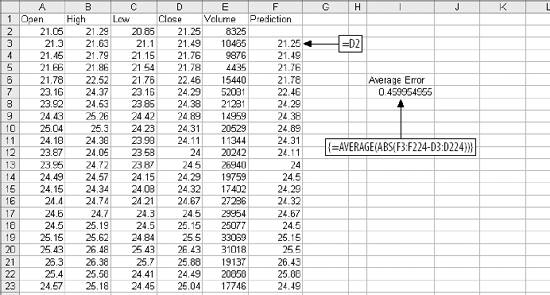 We assume all six metrics add some value to the prediction. Each metric is multiplied by a weight, and then they are added up. An additional value, called the intercept, is added to the sum to get the final prediction. Figure 4-2 below shows how the problem is set up in Excel. Figure 4-2. Setup for a regression model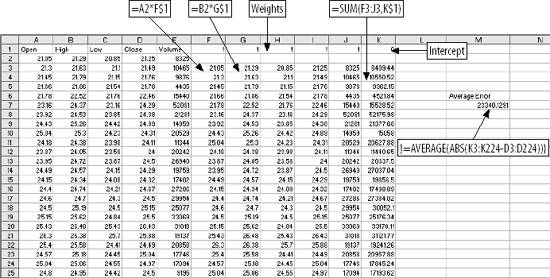 The formula in F3 multiplies the opening price in column A by the weight in cell F1. We start in row 3 because that is where we started in the calculations in Figure 4-1. This way we can compare the accuracy of the regression to the simpler method for exactly the same days. This formula fills right to column J, and down to the end of the data at row 224. In cell K3, the weighted metrics are summed with the intercept. The value in K3 is the prediction. The weights are all 1, the intercept is 0, and the average error is a little on the high side. Next we set the weights and intercept using Excel's regression tool. When Regression is clicked on the Data Analysis sub-menu, the dialog in Figure 4-3 is displayed. Figure 4-3. Regression dialog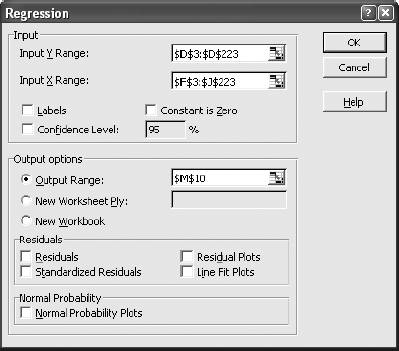 The Input Y Range is the value we want to predict. Here it is the next day's closing stock price from Figure 4-2. The Input X Range contains the metrics used to make the prediction. The Output Range is selected as the output option and cell M10 is entered. This means that the Regression tool will put its output in a cell range starting at M10, as shown by the results in Figure 4-4. In the Regression results, item 1, R Square, tells us the model has predictive ability. This value is always between 0 and 1. The higher the value the better, and 0.97666 is about as good as it gets. Item 2 is the intercept. Item 3 is the weight for the first metric, Opening Price. The other weights are below in the same column. Item 4, P value, tells us how much importance each of the metrics has in the model. With this item, low values are good. The P Value for the first metric, Opening Price, is over 0.8. This is too high and suggests Opening Price is not adding much value to the prediction. So, it makes sense that the weight for opening prices is small, 0.048. The best metric is variable 4, the Closing Price. It has a P value of 0.000002 and has the highest weight. Figure 4-4. Regression results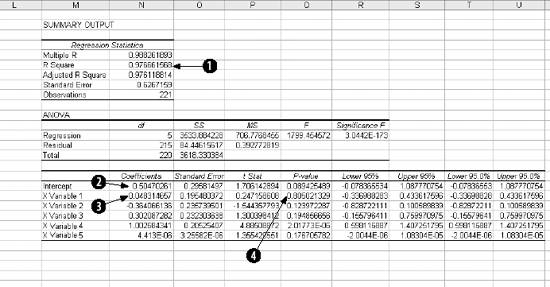 Next we use Copy and Paste Special (Transpose) to move the weights to the model, and copy and paste the intercept. This results in Figure 4-5. Figure 4-5. Regression Model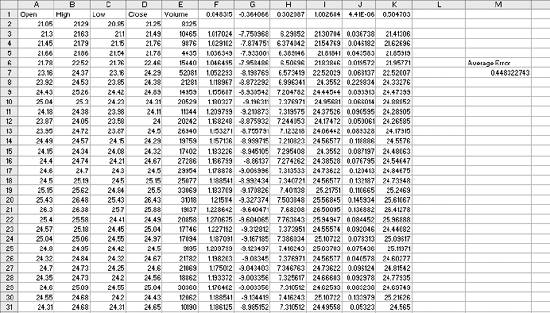 The average error is $0.448 per day. This is just a little better than the $0.46 average error for the simple prediction, because the regression model is using more information. The six metrics working together do a better job. But are these the best metrics? We have more past information and could consider how many days in a row the stock has been up or down, where the price is with respect to the 50 day moving average, or any number of other things. Selecting good metrics is critical. Regression assumes the relationships are linear . What if they aren't? Are we sure that tomorrow's closing price is the best thing to predict? Perhaps it is better to predict how much the stock price will change or whether it will move more than 2%. Some things are easier to predict, some metrics work better in a model. To make a good model you have to make good choices. Understanding how to use regression is just the beginning. To go further, we'll use a different but analogous example. |
 Data Analysis
 EAN: 2147483647
Pages: 101