Section 4.2. Defining the Problem
4.2. Defining the ProblemWe start with a question. Can we predict the results of a dog race? The first challenge is to figure out what the question means. We could predict which dog is most likely to win, or finish in the top two or three positions. We could predict the first and second dogs in a race. But predicting which dog will win may not be the point. The real issue is probably money. If we are looking at dog races, we want to know which bets are most likely to be profitable, so we need to predict how much a dog will pay along with its chances of winning. We can build a model to predict this, but how will we know if the model is any good? In this case it's easy. If we can make a profit using the model, then it is good; otherwise, it is useless. If we build a credit scoring model, we have the same problem. It is not enough to identify accounts that are most risky. As a group these accounts may still be profitable, and a model would need to consider the impact to the bottom line, not just the level of risk. The same problem occurs when modeling stock prices. What do we really need to know? If we are trading options, we don't need to know the future price of the stock. All we need is the probability that it will trade above or below a price in a given period of time. There is another important consideration here. Some things are easier to model than others. For example, if we try to build a model that predicts which dog will win in a race, we are trying to identify one winner out of eight dogs. When we look at the data there will be seven times more losers than winners. This makes modeling difficult. It is easier to get a good result when there is an even mix of outcomes in the data. Next we consider the data used to build the model. What data is available? In most business situations there will be historical data. If we are modeling collections calls to increase dollars collected per call, we will need data on past collections calls and their outcomes. For stocks there is plenty of historical data available. With dog races, the data is on the racing form. Which metrics are best at predicting the value we are interested in? Since we are looking at dog racing, presumably we want to know if a dog is in the habit of winning races. The racing form tells us how many races each dog has been in and how many first, second, and third places the dog has achieved. It also has detailed information about each dog's last six races. From this information we take the number of first places the dog has out of the last six races and the fastest speed the dog has run in the last six races. Perhaps starting position makes a difference. The dog in the first position starts on the inside and that could be an advantage. And what about experience? If a dog has run more races maybe they will have a better chance. Racing forms are available on the Internet at several betting and track web sites. The report extracting macro explained in Chapter 9 was used to extract data from racing forms for 6,204 races. Each race has eight dogs so there are 52,032 rows of data, one for each dog. Most of the data items come straight from the form, but in two cases some logic is involved. First is running speed. On the racing form the running time for each of the dog's last six races is given. But not all races are the same length. The distance for each race is given, so we could divide the distance by the time to get running speed. But converting race distances (as they appear on the form) into yards is difficult. There is an easier way. We convert the running time to a ratio by dividing the dog's time by the average time for all dogs running that distance. The technique is shown in Figure 4-6. We have a list of distances and average times taken from historical data in columns A and B of Figure 4-6. For each dog's last six races we have the distance and the time. We use the LOOKUP function to find the average time for a race of that distance and then divide the dog's time by the average time. In Figure 4-6, the dog has run a 550 yard race about 1% faster than average. This technique eliminates the need to understand data like the distance given as RP. It is probably a race course name, but knowing that still doesn't give us the distance in yards. Converting the times to ratios makes the actual distance unimportant. This works for much more than dog races. If you are modeling a direct mail campaign, you might have response rates by ZIP code from previous mailings. This is good information but there are thousands of ZIP codes and, since ZIP codes have no numeric meaning, they cannot be used directly in a model. You can, however, substitute ratios for the ZIP codes and use the ratios in the model. This technique can convert most categorical items into metrics that can be used in a model. Figure 4-6. Substituting a ratio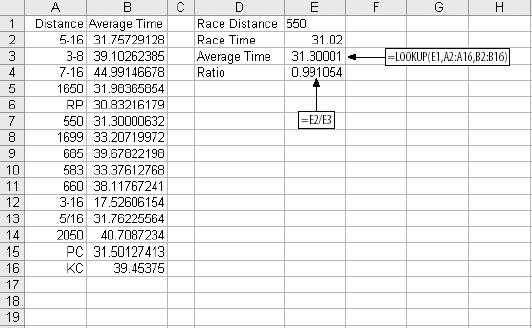 In our example, the ratios for the dog's six previous races are calculated and the lowest ratio (best time) is kept. We don't use an average because we are interested in how fast the dog can run under ideal conditions. The second calculated item is the number of first places the dog has scored out of the last six races. This is a number from zero to six. The rest of the data comes straight from the racing form and is shown in Figure 4-7. The race number in column A is just a number to keep the races separate. Next is the dog number, which is also the position number. Dog 1 starts on the inside next to the rail. Dog 8, on the outside, has the longest distance to run. Column C, Races, is the number of races the dog has run. A big number here means the dog is older and more experienced. Column D, Wins, is the total number of times the dog has come in first. Column E, WinCnt, is the number of races out of the last six the dog has won; this is a measure of how well the dog has done recently. There are inconsistencies in this data. On row 28 in Figure 4-7 the data tells us the dog has won two out of its six most recent races, but Races for this dog is 0, meaning it has never been in a race. Modeling requires large amounts of data. In this example we have over 50,000 rows and before we are done we will wish we had more. Inconsistencies in data are a common problem. In this case some of the information, probably recorded by hand, is simply wrong. Our options are to eliminate suspicious rows or to use them. It is a judgment call, and in this case we will use what we have. The BestSpeed column is the lowest ratio for the dog in its last six races. PlacePay is the amount the dog paid as a place bet. A place bet pays if the dog comes in first or second, so there are two paid amounts in each race. In the first race a $2.00 bet on dog 3 paid $3.80 and on dog 8 it paid $7.20. Figure 4-7. Historical racing data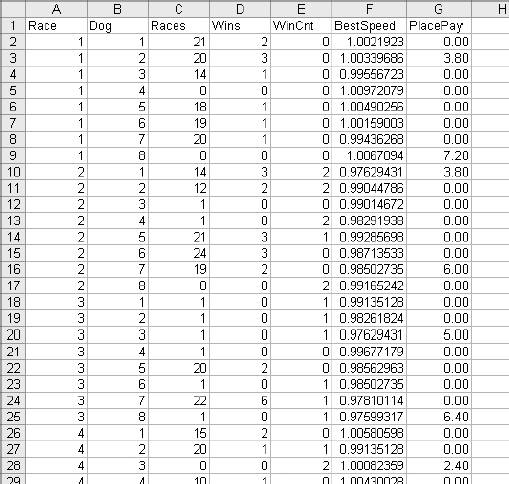 The problem is now defined: to predict the amount that a place bet will pay using the available data. Our model is a success if it results in an average payout above $2.00. |
EAN: 2147483647
Pages: 101