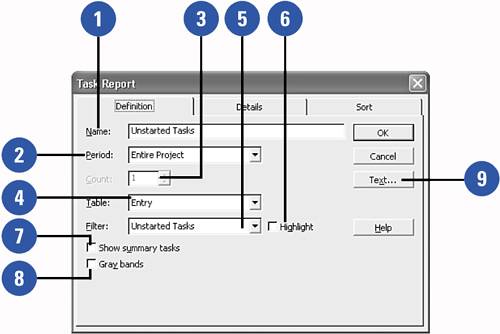
The Report Definition Tab

     
graphics/one_icon.jpg The Name field holds the name of the report. Edit this if you want the name to appear differently in both the menu and in the header of the report itself.

graphics/two_icon.jpg The Period setting defines how the report should be grouped. If you pick Entire Project (the default for most reports ), you will see the data for the report in a single grouping. If you pick Weeks, for example, you will see the data grouped by weekly period.

graphics/three_icon.jpg The Count setting defines how many of the periods should be included in each group . The default value is 1. If you choose a value of 2, for example, each grouping would contain the data for two periods.

graphics/four_icon.jpg The Table setting defines which table the report should use. This means that the report will contain the fields in the specified table. If you want to edit the fields visible in a report, you must edit the table that the report uses or create a new table and then edit the report to use this new table. The topic of creating tables is covered in Chapter 8, starting with the task "Creating a New Table."

graphics/12inf16.jpg

graphics/five_icon.jpg The Filter setting allows you to specify that a report only contain certain tasks or resources. The filter specified here is what defines which tasks or resources will appear in the report.

graphics/six_icon.jpg The Highlight check box defines whether the filter should hide items that do not meet the filter criteria, or simply highlight the items that do meet the criteria.

graphics/seven_icon.jpg Check the Show Summary Tasks check box if you want the report to show summary tasks.

graphics/eight_icon.jpg The Gray Bands option allows you to have the report highlight every other row of the report with a gray background. This can make reports with large numbers of rows easier to read.

graphics/nine_icon.jpg The Text button allows you to edit the font, style, size , and color of the text in your report.

For Your Information

Tables and Filters in Reports

If you edit the table or filter defined for a report, you have also edited that table or filter as it is used in other reports or views. If a report uses a table or filter that is also used in other reports or views, you might want to make a copy of that table/filter rather than edit it. Then you can edit the report to use the new copy that you have edited, rather than editing the original.


Show Me. Microsoft Office Project 2003
Show Me Microsoft Office Project 2003
ISBN: 0789730693
EAN: 2147483647
Year: 2003
Pages: 204

flylib.com © 2008-2017.
If you may any questions please contact us: flylib@qtcs.net