Monitoring and Controlling Execution of Threads
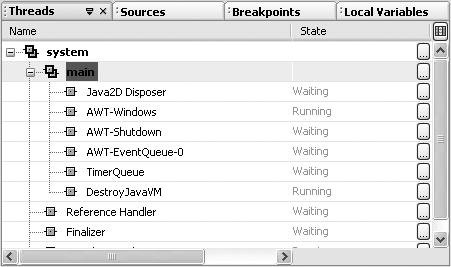
| The IDE's Threads window (Alt-Shift-7), shown in Figure 7-8, enables you to view the status of threads in the currently debugged program. It also enables you to change the thread that is being monitored in other debugger windows (such as Call Stack and Local Variables) and to suspend individual threads. See Table 7-7 for a guide to the icons used in the Threads window. Figure 7-8. Threads window
Changing the current thread does not affect the way the program executes. Switching the Currently Monitored ThreadThe contents of the Call Stack and Local Variables windows are dependent on the thread being currently monitored in the debugger (otherwise known as the current thread). To switch the currently monitored thread:
Suspending a Single ThreadBy default, when your program hits a breakpoint, all threads are suspended. However, you can also configure a breakpoint so that only its thread is suspended when the breakpoint is hit:
Isolating Debugging to a Single ThreadBy default, all threads in the application are executed in the debugger. If you would like to isolate the debugging so that only one thread is run in the debugger:
|
EAN: N/A
Pages: 279