Using Generator to Create Charts Another way to see the power of the predefined Generator objects is to take a look at Generator's charting capabilities. How many times have you labored over a complex chart, only to have your boss come back and say something like "That's not exactly what I wanted," or "The numbers have changed." With Generator, changing the content, appearance, or chart type is a simple and relatively painless process. One good reason to work with the charts is that they take advantage of a large number of the settings used with Generator objects. You already know how to change the settings for symbols and tickers. After you figure out how to use the settings for a chart, using the rest of the objects is a snap. Start by taking a look at pie charts. They are notoriously painful to create in Flash especially if they ever have to be updated. Generator takes the pain out of pie charts. The Pie Chart settings are as follows : -
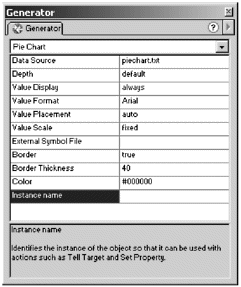
Depth. You can give your pie chart a 3-D effect by adding depth to the chart along the Z axis. The units are in 1/20 of a pixel. Thus, to give your chart a depth of 5 pixels, you need to set a depth of 100. -
Value Display. You can control how the value associated with each slice of the pie chart behaves. You can have the value show Always, Never, or Only on Rollover. -
Value Format. You get a whopping three choices for formatting the value: Arial, Times, or Courier. If you need something a little more exciting, check out the External Symbol File option below. -
Value Placement. If you choose to have the value show, you can control where it is placed. Your options are Auto, Inside, and Outside. If you choose Auto, Generator tries to fit the value inside the pie slice. If the pie slice is too small, the value is placed outside the pie. -
Value Scale. This controls the size at which the value is displayed. You can enter a value from 010, or you can choose from Fixed, Half, and Double. What do those values mean? Setting the scale to 0 makes your labels invisible. Setting the value to 10 gives you really huge labels. What are they relative to? I can't give you an exact answer for that. The value 1 seems to be roughly equivalent to a font size of 30. The value 10 is roughly 10 times the size that you get for 1. Fixed is equivalent to entering a value of 1. Half and Double seem to use the value of 1 as their reference point. You're much better off using an external symbol file to determine your value size and formatting. -
External Symbol File. This is the path to an external Generator template that has the symbols and variables for the value. -
Border. You can elect to have a border, or not. The values are True or False. -
Border Thickness. This is the width of the border if Border is set to True. Once again, this is done in 1/20 of a pixel. -
Color . This is the color of the border. It can be a Web-safe color name or a hexadecimal value. -
Instance Name. When you start to use ActionScript, you'll discover that you need to give unique names to the objects on the Stage to control them. That unique name is the Instance name. Pie Chart data sources don't use the simple name/value pairs that you used with the Generator variables you added to your ad banner earlier. For a pie chart, you need two columns of datathe value and the color. However, you are not limited to only those two columns. For each row of information, you also have the option of specifying a column for a URL to which the user is taken when he or she clicks a slice of the pie. Other columns include Goto and Gotolabel. The optional Goto column specifies the frame number in the Flash movie to which a user is taken when clicking a slice, and the Gotolabel column specifies the labeled keyframe to which the movie goes when the user clicks a slice. Exercise 4.15 Creating a Pie Chart Pie charts are unbelievably easy to create with Flash and Generator. What used to be a multihour task now can be accomplished in under a minuteafter you know what you're doing. -
Create a new movie. Save your new movie as piechart.fla. -
Drag a copy of the Pie Chart object from the Generator Objects palette onto the Stage. Use the Scale tool to increase the size of the Pie Chart object so that it is easier to see. -
On the Generator panel, enter a data source name of piechart.txt. (See Figure 4.25.) This is new. Up until this point, you've been adding the path to the data source in the Set Environment dialog box. You can have a unique data source for many of the Generator objects that you can place on the Stage. Figure 4.25. The Generator panel for the Pie Chart object.  -
Open your text editor of choice and type the following: value, color 3, red 2, blue 3, green 2, yellow 4, orange Note Remember that you can use either the Web-safe color names or the hexadecimal values in a data source. If you use the hexadecimal values, you must precede each with a pound (#) sign. -
Leave the rest of the settings with their default values. Save the text file as piechart.txt in the same folder in which you have piechart.fla. -
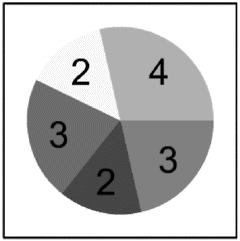
Test your movie. You should see a very simple pie chart with five slices. The chart is inside a black bounding box and the values are displayed on the pie slices. (See Figure 4.26.) Next you'll change several of the settings in the Generator panel to give your pie chart a more professional appearance. Figure 4.26. This is your first Generator pie chart. This is just the generic version; wait until you see what you can do with just a few changes to the settings.  Exercise 4.16 Changing the Pie Chart Settings By changing a few settings in the Generator panel, you can significantly alter the appearance of your pie chart. In this exercise, you give the chart a 3-D appearance, make the values for the slices appear only on rollover, move the values outside the pie chart, scale the values, and change the border color. -
Select the Pie Chart object in piechart.fla and open the Generator panel (Window > Panels > Generator) if it is not already open. -
Change the Depth setting for the pie chart from default to 100. Each unit is 1/20 of a pixel, so this gives your chart a depth of 5 pixels. -
Value Display, Value Placement, and Value Scale all have preset values from which you can select. When you click a setting that has preset values, the Value field changes to a drop-down list. Make the following changes for the pie chart: Value Display: Rollover Value Placement: Outside Value Scale: Half -
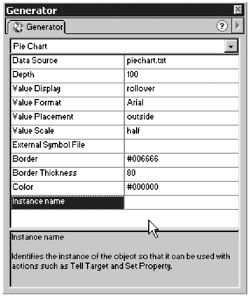
Change the color of the border to #006666 and change the border width to 80. (See Figure 4.27.) Figure 4.27. The Generator panel for the Pie Chart object with its new settings.  -
Before you test your new settings, open your data source, piechart.txt, and change the color settings to hexadecimal values. Add a third column, URL, and add the following valid URLs: value, color, URL 3, #99cccc, http://www.figleaf.com/ 2, #669999, http://www.macromedia.com/ 3, #ccccff, http://www.newriders.com/ 2, #ccffff, http://exchange.macromedia.com/ 4, #99ffcc, http://www.weather.com/ -
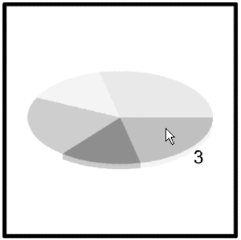
Save your data source and test your movie. (See Figure 4.28.) Figure 4.28. A new and improved pie chart after it is processed by Generator.  That's a significant change from your first pie chart. You now have a shaded, 3-D pie chart. Click one of the slices of the pie, and a browser launches and links to the appropriate URL. The one thing that the Pie Chart object does not produce for you is a key, so if you need a key, you have to add that in separately. Using an External Symbol File to Format Values Using the Value Format setting gives you very little control over how the values for the pie chart display. You're limited to three fonts (Arial, Times, Courier) and to black as a font color. In some cases, this might be sufficient. In many cases, however, it won't be. You can get around this limitation by using an external symbol file to format your values. External symbol files are simply Generator templates with special symbols in the Library that have formatted text variables in them. You can use these to format chart labels and values. To format the values for a pie chart, you need to create a symbol with the name chartValue1. Inside the chartValue1 symbol, you create a text variable {value}. Whatever formatting you apply to this text variable is carried over to the values for your pie chart. Exercise 4.17 Creating and Linking an External Symbol File In this exercise, you create an external symbol file to format the value and link it to your pie chart. -
Create a new movie. In the Formats tab of the Publish Settings dialog box, turn on Generator Template. Save the file as symbols.fla. -
Create a new symbol (Insert > New Symbol). Name the symbol chartValue1 and give it Graphic behavior. -
Select the Text tool and open the Characters panel. Change the following settings: Font: Verdana Font Size: 20 Color: #0000cc -
With the Text tool still selected, create a text variable {value} and center it on the Stage. -
Save your file and either publish or test your movie to generate the template (swt) file. You can close the file after you've published it. -
Open piechart.fla if it isn't still open. Select the Pie Chart object on the Stage and open the Generator panel. -
Type symbols.swt for the External Symbol File setting. -
Change the Value Scale to Fixed if you want your values to have the font size you selected when you created the external symbol file. -
Save your file as piechart2.fla and test your movie. Now when you mouse over the pie chart, the values should display in the color, font, and size that you created in the external symbol file.  |


