Test Analysis and Tuning Process
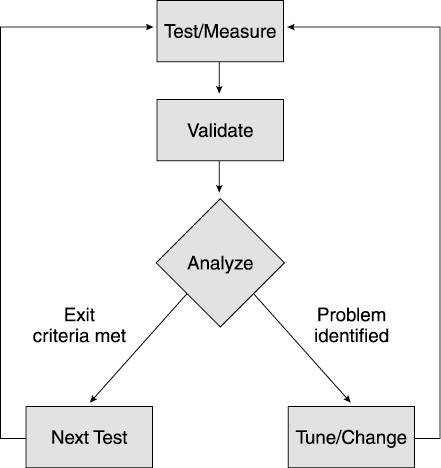
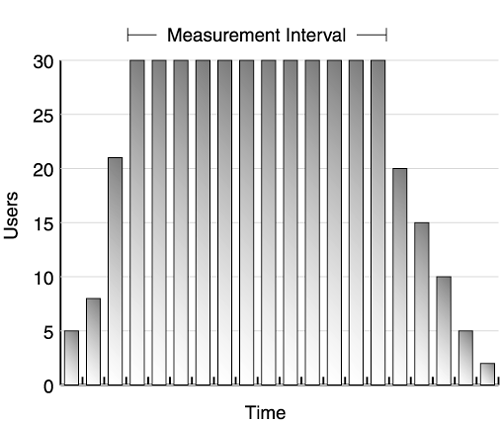
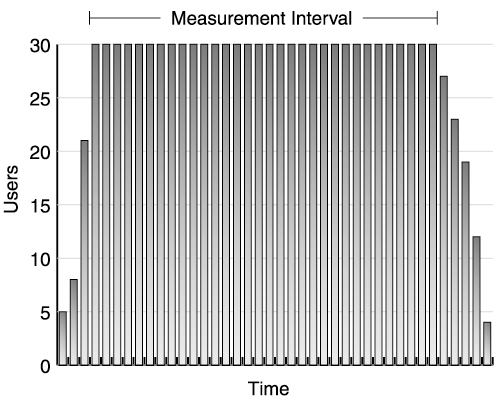
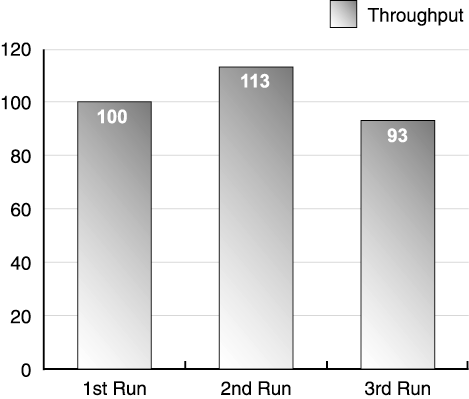
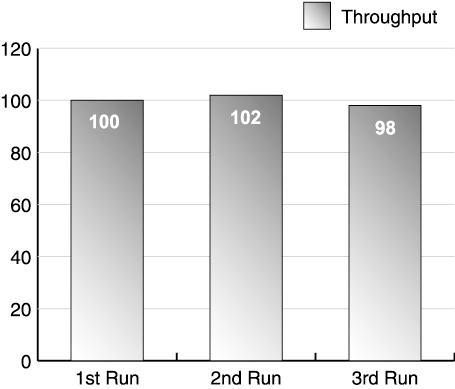
| The success of the test depends on your ability to accurately collect data, analyze performance measurements, and make tuning changes. Each step in this iterative process follows the same basic flow shown in Figure 11.1. The first step in the process is executing a performance test. For example, run a test scenario against your web application simulating 100 clients against a single four-way server. During this test, capture data about your test clients , application servers, and other components used in the test. After completing the test run, analyze the data collected before proceeding to the next test. Figure 11.1. Iterative test and tuning process Here's where your performance preparation pays off: After obtaining run data, review the objectives for this part of your test. If the test shows you've met the performance criteria for that test, move on to other tests. If not, it's time to analyze the results more carefully and make tuning adjustments. Keep in mind that all systems contain bottlenecks. However, you only need to address bottlenecks if they prevent you from reaching your targets. As we said earlier, without targets, you never know when to stop tuning. You may iterate through the test, measure, and tune process many times per test until you reach your performance goals. Let's discuss the steps of this process in more detail. Test and MeasureThroughout the first portion of the book, we have emphasized the importance of reliable, reproducible results. Now it's time to determine if your system really generates repeatable results. Especially during your initial testing, never take a single test run at face value. Instead, run the same test at least three times without making any changes , and compare the results. Before the run, reset the environment to the same state. After the test begins, let it run for 1015 minutes at steady state before stopping. Later you may want to run longer tests to simulate a full day's activities against the web site, but for now use shorter tests as you tune the various parts of the web site. After you perform multiple runs, look at the results: Did each run produce roughly the same results? If the answer is yes, proceed with tuning if required. If not, check the validation section below for some guidelines on resolving run variation. Most test tools generate a report after each test run, giving you information on throughput and response time achieved by the test. The size and complexity of the report usually depends on the sophistication of the tool and the size of the test (number of virtual users, test iterations, test machines, and so on). Appendix D provides a sample worksheet to record key data reported by your performance test tool. Keep this data at least until you complete your performance testing. You need this data for comparison against future tests and to establish trends in your testing. Designate an archive machine with sufficient disk space to hold the data generated by your test, and use a naming convention to coordinate this data with the appropriate test run. As we discussed in Chapter 8, test tools differ in how they measure a given test run. Some tools include the entire test run in their calculation of throughput and response time. Other tools allow you to pick an interval during the run for your measurements. If your tool allows you to pick, choose an interval during the test's steady state. As shown in Figure 11.2, omit any ramp-up or ramp-down of users, as these tend to skew the response time and throughput of the system. Instead, pick the interval after ramp-up when all virtual users are running against the system. Figure 11.2. Test run measurement interval Less sophisticated test tools use all data points in their calculations of throughput and response time for the run. If you cannot control how the tool measures the run, shift your focus to modifying the run to give you better data. For these tools, increase the duration of your test run. By increasing the length of the run relative to the ramp-up and ramp-down time, as shown in Figure 11.3, you reduce the impact of these phases of the test on your results. Figure 11.3. Measuring over long runs to simulate steady state In addition to the throughput and response time measurements collected by the test tool, also record CPU utilization from each of the servers, as well as all the tuning parameters adjusted for the run. Appendix D includes a worksheet for common tuning parameters. See Chapter 12 for information on collecting and interpreting CPU utilization data. ValidateAnother aspect of a successful test process is the results validation step. This includes checking whether measurements make sense, as well as checking that no errors occurred. Develop a checklist to use for validation (a sample validation checklist is provided in Appendix D). To ensure accurate tests, use both the tester and an independent test team member to validate the results. Make sure that at least two team members review all measurements. Do not expect exactly the same throughput and response time for each test. Some run-to-run variation is normal. In Chapter 7, we expended a lot of effort on making our test scripts somewhat random to avoid artificial caching situations. This means each run executes a slightly different path through the code, and hits different rows of the database. Also, because the web application runs inside a JVM, garbage collection also slightly impacts our run-to-run data. We look for excessive variation between test runs. As a rule of thumb, we expect run-to-run variation to remain less than 4%. [1] Remember, if you experience high variation between runs, you cannot establish a cause-and-effect relationship between tuning changes and your test results. For example, Figure 11.4 shows the results of three test runs. Notice that the second run produced 13% higher throughput than the first run and 22% higher throughput than the third run. Assume we make a tuning change and take a fourth test run. If the results show a 22% improvement, we cannot fully attribute this to the tuning change. After all, without the change, we saw the same throughput during our second run.
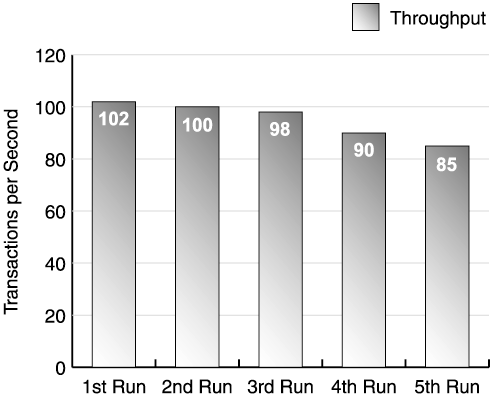
Figure 11.4. Example of high run-to-run variation Instead, your test needs to produce results closer to those shown in Figure 11.5. In Figure 11.5, the second run still produces the best results; however, the difference between runs falls in the 2%4% range. Also, we don't see a trend in these numbers . The second run gave us the best throughput; the third run produces the worst. From just these three figures, we don't see the three tests becoming progressively faster or slower. Figure 11.5. Example of acceptable run-to-run variation In contrast, Figure 11.6 shows a set of three runs with a downward trend. As this figure also shows, additional runs continue the trend, requiring additional investigation. See the subsection entitled What Can Go Wrong? later in this section for possible causes. If additional runs do not continue the trend, the variance is most likely just normal environmental variation. Figure 11.6. Example of run variation with a downward trend Beyond run consistency, check the following items after every test:
What Can Go Wrong?If your test environment produces too much variation, correct this before beginning your performance tests. Some common contributors to run-to-run variation include the following. Shared EnvironmentOther activity on your servers or the network often impacts the results of your test. Two examples of this are the following:
Short RunsDespite time pressures, give your tests sufficient runtime to smooth out variance. For example, if you only run your test for a minute, the results might vary significantly if a garbage collection cycle starts during the second run but not the first. Experiment with your test runs to find your best runtime. As we mentioned before, 10 to 15 minutes of steady-state runtime usually suffices. Database GrowthYour application probably creates and updates rows in a database during the test. The web application may register new users, thereby creating new rows in the user table. As database tables grow significantly, database queries take longer. In addition, a database query, such as a search, might return more data as the table size increases . (For example, the database processing and network transfer time for 500 database records exceeds that of only 50 records.) Database growth sometimes causes performance to degrade over a series of runs. If your test artificially inflates the new records created in the database, consider using a script to reset the database between performance runs. This allows you to take consistent measurements across multiple tests. However, if your test mimics production conditions, work with the DBA to manage the data growth over time. Since the web site faces the same problem in production, you need a solution to the larger problem, not a quick fix to make your testing neater. Tuning the database or changing the application is in order. Too Much Variation in Workload SimulationAs we discussed in Chapter 7, your performance scripts need dynamic data and a certain amount of random variation to effectively test your site. However, extreme random simulation in your scripts makes it difficult to obtain consistent test runs. If you set up your workload simulation for a target mix of 90% browse and 10% buy, you get approximately 90% browse and 10% buy on each run, but not exactly this mix. You might get 89% browse and 11% buy on one run, and slightly more browse than buy on the run after that. This is probably an acceptable variation on the mix. However, too much variability gives you wide swings in your results. For example, 20% buy on the first run and 10% buy on the second run most likely leads to incomparable results. Double-check that your test scripts generate the correct activity mix and random data selection. Also, running your scripts for several minutes usually results in more consistent activity mixes between tests. AnalyzeAfter confirming the consistency of your measurements, it's time to analyze the data captured during the test. This may seem a little obvious, but nevertheless it bears saying: Look at the data before tuning the system. As part of your analysis, review the data against the test plan targets. If the performance meets your targets, move on to the next test. Otherwise , look further at the data to identify your bottlenecks, and make tuning adjustments accordingly . After making the adjustments, run the test again, and repeat the analysis process. The specifics of the analyses performed change depending on the phase of your test plan being executed, but the basic process for successful analysis does not change. These steps include comparing your results to
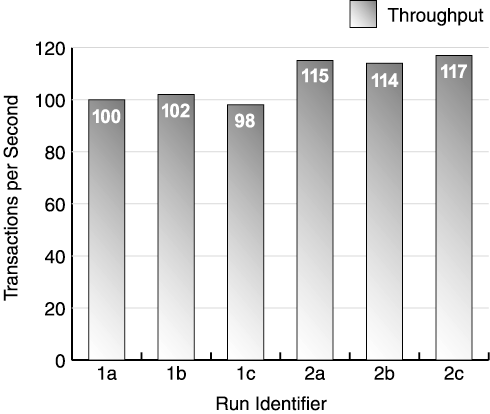
Chapter 1 discussed the expected relationships between load, throughput, and response time. In the analysis step, compare the throughput and response time results from the new runs with previous results at different client loads. As an example, let's assume you hit a throughput plateau at 100 users. You've tested 150 users, and saw response time increase, but throughput remains constant, which confirms your conclusion about the plateau. Now you've run a 200 user test. If you've reached a "throughput plateau," the throughput doesn't vary significantly between the 100 and 200 user load test, but the response time probably doubled . Of course, look for inconsistencies. If the throughput suddenly increased, or the response time improved between the 100 and 200 user test, you might want to run your 100 user test again. Perhaps the test ran in error originally. Or maybe something changed during the 200 user test. In any case, look for predictable patterns in your data. In the analysis step, also compare the results to exit criteria from your test plan (more discussion on exit criteria appears in the Test Phases section later). When the analysis indicates you're not getting the desired performance results, you apply the steps to identify and correct any performance bottlenecks, introduce the required change, and repeat the test measurements. TuneIdeally, when you tune, you should make only one tuning adjustment per test iteration. That is, make a tuning adjustment, run another complete test iteration, and analyze the data before making another adjustment. This allows you to isolate which tuning adjustments actually improved performance, as well as which changes made little difference or actually made things worse . The success of the tuning process is very dependent on your measurement process. Figure 11.7 shows the "before and after" results of applying tuning changes to a system. The first set of runs (1a, 1b, 1c) all show throughput between 98 and 102 transactions per second. After tuning, the second set of runs (2a, 2b, 2c) all show throughput between 114 and 117 transactions per second. Because the run variation remains low, the results clearly show that the tuning changes resulted in positive performance improvements. Figure 11.7. Results after introducing a change Again, keep your tuning changes between runs to a minimum. Make only one tuning adjustment per test iteration; otherwise you encounter one of the following situations:
Clearly, you need to understand the impact of each change, so take your time, introduce a change, and complete an iteration to measure and analyze the change's impact. |
EAN: 2147483647
Pages: 126
