Locating Performance or Scalability Problems
|
|
| Important | Only if we are sure that there is a performance problem - as the result of benchmarking a vertical slice or a whole application - should we devote resources to tracking down problem areas. |
It's important that the process of finding problems is empirical. While experience and knowledge help to develop strong instincts, there is no substitute for hard evidence.
Let's look at two basic techniques we can use to establish where in a J2EE stack a known performance or scalability problem lies:
-
Try to test the performance of each tier of the architecture in isolation, or without going through higher architectural tiers.
-
Test the entire application using a profiling tool.
Testing in Layers
Good design should enable us to test each architectural tier of a J2EE application independently. Good design will ensure that the application is divided into distinct tiers with distinct responsibilities. Such layered testing will be impossible, for example, if JSP pages perform database access.
This enables us to perform tests such as the following (beginning at the lowest level of a typical application):
-
Test RDBMS queries and updates using database tools. This should involve testing the behavior of concurrent activity in separate transactions.
-
Test JDBC operations by testing Data-Access Objects with a test data source, outside a J2EE application server.
-
Test business object performance. Business objects may be tested in isolation (using mock objects in place of components used for connecting to resources such as databases) and with the real application backend.
-
Test web-tier performance using dummy business objects that respond instantly with test data, enabling us to see web-tier performance in isolation.
Where EJBs are involved, such testing will be harder; we may need to run tests within the application server.
Note that we will normally have test cases for most of these layers as the result of sound development practice. Thus, writing performance and load tests should not require much additional infrastructure, beyond one of the tools discussed above. It's good practice to write and run performance and load tests along with functional tests during application development, to identify potential problems before they can pose serious risk.
This layered approach is particularly useful where load testing is involved, as it makes it very easy to test how any architectural layer performs under load.
Profiling Tools
We can also use tools, rather than our own effort, to establish where the application spends its time. Although this is not a substitute for "layered testing" - especially where throughput is concerned - it can provide hard evidence to replace hunches regarding bottlenecks, potentially saving wasted effort. Profiling can also clarify an application's run-time behavior, through revealing call stacks.
However, there are some problems with profiling that we must be aware of:
-
Profiling severely reduces application performance and sometimes stability. Thus, we may not be able to perform load testing against an application running under a profiler and may be limited to looking at the performance of individual requests. Thus, profiling may not be much help in tracking down scalability problems such as locking (although other specialized tools may help in this area).
-
Profiling may require JVM settings to be changed from those used in production, which can sometimes produce anomalous results. For example, we may need to disable the optimized HotSpot JVM.
JVM Profiling Options
Most JVMs offer a profiling option. For example, starting a Sun Java 1.3 JVM with the following arguments will cause it to dump profile output when it quits:
-Xrunhprof:cpu=samples,thread=y
The most useful information is contained in the final section of the generated java.hprof.txt file, which shows methods ordered by the time they took for execution. It also shows the number of invocations of each method:
rank self accum count trace method 1 26.67% 26.67% 12 57 java.net.SocketlnputStream.socketRead 2 11.11% 37.78% 5 107 java.net.SocketlnputStream.socketRead 3 4.44% 42.22% 2 83 oracle.jdbc.driver.OracleConnection.privateCreateStatement 4 4.44% 46.67% 2 32 java.io.Win32FileSystem.getBooleanAttributes 5 2.22% 48.89% 1 114 java.net.PlainSocketlmpl.socketClose 6 2.22% 51.11% 1 130 java.lang.System.currentTimeMillis 7 2.22% 53.33% 1 43 java.net.lnetAddresslmpl.getLocalHostName 8 2.22% 55.56% 1 34 oracle.jdbc.ttc7.TTC7Protocol.connect 9 2.22% 57.78% 1 17 com.interface21.beans.BeanWrapperlmpl.setPropertyValues 10 2.22% 60.00% 1 122 java.lang.ClassLoader.findBootstrapClass 11 2.22% 62.22% 1 87 java.lang.Class.forName0 12 2.22% 64.44% 1 79 oracle.security.o3logon.O3LoginClientHelper.<init> 13 2.22% 66.67% 1 47 java.lang.Throwable.filllnStackTrace 14 2.22% 68.89% 1 77 oracle.jdbc.ttc7.TTC7Protocol.logon
Several free tools can be used to view profiler output files and extract more information about call stacks.
I've successfully used JVM profiling in the past, but it's a very basic solution. It slows applications to a crawl and can cause frequent crashes. For example, JDK 1.3.1_02 seems to have problems starting JBoss 3.0.0 with profiling enabled on Windows, and I've previously had severe problems getting JDK 1.2 profiling working on Solaris.
If you have a real need for profiling, you need something more sophisticated. I don't know of any really satisfactory free or open source products; given the cost of performance problems to projects, a small investment in a commercial product is well worthwhile.
The JProbe Profiler
Sitraka's JProbe (http://www.sitraka.com/software/jprobe/) is the best-known commercial profiler, and has led the market for several years. JProbe isn't the only choice, but it's very good and not overpriced. It's possible to download a free evaluation copy that will work for 10 days - long enough to establish whether it's likely to be a wise investment for a project. The JProbe suite contains several products. I'll only talk about the profiler here.
| Note | In this section we'll focus on JProbe 4.0, but most of the concepts discussed will apply to any profiler. |
Using JProbe requires first configuring JProbe to run the application with the necessary instrumentation. For server-side applications, the "application" from JProbe's perspective is the J2EE application server, running user applications. While the application is running, JProbe can take "performance snapshots" for immediate or offline analysis.
Integrating JProbe with an Application Server
The JProbe 4.0 distribution comes with settings to integrate it with most commercial application Servers. However, I had to manually integrate it with JBoss 3.0, which took a few minutes.
The JProbe installation process prompts to integrate JProbe with a J2EE server via the "JProbe Application Server Integration" dialog. Any of the supported servers can be selected in the dropdown on the left. To integrate with a new server, such as JBoss 3.0, follow the following steps:
-
Select_Other Server from the dropdown.
-
Press the Create button.
-
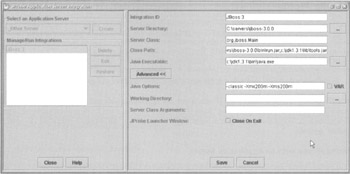
Customize the settings in the right-hand pane, including setting Advanced Options. This includes setting the IntegrationID to a meaningful name (such as JBoss).
The most important settings in the right-hand pane are:
-
Server directory. This is normally the home directory of the server.
-
The server class. The Java class that contains the server's main() method.
-
The server classpath. JBoss uses a minimal "bootstrap" classpath and loads further binaries from within its directory structure, so this is very simple to configure for JBoss.
-
The JVM executable to use.
-
The JVM arguments. It took some experimentation here to arrive at the "Java options" shown below, which were based on the WebLogic integration parameters supplied with JProbe. Without setting the heap size, startup was too slow and JBoss often hung on startup.
The appropriate value for most of these settings can be found in the default JBoss startup script: $JBOSS_HOME/bin/run.sh or $JBOSS_HOME/bin/run.bat, depending on your operating system. The following screenshot displays the JProbe integration settings I used for JBoss 3.0:
One JProbe installation can use integration definitions for multiple J2EE servers.
Setting Filters
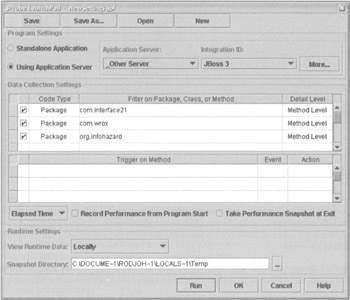
It's also essential to configure settings for each JProbe analysis "session". This determines which application server integration definition will be used, what the profiler will look for, and how the profile data will be collected and viewed. Settings can be defined via the Open Settings option on the main JProbe window. Multiple settings can be defined, allowing choice of the most appropriate definition for a particular profile run.
The most important setting is the packages to filter, shown in the central pane of the dialog opposite. We don't normally want performance information for application server or standard Java or J2EE packages (although this might be useful if we suspected that a performance problem lay outside our own code). Thus we normally filter to restrict profile information to our own classes. Activate filtering by specifying package prefixes and selecting a Detail Level for each from the right column. Note that information will be collected for all packages whose names begin with the given string: for example, specifying com.wrox as the screenshot will result in the collection of profile data for all packages in our sample application.
I found it useful to uncheck Record Performance from Program Start. We don't usually want to slow down application server startup by profiling it. The following screenshot shows the session definition I used for the profile runs in this chapter:
Running J Probe on Sample Application Use Cases
Now we're ready to start a profile run. First we need to start JBoss running under JProbe. We do this from the main JProbe Profiler window, through the Program menu, as shown below:
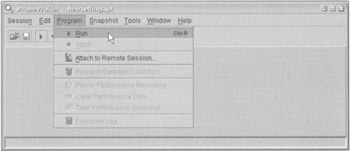
Assuming that our application has been deployed on JBoss, when JBoss starts up, it will start as usual. Note that JBoss will take much longer than usual to start up and to deploy our application, so a little patience (or a very fast machine) is required. Monitor the JBoss and application-generated log files and CPU usage to ascertain when the application has started up. It's a good time to make or buy a coffee.
Now it's time to start recording performance data. We do this by selecting Resume Performance Recording from the Program menu as shown below:
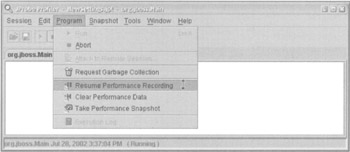
Now we execute the application use case we wish to profile. Again, this will take much longer than usual. When the use case is complete, we select Take Performance Snapshot from the same menu. A new snapshot icon will appear in the main JProbe window: the default name is snapshot_1, but we can rename it on saving it. Saving it makes it available for use in the future, independent of whether we're running the profiler to collect new data.
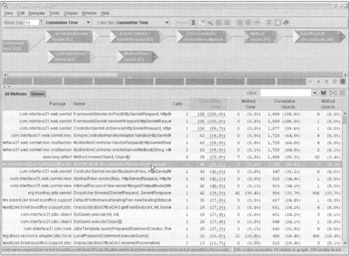
We can right-click on any snapshot and select Open in Call Graph. We will see a window like the following, which displays methods ordered in descending order by cumulative execution time (the time they and their subtrees took to execute):
The following screenshot shows the same data, ordered in descending order by method time (the time taken within each method):
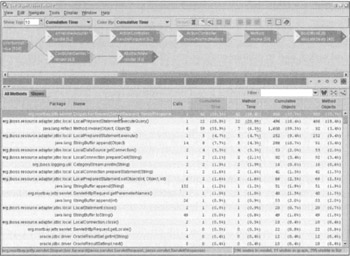
The "call graph" in the upper pane isn't very useful in this example, but can be useful for providing a color-coded display of bottlenecks and allowing easy navigation of data.
For each method, we can quickly get a display of what methods invoke it, what methods it invokes, and how its execution time breaks down.
For example, by double-clicking on BoxOfficeEJB.allocateSeats, which JProbe indicates to have cost 45% of our execution time, we see the following information (the allocateSeats() method is always invoked reflectively by Method.invoke() because JBoss uses dynamic proxies instead of generated classes to implement EJB component interfaces):
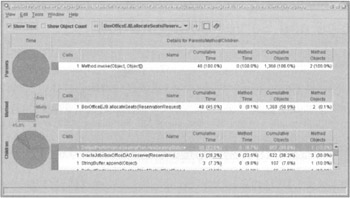
In this case, this is very interesting. It shows that the stored procedure invoked by the OracleJdbcBoxOfficeDAO.reserve() method is faster than the select for update to check for available seats (possibly because the select is against a view based on an outer join). We discussed the data access code running here in Chapter 9.
Select Clear Performance Data from the Program menu before following the same procedure to profile another use case.
Snapshots can be saved for future use. This is very handy to separate the collection of data from analysis (two very different tasks), and to enable comparison of progress in addressing a problem through design and code changes.
We'll look at usingJProbe while addressing a real performance issue a little later.
| Important | A good profiling tool such as JProbe can be invaluable, enabling us to base designs on evidence, rather than gut feeling. Sophisticated profiling tools can also quickly reveal useful information about an application's runtime call stack. Even if there's no great performance problem, it's a good idea to run a single profile run on each use case, to ensure that there's no wasteful activity - for example, in unnecessary string manipulation methods, which will be obvious from a profile run. It's important, however, to avoid obsession with profiling. It's tempting to use repeated profiler runs to achieve smaller and smaller performance savings. This is a waste of time, once any major issues have been addressed. |
|
|
EAN: 2147483647
Pages: 183