| We have created a reference that is comprehensive enough for hardcore analysts, yet relevant to casual users of Excel. The bulk of the book will cover how to use pivot tables in the Excel user interface. The final chapter includes information on how to create pivot tables in Excel's powerful VBA macro language. This means that any user who has a firm grasp of the basics (preparing data, copying, pasting, entering simple formulas) should have no problem understanding the concepts in this book. CASE STUDY: Life Before Pivot Tables Imagine that it is 1992. You are using Lotus 1-2-3 or Excel 4. You have 40,000 rows of transactional data, as shown in Figure I.1. Your manager asks you to prepare a summary report showing revenue by region and model. Figure I.1. As a financial analyst in 1992, your job is to produce a summary from this 40,000 row dataset. 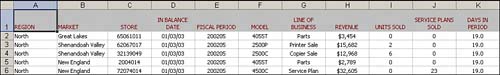
In 1992, this was a daunting task. It required superhuman spreadsheet skills that few could master. Here are the steps you would need to take: 1. | You need to get a list of the unique regions in the dataset. Use the Advanced Filter command with Unique Records Only (see Figure I.2) to extract a list of the unique regions.
Figure I.2. Even today, the Advanced Filter command is not a lot of fun to use. 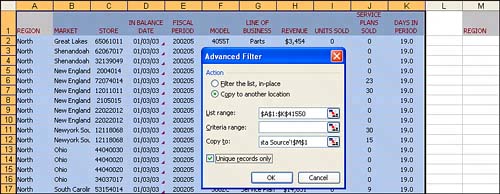
| 2. | You need to get a list of the unique models in the dataset. Do a second Advanced Filter with Unique Records Only to extract a list of the unique models.
| 3. | You need to turn the list of models sideways so that it runs across the columns. Copy the list of unique models. Then, do a Edit, Paste Special, Transpose to arrange the models as headings going across the report. You now have a skeleton of the report, as shown in Figure I.3.
Figure I.3. After a second Advanced Filter command and Edit, Paste Special, Transpose, you have this skeleton of the final report. There is still a long way to go. 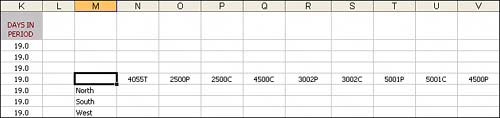
| 4. | The DSUM function could be used to total a column based on one criteria, but not based on two criteria. Therefore, you need to abandon typical functions and instead rely on an array formula. Before entering the array formula, set up two fields above the report to hold a sample region and a sample model.
| 5. | In the corner cell of the report, build an array formula to test whether the region column is North and the Model column is 4055T, and if so, add up the corresponding row from the Revenue column. After typing this formula, remember to press Ctrl+Shift+Enter or else the formula will not work. The formula is shown in the formula bar in Figure I.4.
Figure I.4. With the array formula in the corner of the report, you are ready to use the not-so-intuitive Data Table 2 command. 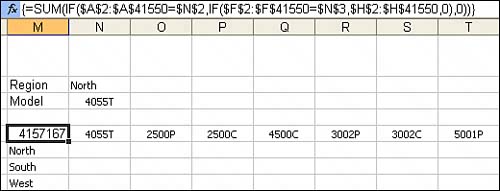
TIP For a complete explanation of two-condition sums using array formulas, see http://www.MrExcel.com/tip031.shtml. | 6. | You know you're a hardcore data analyst if you can still imagine hitting the keystrokes for /Data Table 2 in Lotus 1-2-3. Figure I.5 shows the equivalent function in Excel. The Table command on the Data menu will allow you to set up a table.
Figure I.5. The Data Table command replicates the formula in the top-left corner of the table, but replaces two references in the formula with the headings at the top and left of the report. 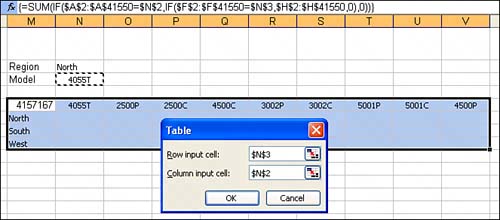
| 7. | Finally, after using two advanced filters, a Paste Special, writing the hardest formula in the world, and then using the Data Table command, you have the result your manager is looking for, as shown in Figure I.6. If you could pull this analysis off in 10 minutes, you were doing an amazing job.
Figure I.6. After 10 minutes displaying knowledge of obscure spreadsheet commands, you have produced the needed report. 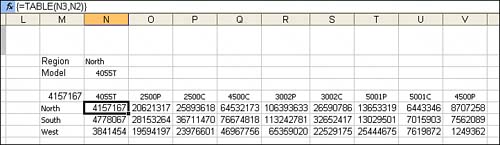
|
Now, if your manager takes a look at the report and asks you to add Market to the analysis, you are nearly back at square one and are looking at an additional 15 minutes to produce the new report. |