Defining and Implementing Monitoring Standards for a Physical Server
The primary goal for monitoring SQL Server 2005 is to establish its level of performance by gathering various metrics. Because of the complexity of a client/server architecture, the nature of a concurrent system, and the various components involved in a database solution, it is virtually impossible to guarantee a level of performance otherwise. It also makes it difficult to work out whether a bottleneck exits, because few performance object counter values mean anything by themselves.
Luckily, SQL Server 2005 offers a large range of tools and commands to enable you to easily gather various metrics. The trick, of course, is knowing what to gather! (And you want to understand the results so you can draw the correct conclusions.)
Nevertheless, you need to go through the process of defining your performance monitoring standards before implementing them.
Generally speaking, you’re trying to achieve two performance goals with any relational database management system (RDBMS):
-
Fast response time
-
High throughput
Ultimately, these are subjective concepts, so it is important to liaise with the users of the system. There is no point in chasing bottlenecks, because any system will always have one.
| Note | When monitoring performance, it is important to know the theoretical limits of the various components of the system. You will not be able to get 100MB/s throughput on a 10MB network interface card (NIC)! |
When monitoring SQL Server performance, you can take two approaches: monitoring proactively and managing exceptions. Each of these strategies has advantages, and you should carefully consider your database environment before implementing one. Ideally, although this hardly ever happens in our experience because of time and resource constraints, you should adopt a proactive monitoring strategy.
Realistically, however, you’ll find that you’ll use both techniques as required.
Monitoring Proactively
Setting up a proactive monitoring solution requires more initial work but is ultimately worth the effort. For enterprise environments, where you typically have multiple SQL Server 2005 instances running, you can replicate this initial work across all instances. A proactive monitoring solution generally involves the following three steps:
-
Establish a baseline for performance.
-
Implement benchmarks.
-
Establish a performance monitoring solution. (This involves establishing the thresholds for performance.)
You get several advantages from setting up such a proactive monitoring solution:
-
You can identify performance trends and anticipate necessary configuration changes. The increase in user activity, disk space usage, and memory usage may require changes in your server configuration to accommodate the increased load.
Tip You can take advantage of SQL Server 2005’s dynamic configuration parameters to optimize performance. For example, you could allocate more processors to a particular SQL Server 2005 instance at the end of the week when you run computing-intensive batch operations.
-
You gain the ability to determine otherwise unknown performance problems by monitoring server components or database objects. For example, excessive query recompilations may indicate a need for performance improvement by query optimization. It is common for hardware to mask these sorts of problems until one day, when you least expect it, the system hits a threshold and performance degrades substantially because the hardware can no longer mask the problem.
-
You can troubleshoot and anticipate performance problems. Having components that run at near capacity (such as memory pressure) may not indicate an immediate problem but can raise your awareness to a potential problem that requires close monitoring.
-
You can make better long-term decisions regarding your database solution. Don’t forget that few metrics mean anything by themselves. By gathering performance metrics over a period of time, you empower the relevant stakeholders to make better decisions to guarantee any SLA in place.
This method also has a number of drawbacks, although they really have to do with more work for the DBA:
-
Proactive monitoring can be a time-consuming process, especially for a DBA responsible for many applications. This can be a serious problem, especially because the ratio between DBAs and SQL Server instances is typically very high.
-
It requires a deeper understanding of SQL Server’s client/server architecture and how the applications work with the database. This can be a particular problem when you have purchased a third-party application over which you have no control or any architectural understanding.
-
The information gathered needs to be reviewed on an ongoing basis.
Once you have done this hard work, your monitoring solution should become the standard for all of your SQL Server instances in the enterprise. Leverage the hard work, and make it worthwhile!
You’ll now take a closer look at the steps involved in creating a proactive monitoring solution, and we’ll make some recommendations as to what to monitor to get you started. However, don’t forget you will need to take into account your database environment.
Establishing a Baseline for Performance
The first step, establishing a performance baseline, consists of recording how your server behaves under normal conditions. You will use the baseline to identify initial problems, if any, and to serve as a comparison later in the ongoing monitoring process.
A simple method of building your baseline is to use the Performance Logs and Alerts tool or System Monitor. You typically start with a larger set of performance counters to get a good snapshot of the server’s state. Later, for the ongoing performance monitoring, you typically reduce the number of counters and increase the sampling interval.
SQL Server 2005 supports a massive list of performance counters for monitoring, and it is worth your while to become familiar with them in SQL Server 2005 Books Online.
| Note | SQL Server 2005 also supports user-defined counters through the SQLServer:User Settable performance object counters. For more information, search for the “SQL Server, User Settable Object” topic in SQL Server 2005 Books Online. |
In a short while, you will go through the performance object counters you should use to establish a baseline.
Implementing a Benchmark
The purpose of a benchmark is to measure the performance of your hardware and software in a controlled environment under a specific type of load. For a SQL Server 2005–based application, benchmarking will give you an idea of how your server will perform under various types of loads and usage. You can implement a benchmark in several ways:
-
Write custom Transact-SQL (T-SQL) scripts that reflect your typical SQL Server load. This can be a difficult process because it is tough to know how users will be working with your database solution.
-
Use the SQL Server Profiler to record database activity, and use the replay feature for simulating a load. This is superior to the previous technique because it should more typically reflect the usage patterns of your database solution. It is also much easier to do.
-
Use the load generation tools, such as those found in the SQL Server Resource Kit.
-
Use existing benchmarking software, such as those available from the Transaction Processing Council (TPC) or SAP.
| Note | Although it can be a somewhat esoteric exercise, it is still worth your while to visit the TPC’s website at http://www.tpc.org to see the various benchmarks and resources, such as the technical articles. |
You will usually get the best results from a custom benchmarking solution designed specifically for your application. Don’t forget to involve all stakeholders, including the developers and users, so you can get a better understanding of how your application should behave and ultimately set correct performance expectations for all concerned.
Establishing a Performance Monitoring Solution
Establishing a performance monitoring solution is similar to the baseline approach discussed previously. You typically use the same tool, Performance Logs and Alerts or System Monitor, but with a reduced set of performance object counters. A little later in the chapter we will go through the performance object counters you should use to establish thresholds for performance.
Typically you also increase the sampling interval to a higher value, depending on your particular requirements and database environment. For online transaction processing (OLTP) systems, your frequency could be several seconds, whereas in the case of a decision support system (DSS) environment, several minutes might be appropriate.
| Tip | Consider using a 36-second sampling rate to get a better coverage of the activity that your SQL Server 2005 instance is experiencing. Why 36 seconds? Think about it…. |
Another important component of a performance monitoring solution is implementing some form of an alerting solution. Fortunately, SQL Server 2005 comes with a pretty good alerting infrastructure, which we will cover toward the end of this chapter.
Define Which Types of Information to Monitor on the Physical Server
Modern software such as SQL Server 2005 and Windows 2003/Vista generate quite extensive information and metrics, typically automatically. Alternatively, they have repositories that can be periodically queried by various tools (such as Performance Logs and Alerts, System Monitor, and SQL Server Profiler), agents (SQL Server Management Pack for Microsoft Operations Manager [MOM]), or other third-party software (which we discuss in more detail in Chapter 5, “Designing a Strategy to Maintain a Database Solution”).
As part of your performance monitoring solution, you need to be aware of the different types of information available for monitoring on the physical server. We’ll now go through the various layers and components introduced earlier and show what your options are.
Hardware
Hardware vendors typically have all sorts of metrics that their technology gathers in the background that can be monitored. Some are based on industry standards, such as in the case of SMART for disk drives. Others are proprietary, as in the case of most RAID and SAN implementations.
Network
Analyzing the network traffic in a client/server might also be required in certain cases. You certainly want to ensure you do not saturate your network bandwidth. Windows does come with Network Monitor, but it is quite rudimentary. Again, a number of third-party solutions are available.
Operating System
The Windows operating system several repositories and other components that expose metrics that you can monitor:
-
Registry
-
Performance object counters
-
Event logs:
-
System, written to by the operating system
-
Application, written to by applications, such as SQL Server 2005
-
Security, written to by the Local Security Authority Subsystem Service (lsass.exe)
-
-
Windows Management Instrumentation (WMI)
The WMI in particular is a rich source of information about what is going on with your operating system. We will discuss the WMI in more detail later in this chapter.
SQL Server Database Engine
SQL Server 2005 has a number of sources of information that you can monitor:
-
Performance object counters
-
SQL Server error log
-
Default trace
-
DMVs
SQL Server Components
A number of SQL Server components have their own information and metrics that they expose:
-
SQL Server Agent error log
-
Performance object counters
-
DMVs
-
Replication tracer tokens
Microsoft has tried to make it easier for you to access some of this information. For example, replication has an extensive monitoring solution in SQL Server Management Studio (SSMS). Likewise, a database mirroring monitoring solution is available as well in SSMS.
Database
Monitoring information about your databases typically involves accessing the following:
-
Performance object counters
-
DMVs
-
DBCC commands
Client Application
This obviously depends on the application, but you also have the middle tier, such as the following:
-
ODBC log
-
ADO.NET tracing
With SQL Server 2005, Microsoft has added tracing at the provider level, at the network protocol level, and to all the data access technologies so that you can trace your data applications from end to end.
| Note | For more information about how to trace the data access layer, you can read the “Data Access Tracing in SQL Server 2005” technical article at http://msdn2.microsoft.com/en-us/library/aa964124.aspx. |
Don’t forget that you can use SQL Server Profiler to see how the client application is interacting with SQL Server 2005. This can be particularly useful for third-party applications where you have no idea what they are really doing.
In this chapter, you’ll concentrate on the performance object counters.
Establishing Baselines for Performance
Our baseline is capturing a larger set of metrics because we typically are not looking for specific problems but instead are trying to look for trends, capacity/resource plan, and respond to potential performance problems. To that end, by necessity you need to capture a larger set of performance object counters. After all, we are looking for unknowns, albeit known unknowns in this case.
Again, the emphasis needs to be on trying to detect differences or trends between successive metrics gathered from the same baseline. This is the whole point of establishing a baseline.
For example, you might notice that both processor utilization and memory resource utilization for your SQL Server 2005 database solution are 30 percent higher than from the previous quarter. Obviously, you need to determine why. Upon your analysis, you determine that the SQL Server 2005 database solution has 500 more concurrent users accessing it than in the previous quarter. So in this example, the 30 percent increase is nothing to be alarmed about.
Let’s go through the various subsystems and the performance object counters to monitor in a baseline.
| Note | Remember that this is just the basis for a baseline. Feel free to add or remove performance object counters depending on your SQL Server 2005 database solution and operational factors. |
Processor Subsystem
The following performance object counters would form the basis of a baseline for monitoring your processor subsystem:
-
Processor(_Total) : % Privileged Time Indicates the percentage of time that the threads spent executing code in privileged mode.
-
Processor(_Total) : % Processor Time Indicates the percentage of time that the processor spent executing nonidle threads.
-
System : Processor Queue Length Indicates the number of threads in the processor queue.
-
Server Work Queues (Blocking Queue) : Queue Length Indicates the context blocks queued per second on the server’s Feasible Shortest Path queue to await server action.
Memory Subsystem
The following performance object counters would form the basis of a baseline for monitoring your memory subsystem:
-
Memory : Available Mbytes Indicates the amount of memory from the nonpaged pool.
-
Memory : Page Faults/sec Indicates the rate at which pages are read from/written to the disk drive to resolve hard page faults and can be used as the primary indicator for faults that can become a systemwide bottleneck.
-
Memory : Pages/sec Indicates the rate at which pages are read from or written to the disk to resolve hard page faults.
-
Paging File(_Total) : % Usage Indicates the usage of the page file as a percentage.
-
Memory : Pool Non-Paged Bytes Indicates the size of the nonpaged pool in bytes.
Note Memory : Pool Non-Paged Bytes and Memory : Pool Paged Bytes are calculated differently from Process : Pool Non-Paged Bytes and Process : Pool Paged, respectively. Consequently, they might not be equal to Process (_Total) : Pool Non-Paged Bytes and Process (_Total) : Pool Paged Bytes.
-
Memory : Pool Paged Bytes Indicates the size of the paged pool in bytes.
-
Memory : Transition Faults/sec Indicates the rate at which page faults are resolved.
| Note | Transition faults are counted as the number of faults because only one page is faulted for each operation. |
Disk I/O Subsystem
The following performance object counters would form the basis of a baseline for monitoring your disk I/O subsystem:
-
LogicalDisk(*) : % Disk Read Time Indicates the percentage of time the logical disk drive is busy servicing read requests.
-
LogicalDisk(*) : % Disk Write Time Indicates the percentage of elapsed time the logical disk drive is busy servicing write requests.
-
LogicalDisk(*) : % Free Space Indicates the percentage of free space for the logical disk drive.
-
LogicalDisk(*) : Avg. Disk Read Queue Length Indicates the average number of read requests that are queued for the logical disk drive.
-
LogicalDisk(*) : Avg. Disk Write Queue Length Indicates the average number of write requests that are queued for the logical disk drive.
-
LogicalDisk(*) : Free Megabytes Indicates the amount of free space for the logical disk drive.
-
PhysicalDisk(*) : Avg. Disk Bytes/Read Indicates the average number of bytes transferred from the disk during read operations.
-
PhysicalDisk(*) : Avg. Disk Bytes/Write Indicates the average number of bytes transferred to the disk during write operations.
| Tip | You should monitor Memory : Page Faults/sec to ensure that any potential disk activity is not caused by paging. |
Network I/O Subsystem
The following performance object counters would form the basis of a baseline for monitoring your network I/O subsystem:
-
Network Interface(*) : Bytes Received/sec Indicates the rate at which bytes are received by each NIC.
-
Network Interface(*) : Bytes Sent/sec Indicates the rate at which bytes are sent by each NIC.
-
Server : Logon Total Indicates all interactive logons, network logons, service logons, successful logons, and failed logons since the computer was last restarted.
SQL Server 2005 Database Engine
The following performance object counters would form the basis of a baseline for monitoring your SQL Server 2005 database engine subsystem:
-
Process(sqlservr) : Page Faults/sec Indicates the rate at which page faults are occurring by the SQL Server 2005 database engine process.
Note Most processors can handle a large number of soft faults without performance degradation. On the other hand, hard faults can cause substantial performance degradation.
-
Process(sqlservr) : Private Bytes Indicates the current size of memory in bytes that the process has allocated to it.
Note Process(sqlservr) : Private Bytes can measure the MemToLeave address space where Address Windowing Extensions (AWE) is being used.
-
SQLServer:Buffer Manager : Buffer Cache Hit Ratio Indicates the percentage of data requests served out of the buffer cache.
-
SQLServer:Buffer Manager : Checkpoint Pages/sec Indicates the number of pages flushed by the checkpoint process or other operations that require all dirty pages to be flushed.
-
SQLServer:Buffer Manager : Lazy Writes/sec Indicates the number of buffers written by the buffer manager’s lazy writer back to disk.
Note High values for SQLServer:Buffer Manager : Lazy Writes/sec could indicate internal memory pressure because a lot of dirty pages need to be written back to disk. Poor disk I/O could contribute to this.
-
SQLServer:Buffer Manager : Readahead Pages/sec Indicates the number of pages read in anticipation of use.
-
SQLServer:Databases : Data File(s) Size (KB) Indicates the cumulative size of all the data-base’s data files.
-
SQLServer:Databases : Log Flush Waits/sec Indicates the number of commits waiting for the log flush.
-
SQLServer:Databases : Percent Log Used Indicates the percentage of space in the transaction log that is in use.
-
SQLServer:Databases : Transactions/sec Indicates the number of transactions started for the database per second.
-
SQLServer:Databases(tempdb) : Transactions/sec Indicates the number of transactions started for the tempdb system database per second.
-
SQLServer:General Statistics : Active Temp Tables Indicates the number of temporary tables/table variables in use.
-
SQLServer:General Statistics : Logins/sec Indicates the total number of logins started per second.
Note High values for SQLServer:General Statistics : Logins/sec could indicate that connection pooling is not being used.
-
SQLServer:General Statistics : Logouts/sec Indicates the total number of logouts started per second.
-
SQLServer:General Statistics : Mars Deadlocks Indicates the number of MARS deadlocks detected.
-
SQLServer:General Statistics : Processes blocked Indicates the number of currently blocked processes.
-
SQLServer:General Statistics : Temp Tables Creation Rate Indicates the number of temporary tables/table variables created per second.
-
SQLServer:General Statistics : Temp Tables For Destruction Indicates the number of temporary tables/table variables waiting to be destroyed by the cleanup system thread.
-
SQLServer:General Statistics : User Connections Indicates the number of users connected to the SQL Server 2005 instance.
-
SQLServer:Locks : Average Wait Time (ms) Indicates the average amount of wait time for each lock request that results in a wait.
-
SQLServer:Locks : Lock Requests/sec Indicates the number of new locks and lock conversions per second requested.
-
SQLServer:Locks : Lock Timeouts (timeout > 0)/sec Indicates the number of lock requests per second that have timed out. This excludes requests for NOWAIT locks.
-
SQLServer:Locks : Lock Timeouts/sec Indicates the number of lock requests per second that have timed out. This includes requests for NOWAIT locks.
-
SQLServer:Locks : Lock Wait Time (ms) Indicates the total wait time for locks in the last second.
-
SQLServer:Locks : Lock Waits/sec Indicates the number of lock requests per second that required the caller to wait.
-
SQLServer:Locks : Number of Deadlocks/sec Indicates the number of lock requests per second that resulted in a deadlock.
-
SQLServer:Access Methods : Full Scans/sec Indicates the number of full scans (either for the table or for the index) per second.
Tip If you are seeing values of 2 (or even 1) or higher for SQLServer:Access Methods : Full Scans/sec, you should investigate this further and try to find the T-SQL code that is causing the full scans, because they can be particularly taxing on I/O resources.
Note If the SQLServer:Access Methods : Full Scans/sec value starts increasing with time, it might be indicative of a poor indexing strategy. Make it easy on yourself-run the Database Engine Tuning Advisor!
-
SQLServer:Access Methods : Page Splits/sec Indicates the number of page splits occurring as the result of index page overflows.
-
SQLServer:Access Methods : Table Lock Escalations/sec Indicates the number of times locks on a table were escalated.
-
SQLServer:Access Methods : Worktables Created/sec Indicates the number of worktables created per second.
-
SQLServer:Plan Cache (_Total) : Cache Object Counts Indicates the number of cache objects in the cache.
-
SQLServer:Plan Cache(_Total) : Cache Pages Indicates the number of pages used by procedure cache objects.
-
SQLServer:Plan Cache(_Total) : Cache Hit Ratio Indicates the ratio between cache hits versus lookups.
-
SQLServer:Latches : Average Latch Wait Time (ms) Indicates the average wait time for latch requests that have to wait.
-
SQLServer:Latches : Latch Waits/sec Indicates the number of latch requests that could not be granted immediately per second and consequently had to wait before being granted.
-
SQLServer:Latches : Total Latch Wait Time (ms) Indicates the total amount of time that latch requests had to wait in the last second in milliseconds.
-
SQLServer:Memory Manager : Optimizer Memory (KB) Indicates the total amount of memory the database engine is using for query optimization.
-
SQLServer:Memory Manager : SQL Cache Memory (KB) Indicates the total amount of memory the database engine is using for the dynamic SQL cache.
-
SQLServer:SQL Statistics : Batch Requests/sec Indicates the number of T-SQL batch requests received by the server per second.
-
SQLServer:SQL Statistics : Auto-Param Attempts/sec Indicates the number of autoparame-terization attempts per second.
-
SQLServer:SQL Statistics : SQL Compilations/sec Indicates the number of SQL compilations per second. (This includes compiles caused by statement-level recompilations in SQL Server 2005 because of changes in how recompilations work.)
-
SQLServer:SQL Statistics : SQL Re-Compilations/sec Indicates the number of statement recompiles per second.
| Note | A growth in the trend of SQLServer:SQL Statistics : SQL Re-Compilations/sec should be investigated for the root cause. |
Establishing Thresholds for Performance
Unlike the methodology used when establishing baselines for performance where you look for relative differences between the capturing of metrics, when establishing thresholds for performance, you need to watch out for specific metric values. These specific metrics or limits are for the most part based on hardware vendors and operating system theory.
The idea here is that if certain performance monitor counters go beyond the defined threshold (typically for a sustained period, do not worry about spikes), you have some sort of bot-tleneck/performance problem that you need to address.
| Note | Again, remember that this is just a starting point for you to use. Feel free to add or remove performance object counters and thresholds depending on your SQL Server 2005 database solution, any existing SLAs in place, and other operational factors. |
The thresholds for the following performance object counters would generally apply to most SQL Server 2005 solutions. They are based on hardware vendor feedback and operating system theory.
Processor Subsystem
The following performance object counters would form the basis of the thresholds for monitoring your processor subsystem:
-
Processor(_Total) : % Privileged Time Indicates the percentage of time spent by the processor executing code in privileged mode.
-
The average value should be less than 10.
Note A high percentage consistently executing in privileged mode might be indicative of a failing device that is generating a large number of interrupts.
-
Processor(*) : % Processor Time Indicates the percentage of time spent by the processor executing a nonidle thread.
-
The average value should be less than 80.
-
Processor(*) : % Privileged Time Indicates the percentage of time spent by the processor executing code in privileged mode.
-
The average value should be less than 10.
-
Server Work Queues(0) : Queue Length Indicates the current length of the server work queue for the processor.
Note Server Work Queues(0) : Queue Length is an instantaneous count and not an average over time.
-
This performance object counter should be less than 4.
-
System : Context Switches/sec Indicates the combined rate at which all processors are switching threads.
-
The average value per processor should be less than 1,000.
-
System : Processor Queue Length Indicates the number of threads waiting on the processor queue.
-
This performance object counter should be less than (10 × the number of processors).
Memory Subsystem
The following performance object counters would form the basis of the thresholds for monitoring your memory subsystem:
-
Memory : Available Mbytes Indicates the amount of memory from the nonpaged pool.
-
The average value should be less than 128.
Note Be very careful with the guideline for Memory : Available Mbytes. You should also check to see whether your SQL Server solution is paging.
-
Memory : Free System Page Table Entries (PTE) Indicates the number of page table entries not currently in use by the system.
-
This performance object counter should be less than 3,000.
Note Memory : Free System Page Table Entries (PTE) is usually between 80,000 and 140,000 on the 32-bit architecture. (It’s at least 15,000 if the /3GB boot.ini switch is being used.)
-
Memory : Pages/sec Indicates the rate at which pages are read from/written to the disk drive to resolve hard page faults.
-
The average value should be less than 5.
-
Paging File(_Total) : % Usage Indicates the usage of the page file as a percentage.
-
This performance object counter should be less than 70 percent.
Disk I/O Subsystem
The following performance object counters would form the basis of the thresholds for monitoring your disk I/O subsystem:
-
LogicalDisk(*) : Avg. Disk Queue Length Indicates the average number of read and write requests that are queued for the disk drive.
-
The average value per spindle should be less than 1.5.
Note Don’t forget to take into account any hardware RAID arrays when monitoring LogicalDisk(*) : Avg. Disk Queue Length.
-
LogicalDisk(*) : Disk Bytes/sec Indicates the rate at which bytes are transferred during write or read operations on the disk drive.
-
This performance object counter should be less than 10MB/sec.
-
PhysicalDisk(*) : % Disk Time Indicates the percentage of time spent by the disk drive performing read and write operations.
-
This performance object counter should be less than 90 percent.
Tip If you suspect that your disk drives are a bottleneck when monitoring Physi-calDisk(*) : % Disk Time, you should correlate this with PhysicalDisk(*) : Avg. Disk Queue Length.
-
PhysicalDisk(*) : Avg. Disk Queue Length Indicates the average number of read and write requests queued on the disk drive.
-
The average value per spindle should be less than 0.5.
| Note | Don’t forget to take into account any hardware RAID array when monitoring PhysicalDisk(*) : Avg. Disk Queue Length. |
Network I/O Subsystem
The following performance object counters would form the basis of the thresholds for monitoring your network I/O subsystem:
-
Network Interface(*) : Bytes Total/sec Indicates the rate at which bytes are sent and received by each NIC.
-
This performance counter should be less than 50 percent of the capacity of the NIC.
SQL Server 2005 Database Engine
The following performance object counters would form the basis of the thresholds for monitoring your SQL Server 2005 database engine subsystem:
-
Process(sqlservr) : Virtual Bytes Indicates the current size of the virtual address space of the SQL Server 2005 database engine.
-
This performance object counter should be less than 1.5GB on a 32-bit architecture.
-
SQLServer:Buffer Manager : Buffer Cache Hit Ratio Indicates the percentage of data requests found in the buffer cache.
-
This performance object counter should be greater than 90 percent.
Note The Buffer Cache Hit Ratio is calculated over time differently than in earlier versions of SQL Server, so it is more “accurate” now.
-
SQLServer:Buffer Manager : Page Life Expectancy Indicates the number of seconds a page is staying in the buffer pool without references.
-
This performance object counter should be greater than 300 seconds.
-
SQLServer:Buffer Manager : Free Pages Indicates the total number of free pages.
-
This performance object counter should be less than 640.
-
SQLServer:Databases(*) : Log Flush Wait Time Indicates the total wait time for log flushing.
-
This performance object counter should be less than 500 ms.
-
SQLServer:Plan Cache _Total : Cache Hit Ratio Indicates the ratio between cache hits versus lookups.
-
This performance object counter should be greater than 90 percent.
-
SQLServer:Memory Manager : Memory Grants Pending Indicates the number of processes waiting for a workspace memory grant.
-
This performance object counter should equal zero.
-
SQLServer:Memory Manager : Target Server Memory (KB) Indicates the total amount of dynamic memory the SQL Server 2005 database engine is willing to consume.
-
This performance object counter should be close to the size of physical memory.
-
SQLServer:Memory Manager : Total Server Memory (KB) Indicates the total amount of dynamic memory the SQL Server 2005 database engine is currently consuming.
-
This performance object counter should be close to the size of Target Server Memory.
-
SQLServer:SQL Statistics : SQL Re-Compilations/sec Indicates the number of T-SQL recompilations.
-
This performance object counter should ideally be close to zero.
| Note | Obviously, it is impossible to eliminate recompilations altogether, and that wouldn’t be a good thing because they are there for a reason. |
Implementing Traces
We have already covered how to use the SQL Server Profiler and the system stored procedures available for capturing a SQL Server trace without the SQL Server Profiler in Chapter 1. It’s probably worth listing the system stored procedures again in Table 4.1.
| Stored Procedure | Description |
|---|---|
| fn_trace_geteventinfo | Returns information about events included in a trace |
| fn_trace_getfilterinfo | Returns information about filters applied to a trace |
| fn_trace_getinfo | Returns information about a specified trace (or all existing traces) |
| sp_trace_create | Creates a trace definition |
| sp_trace_setevent | For existing traces, add or removes an event or event column |
| sp_trace_setfilter | Applies a filter to a trace |
| sp_trace_setstatus | Modifies the current state of a trace |
| sp_trace_generateevent | Creates a user-defined event |
As with the performance object counters discussed in the previous sections, you should familiarize yourself with the SQL Server Profiler trace events that should be monitored in your database performance monitoring solution. We’ll go through the more commonly monitored SQL Server Profilers trace events now.
Table 4.2 shows the database event classes that are typically monitored for capacity planning and availability reasons.
| Event Name | Description |
|---|---|
| Data File Auto Grow | Indicates that the data file grew automatically |
| Data File Auto Shrinks | Indicates that the data file has shrunk |
| Log File Auto Grow | Indicates that the log file grew automatically |
| Log File Auto Shrink | Indicates that the log file has shrunk |
Table 4.3 shows the errors and warnings event classes that are generated from SQL server 2005 errors or warnings. They are typically monitored for indications that SQL Server 2005 is generating inefficient query plans, which can potentially adversely affect the system’s performance.
| Event Name | Description |
|---|---|
| Blocked Process Report | Indicates that a task has been blocked for more than a specified amount of time. |
| Exception | Indicates that an exception has occurred in SQL Server 2005. |
| Execution Warnings | Indicates memory grant warnings that occurred during the execution of a T-SQL statement or stored procedure. |
| Hash Warning | Indicates that a hash operation, such as hash aggregate, hash distinct, hash join, or hash union, ran out of resources and had to resort to an alternative execution strategy. |
| Missing Column Statistics | Indicates that column statistics are not available. |
| Missing Join Predicate | Indicates that no join predicate exists for a query that was executed. |
| Sort Warnings | Indicates that sort operations do not fit into available memory. It includes sort operations only within a query (such as an ORDER BY clause used in a SELECT statement). |
| Note | For more information about hash joins, search for the “Understanding Hash Joins” topic in SQL Server 2005 Books Online. |
Table 4.4 shows the lock event classes that are available in SQL Server 2005. They are typically monitored to trap more information about deadlock frequency and how locking might be creating contention in your database solution, which might then be perceived as poor performance.
| Event Name | Description |
|---|---|
| Deadlock Graph | Provides an Extensible Markup Language (XML) description of a deadlock. |
| Lock:Deadlock Chain | Is produced for each participant in a deadlock and captures additional information such as the owner, lock mode, and owner and resource type to help troubleshoot deadlocks. |
| Lock:Deadlock | Indicates that a transaction has been rolled back as a deadlock victim because it tried to acquire a lock on a resource that caused a deadlock to occur. |
| Lock:Escalation | Indicates that a lock escalation has occurred. (An example would be where a row-level lock is escalated to a page-level lock.) |
| Lock:Timeout | Indicates that a request for a lock on a resource has timed out because of an incompatible lock acquired by another transaction. |
| Lock:Timeout (timeout > 0) | Is the same as the Lock:Timeout event class except it does not include any event where the timeout value (@@LOCK_ TIMEOUT) is 0. |
Table 4.5 shows the stored procedure event classes that are available in SQL server 2005. They are typically monitored to see how well the procedure cache is being utilized and whether excessive recompilations (or compilations) are occurring.
| Event Name | Description |
|---|---|
| RPC:Completed | Indicates that a remote procedure call (RPC) has completed |
| RPC:Starting | Indicates that a RPC is starting |
| SP:CacheHit | Indicates that a stored procedure was found in the cache |
| SP:CacheMiss | Indicates that a stored procedure was not found in the cache |
| SP:Completed | Indicates that a stored procedure has completed |
| SP:Recompile | Indicates that a stored procedure was recompiled |
| SP:Starting | Indicates that a stored procedure is starting |
Finally, you have the Transact-SQL event classes that are available in SQL Server 2005 shown in Table 4.6. They are typically monitored to trap more information about the Transact-SQL statements and batches that are being executed against a SQL Server 2005 instance. Notice the SQL:StmtRecompile event class that is related to SQL Server’s new ability to recompile only statement-level syntax as opposed to the entire batch.
| Event Name | Description |
|---|---|
| StmtCompleted | Indicates that a T-SQL statement has completed |
| SP:StmtStarting | Indicates that a T-SQL statement has started |
| SQL:BatchCompleted | Indicates a T-SQL batch has completed |
| SQL:BatchStarting | Indicates that a T-SQL batch is starting |
| SQL:StmtCompleted | Indicates that a T-SQL statement has completed |
| SQL:StmtRecompile | Indicates statement-level recompilations caused by all types of batches: ad hoc batches, queries, stored procedures, and triggers |
| SQL:StmtStarting | Indicates that a T-SQL statement is starting |
Implementing Alerts
SQL Server 2005 has a number of options when it comes to implementing some sort of an alerting system that notifies you whenever a particular event occurs or a performance threshold is met.
The SQL Server Agent generates alerts inside the SQL Server 2005 environment, so make sure the service is always running. Just the other day one of us was doing some consulting work for one of the major television stations in Australia when he saw a SQL Server solution being rebooted and the DBAs forgetting to ensure that the SQL Server Agent was running.
You can also potentially use triggers to programmatically generate “alerts” for a database monitoring solution, so you will look at that in more detail later.
The SQL Server Agent’s primary purpose is for implementing “administrative tasks” such as backups on a particular schedule. However, you can leverage its capabilities as a DBA to perform a variety of actions within your database solution, such as transferring data, emailing query results periodically, and running end-of-day batch processes.
The SQL Server Agent provides a powerful and flexible framework for performing actions within a SQL Server solution. The SQL Server Agent basically has three core abilities that you can take advantage of:
-
Executing scheduled jobs The ability to execute a range of external and internal jobs provides a powerful platform for the DBA to create a self-monitoring environment. However, the developer can also use this ability to create a very rich database solution. It all depends on you, but the sky is the limit!
-
Generating alerts The SQL Server Agent has the ability to notify you whenever an event that you are interested in occurs. Although these are geared primarily toward DBAs, developers can define their own user-defined counters, which can then have thresholds set against them and alerts consequently triggered.
-
Notifying operators A core component of the SQL Server Agent framework is the ability to notify operators using different technologies whenever a particular executing job has succeeded or failed or an alert has occurred within the database solution.
| Tip | Ensure that the SQL Server Agent is started. |
Defining Alerts Using the SQL Server Agent
An important facet of the SQL Server Agent is the ability to generate alerts based on a number of criteria within your database solution. The SQL Server Agent in SQL Server 2005 supports a number of types of alerts, which we will cover shortly.
SQL Server Agent alerts are basically a response to an event that typically the DBA is interested in, such as when a database’s transaction log is full or, better still, almost full, such as being more than 90 percent full.
All the different types of alerts have the same response of either a job being executed, an operator being notified, or both. Figure 4.1 shows what options you have when responding to a SQL Server Agent alert being generated.
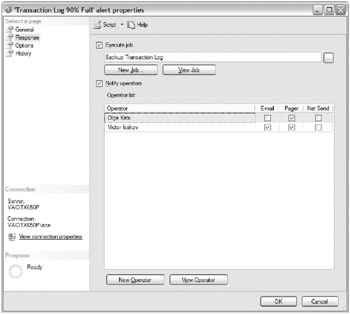
Figure 4.1: SQL Server Agent alert response options
Likewise, several options are configurable for all alerts. Figure 4.2 shows what options exist for a SQL Server Agent alert being generated.
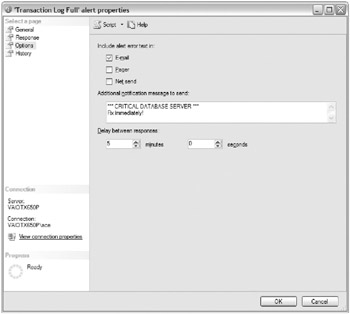
Figure 4.2: SQL Server Agent alert options
| Tip | Delay Between Responses is an important alert option because it prevents the SQL Server Agent from being overloaded if a particular event is repeatedly firing in quick succession. |
We’ll now cover the different types of SQL Server Agent alerts that can be defined in SQL Server 2005.
For completeness’ sake, we will show you how to define operators in the SQL Server Agent. This is a relatively straightforward exercise that involves providing the operator’s details.
The graphic shown here shows how you would create a SQL Server agent operator using the SQL Server Management Studio environment.
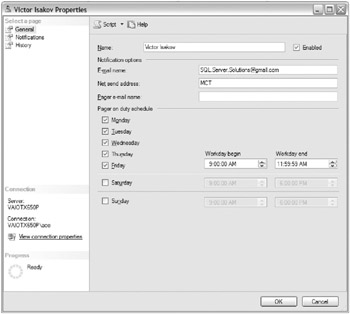
Alternatively, you could use the sp_add_operator system stored procedure:
sp_add_operator [ @name = ] 'name' [ , [ @enabled = ] enabled ] [ , [ @email_address = ] 'email_address' ] [ , [ @pager_address = ] 'pager_address' ] [ , [ @weekday_pager_start_time = ] weekday_pager_start_time ] [ , [ @weekday_pager_end_time = ] weekday_pager_end_time ] [ , [ @saturday_pager_start_time = ] saturday_pager_start_time ] [ , [ @saturday_pager_end_time = ] saturday_pager_end_time ] [ , [ @sunday_pager_start_time = ] sunday_pager_start_time ] [ , [ @sunday_pager_end_time = ] sunday_pager_end_time ] [ , [ @pager_days = ] pager_days ] [ , [ @netsend_address = ] 'netsend_address' ] [ , [ @category_name = ] 'category' ]
But why would you bother?
SQL Server Event Alerts
SQL Server event alerts are based on the SQL Server error messages that can be generated by the SQL Server 2005 database engine through the sys.sysmessages system catalog. So, it is a matter of becoming familiar with the various error messages that can be generated by SQL Server, along with their severity and message text.
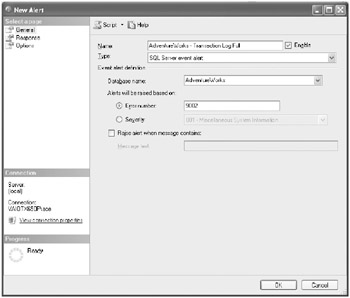
Figure 4.3 shows a SQL Server event alert being defined for when the AdventureWorks database’s transaction log is full.
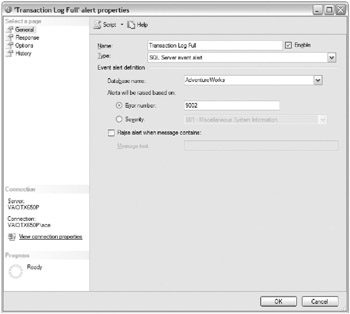
Figure 4.3: SQL Server Event Alert
Don’t forget that, as a database developer, you can create your own custom error messages using the sp_addmessage system stored procedure:
sp_addmessage [ @msgnum = ] msg_id , [ @severity = ] severity , [ @msgtext = ] 'msg' [ , [ @lang = ] 'language' ] [ , [ @with_log = ] 'with_log' ] [ , [ @replace = ] 'replace' ]
| Tip | Don’t forget to have some sort of convention in your enterprise of what range of error numbers you plan to use greater than 50,000. |
This basically allows you to define a SQL Server event alert based on your own user-defined messages. You will need to use the RAISERROR statement to generate the user-defined message:
RAISERROR ( { msg_id | msg_str | @local_variable } { ,severity ,state } [ ,argument [ ,...n ] ] ) [ WITH option [ ,...n ] ] The RAISERROR statement is typically invoked in a stored procedure or trigger.
| Tip | For SQL Server event alerts to work against your user-defined error message, your user-defined error message must write to the Windows Event Log through either its definition via the @with_log = 'TRUE' clause or at runtime through the WITH LOG clause. |
Exercise 4.1 goes through the process of creating a SQL Server event alert.
Exercise 4.1: Implementing SQL Server Event Alerts
In this particular exercise, you want to create a SQL Server event alert that will fire whenever the AdventureWorks database’s transaction log is full.
-
Open SQL Server Management Studio, and connect to your SQL Server 2005 instance using Windows authentication.
-
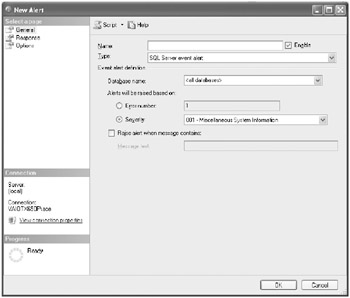
Expand the SQL Server Agent folder in Object Explorer, right-click the Alerts folder, and choose the New Alert option. The New Alert window appears, as shown here.
-
Ensure the type is a SQL Server event alert. Select the AdventureWorks database from the Database Name drop-down list.
-
Type a name for the alert, as shown here.
-
SQL Server 2005 will raise a 9002 error whenever a database’s transaction log is full. Click the Error Number radio button, and type 9002 for the error number value, as shown here.
-
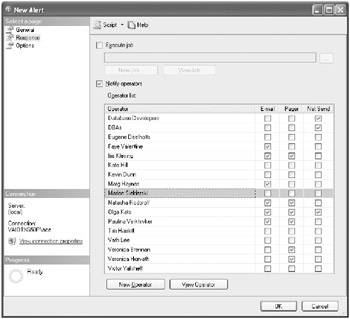
Select the Response page. On this page, you can configure whether you want a SQL Server Agent job to execute and/or who to notify when the alert fires.
-
Check the Notify Operators check box, and select the appropriate operators from the list, as shown here.
-
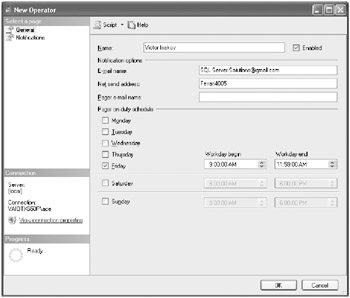
If you do not have any operator, click the New Operator button. A New Operator window should appear.
-
Fill in the operator details as appropriate for your environment. An example is shown here. (Tip: If you have not configured your SQL Server 2005 instance to be able to send emails, use the Net Send Address option to put in your computer name.) Click the OK but-ton when you are finished.
-
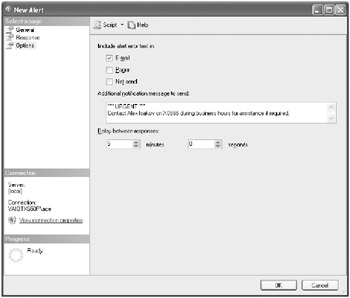
Select the Options page. On this page you have some additional configuration options, as shown here. It basically allows you to include the error text in the response and add a message.
-
Click the OK button.
You have now configured an alert that will fire whenever the AdventureWorks database’s transaction log is full. You can test your alert if you want by generating transaction log activity. The easiest way to do that is to open multiple query sessions in SQL Server Management Studio and generate activity through “dummy updates” such as UPDATE Person.Contact SET LastName = LastName. Let’s hope this will fill up the transaction log! If not, keep opening more sessions. (It might also help if the database is not in simple recovery mode and does not have autogrowth turned on for the transaction log. But it is still possible to fill up the transaction log irrespective, if you really “hammer it.”)
When you have finished, you can clean up by deleting the SQL Server event alert you just created by right-clicking it in the Alerts subfolder of the SQL Server Agent folder and choosing the Delete option.
SQL Server Performance Condition Alerts
SQL Server performance condition alerts are based on the SQL Server performance object counters that get installed with a default installation of SQL Server 2005 that you have seen so much of already.
Figure 4.4 shows a SQL Server performance condition alert being defined for when the AdventureWorks database’s transaction log is 90 percent full.
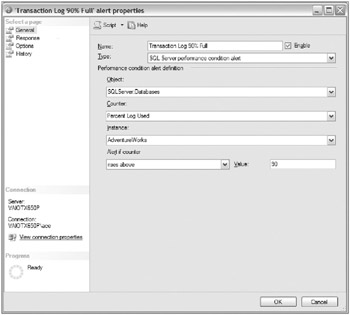
Figure 4.4: SQL Server Performance Condition Alert
Exercise 4.2 goes through the process of creating a SQL Server performance condition alert.
Exercise 4.2: Implementing SQL Server Performance Condition Alerts
In this particular exercise, you want to create a SQL Server performance condition alert that will fire whenever the AdventureWorks database’s transaction log is 90 percent full.
-
Open SQL Server Management Studio, and connect to your SQL Server 2005 instance using Windows authentication.
-
Expand the SQL Server Agent folder in Object Explorer, right-click the Alerts folder, and choose the New Alert option. The New Alert window appears.
-
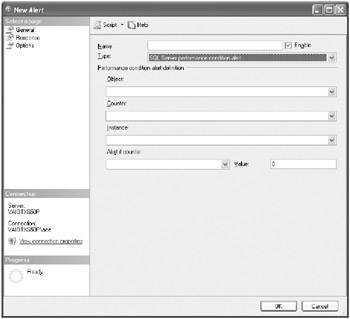
Select SQL Server Performance Condition Alert in the Type drop-down list, as shown here. Select the AdventureWorks database from the Database Name drop-down list.
-
Type a name for the alert, as shown here.
-
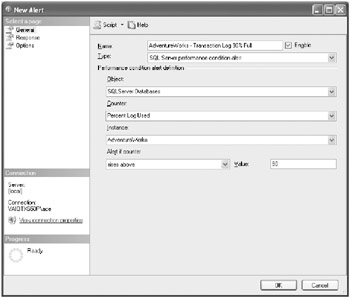
Populate the Performance Condition Alert Definition area, as shown here.
-
As you did in Exercise 4.1, select the Response page. On this page you can configure whether you want a SQL Server Agent job to execute and/or whom to notify when the alert fires.
-
Check the Notify Operators check box, and select the appropriate operators from the list.
-
If you do not have any operator, click the New Operator button. A New Operator window should appear.
-
Fill in the operator details as appropriate for your environment. (Tip: If you have not configured your SQL Server 2005 instance to be able to send emails, use the Net Send Address option to put in your computer name.) Click the OK button when you are finished.
-
Select the Options page. On this page you have some additional configuration options. This page basically allows you to include the error text in the response and add a message.
-
Click the OK button.
You have now configured an alert that will fire whenever the AdventureWorks database’s transaction log is 90 percent full. Again, you can test it by generating transaction log activity, as discussed in Exercise 4.1.
When you have finished, you can clean up by deleting the SQL Server performance condition alert you just created by right-clicking it in the Alerts subfolder of the SQL Server Agent folder and choosing the Delete option.
SQL Server WMI Event Alerts
SQL Server WMI event alerts are a new addition to SQL Server 2005. WMI event alerts are raised when a particular SQL Server–related event occurs that is being monitored by the WMI provider for server events that in turn is monitored by the SQL Server Agent. Figure 4.5 shows this “convoluted” architecture that involves quite a number of various SQL Server components.
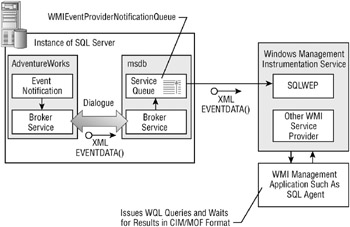
Figure 4.5: WMI alert architecture
As you can see, the SQL Server Agent acts as a WMI management application, issuing WQL queries to the WMI interface and responding accordingly.
The WMI is Microsoft’s web-based enterprise management (WBEM)–compliant implementation of the Common Information Model (CIM) initiative developed by the Distributed Management Task Force (DMTF).
The WMI basically provides uniform support for systems and applications management. A key feature of the WMI, and fundamentally what we are talking about here, is the ability to notify a management component of a particular event occurring, such as hardware or software events. In this case, you are more interested in the SQL Server namespace obviously.
For more information about the WMI, its background, and its purpose, we recommend reading http://msdn.microsoft.com/library/default.asp?url=/library/en-us/dnwmi/html/wmioverview.asp.
| Note | WQL stands for WMI Query Language, which is really a simplified version of the SQL language you know and love. It additionally has some WMI-specific extensions, as you would expect. If you are familiar with Microsoft’s System Management Server product, you should be extremely comfortable with the WMI and with WQL. |
The WMI provider for server events manages a WMI namespace for each instance of SQL Server 2005. The namespace has the \\.\root\Microsoft\SqlServer\ServerEvents\ instance_name format. A default SQL Server 2005 instance has an instance_name of MSSQLSERVER.
Two main categories of events make up the programming model for the WMI provider for server events. The categories are DDL and SQL trace events.
-
DDL_DATABASE_LEVEL_EVENTS
-
DDL_ASSEMBLY_EVENTS: CREATE_ASSEMBLY, ALTER_ASSEMBLY, DROP_ ASSEMBLY
-
DDL_DATABASE_SECURITY_EVENTS
-
DDL_APPLICATION_ROLE_EVENTS: CREATE_APPLICATION_ROLE, ALTER_APPLICATION_ROLE, DROP_APPLICATION_ROLE
-
DDL_AUTHORIZATION_DATABASE_EVENTS: ALTER_AUTHORIZATION_ DATABASE
-
DDL_CERTIFICATE_EVENTS: CREATE_CERTIFICATE, ALTER_CERTIFICATE, DROP_CERTIFICATE
-
DDL_GDR_DATABASE_EVENTS: GRANT_DATABASE, DENY_DATABASE, REVOKE_DATABASE
-
DDL_ROLE_EVENTS: CREATE_ROLE, ALTER_ROLE, DROP_ROLE
-
DDL_SCHEMA_EVENTS: CREATE_SCHEMA, ALTER_SCHEMA, DROP_ SCHEMA
-
DDL_USER_EVENTS: CREATE_USER, DROP_USER, ALTER_USER
-
DDL_EVENT_NOTIFICATION_EVENTS: CREATE_EVENT_NOTIFICATION, DROP_EVENT_NOTIFICATION
-
DDL_FUNCTION_EVENTS: CREATE_FUNCTION, ALTER_FUNCTION, DROP_FUNCTION
-
-
DDL_PARTITION_EVENTS
-
DDL_PARTITION_FUNCTION_EVENTS: CREATE_PARTITION_FUNCTION, ALTER_PARTITION_FUNCTION, DROP_PARTITION_FUNCTION
-
DDL_PARTITION_SCHEME_EVENTS: CREATE_PARTITION_SCHEME, ALTER_PARTITION_SCHEME, DROP_PARTITION_SCHEME
-
DDL_PROCEDURE_EVENTS: CREATE_PROCEDURE, DROP_PROCEDURE, ALTER_PROCEDURE
-
-
DDL_SSB_EVENTS
-
DDL_CONTRACT_EVENTS: CREATE_CONTRACT, DROP_CONTRACT
-
DDL_MESSAGE_TYPE_EVENTS: CREATE_MSGTYPE, ALTER_MSGTYPE, DROP_MSGTYPE
-
DDL_QUEUE_EVENTS: CREATE_QUEUE, ALTER_QUEUE, DROP_QUEUE
-
DDL_SERVICE_EVENTS: CREATE_SERVICE, DROP_SERVICE, ALTER_SERVICE
-
DDL_REMOTE_SERVICE_BINDING_EVENTS: CREATE_REMOTE_ SERVICE_BINDING, ALTER_REMOTE_SERVICE_BINDING, DROP_ REMOTE_SERVICE_BINDING
-
DDL_ROUTE_EVENTS: CREATE_ROUTE, DROP_ROUTE, ALTER_ROUTE
-
-
DDL_SYNONYM_EVENTS: CREATE_SYNONYM, DROP_SYNONYM
-
DDL_TABLE_VIEW_EVENTS
-
DDL_INDEX_EVENTS: CREATE_INDEX, DROP_INDEX, ALTER_INDEX, CREATE_ XML_INDEX
-
DDL_STATISTICS_EVENTS: CREATE_STATISTICS, UPDATE_STATISTICS, DROP_STATISTICS
-
DDL_TABLE_EVENTS: CREATE_TABLE, ALTER_TABLE, DROP_TABLE
-
DDL_VIEW_EVENTS: CREATE_VIEW, ALTER_VIEW, DROP_VIEW
-
-
DDL_TRIGGER_EVENTS: CREATE_TRIGGER, DROP_TRIGGER, ALTER_TRIGGER
-
DDL_TYPE_EVENTS: CREATE_TYPE, DROP_TYPE
-
DDL_XML_SCHEMA_COLLECTION_EVENTS: CREATE_XML_SCHEMA_ COLLECTION, ALTER_XML_SCHEMA_COLLECTION, DROP_XML_ SCHEMA_COLLECTION
-
DDL_SERVER_LEVEL_EVENTS: CREATE_DATABASE, ALTER_DATABASE, DROP_DATABASE
-
DDL_ENDPOINT_EVENTS: CREATE_ENDPOINT, ALTER_ENDPOINT, DROP_ ENDPOINT
-
DDL_SERVER_SECURITY_EVENTS: ADD_ROLE_MEMBER, ADD_SERVER_ ROLE_MEMBER, DROP_ROLE_MEMBER, DROP_SERVER_ROLE_MEMBER
-
DDL_AUTHORIZATION_SERVER_EVENTS: ALTER_AUTHORIZATION_ SERVER
-
DDL_GDR_SERVER_EVENTS: GRANT_SERVER, DENY_SERVER, REVOKE_ SERVER
-
DDL_LOGIN_EVENTS: CREATE_LOGIN, ALTER_LOGIN, DROP_LOGIN
-
The following list represents the set of SQL trace events:
-
TRC_CLR: ASSEMBLY_LOAD
-
TRC_DATABASE: DATA_FILE_AUTO_GROW, DATA_FILE_AUTO_SHRINK, DATABASE_MIRRORING_STATE_CHANGE, LOG_FILE_AUTO_GROW, LOG_ FILE_AUTO_SHRINK
-
TRC_DEPRECATION: DEPRECATION_ANNOUNCEMENT, DEPRECATION_ FINAL_SUPPORT
-
TRC_ERRORS_AND_WARNINGS: BLOCKED_PROCESS_REPORT, ERRORLOG, EVENTLOG, EXCEPTION, EXCHANGE_SPILL_EVENT, EXECUTION_WARNINGS, HASH_WARNING, MISSING_COLUMN_STATISTICS, MISSING_JOIN_PREDICATE, SORT_WARNINGS, USER_ERROR_MESSAGE
-
TRC_FULL_TEXT: FT_CRAWL_ABORTED, FT_CRAWL_STARTED, FT_CRAWL_ STOPPED
-
TRC_LOCKS: DEADLOCK_GRAPH, LOCK_DEADLOCK, LOCK_DEADLOCK_ CHAIN, LOCK_ESCALATION
-
TRC_OBJECTS: OBJECT_ALTERED, OBJECT_CREATED, OBJECT_DELETED
-
TRC_OLEDB: OLEDB_CALL_EVENT, OLEDB_DATAREAD_EVENT, OLEDB_ ERRORS, OLEDB_PROVIDER_INFORMATION, OLEDB_QUERYINTERFACE_EVENT
-
TRC_PERFORMANCE: SHOWPLAN_ALL_FOR_QUERY_COMPILE, SHOWPLAN_XML, SHOWPLAN_XML_FOR_QUERY_COMPILE, SHOWPLAN_ XML_STATISTICS_PROFILE
-
TRC_QUERY_NOTIFICATIONS: QN_DYNAMICS, QN_PARAMETER_TABLE, QN_SUBSCRIPTION, QN_TEMPLATE
-
TRC_SECURITY_AUDIT: AUDIT_ADD_DB_USER_EVENT, AUDIT_ADDLOGIN_ EVENT, AUDIT_ADD_LOGIN_TO_SERVER_ROLE_EVENT, AUDIT_ADD_ MEMBER_TO_DB_ROLE_EVENT, AUDIT_ADD_ROLE_EVENT, AUDIT_APP_ ROLE_CHANGE_PASSWORD_EVENT, AUDIT_BACKUP_RESTORE_EVENT, AUDIT_CHANGE_AUDIT_EVENT, AUDIT_CHANGE_DATABASE_OWNER, AUDIT_DATABASE_MANAGEMENT_EVENT, AUDIT_DATABASE_OBJECT_ ACCESS_EVENT, AUDIT_DATABASE_OBJECT_GDR_EVENT, AUDIT_ DATABASE_OBJECT_MANAGEMENT_EVENT, AUDIT_DATABASE_OBJECT_ TAKE_OWNERSHIP_EVENT, AUDIT_DATABASE_OPERATION_EVENT, AUDIT_ DATABASE_PRINCIPAL_IMPERSONATION_EVENT, AUDIT_DATABASE_ PRINCIPAL_MANAGEMENT_EVENT, AUDIT_DATABASE_SCOPE_GDR_EVENT, AUDIT_DBCC_EVENT, AUDIT_LOGIN, AUDIT_LOGIN_CHANGE_PASSWORD_ EVENT, AUDIT_LOGIN_CHANGE_PROPERTY_EVENT, AUDIT_LOGIN_FAILED, AUDIT_LOGIN_GDR_EVENT, AUDIT_LOGOUT, AUDIT_SCHEMA_OBJECT_ ACCESS_EVENT, AUDIT__SCHEMA_OBJECT_GDR_EVENT, AUDIT_SCHEMA_ OBJECT_MANAGEMENT_EVENT, AUDIT_SCHEMA_OBJECT_TAKE_ OWNERSHIP_EVENT, AUDIT_SERVER_ALTER_TRACE_EVENT, AUDIT_ SERVER_OBJECT_GDR_EVENT, AUDIT_SERVER_OBJECT_MANAGEMENT_ EVENT , AUDIT_SERVER_OBJECT_TAKE_OWNERSHIP_EVENT, AUDIT_ SERVER_OPERATION_EVENT, AUDIT_SERVER_PRINCIPAL_ IMPERSONATION_EVENT, AUDIT_SERVER_PRINCIPAL_MANAGEMENT_ EVENT, AUDIT_SERVER_SCOPE_GDR_EVENT
-
TRC_SERVER: MOUNT_TAPE, SERVER_MEMORY_CHANGE, TRACE_ FILE_CLOSE
-
TRC_STORED_PROCEDURE: SP_CACHEINSERT, SP_CACHEMISS, SP_ CACHEREMOVE, SP_RECOMPILE
-
TRC_TSQL: SQL_STMTRECOMPILE, XQUERY_STATIC_TYPE
-
TRC_USER_CONFIGURABLE: USERCONFIGURABLE_0, USERCONFIGURABLE_1, USERCONFIGURABLE_2, USERCONFIGURABLE_3, USERCONFIGURABLE_4, USERCONFIGURABLE_5, USERCONFIGURABLE_6, USERCONFIGURABLE_7, USERCONFIGURABLE_8, USERCONFIGURABLE_9
Creating WMI event alerts is a relatively straightforward process through SQL Server Management Studio. The trick, of course, is to write the WQL query correctly. We’ll finish up by going through an exercise of creating a WMI event alert. Figure 4.6 shows the WMI event alert that you will be creating in Exercise 4.3.
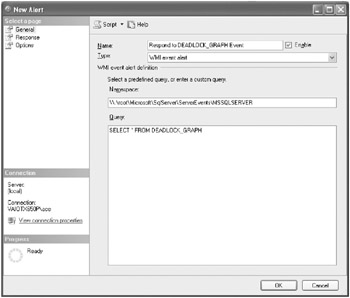
Figure 4.6: WMI alert
| Warning | For SQL Server Agent to receive WMI events in Exercise 4.3, SQL Server 2005 Service Broker must be enabled in msdb and AdventureWorks. |
Exercise 4.3: Implementing WMI Event Alerts
In this particular exercise, you want to create WMI event alerts that will capture deadlock information automatically to a [DeadlockEvents] table for further analysis as required. So, the first task you have to do is to create the table. The [DeadlockGraph] column will capture the XML document that shows the deadlock graph event’s properties.
-
Open SQL Server Management Studio, and connect to your SQL Server 2005 instance using Windows authentication.
-
Click the New Query toolbar button to open a new query window.
-
Type the following T-SQL code, and execute it:
USE AdventureWorks ; GO -- Table to capture deadlock events. CREATE TABLE [tbl_DeadlockEvents] ( AlertDateTime DATETIME, DeadlockEventGraph XML ) GO
-
The next task you have to perform is to create the WMI event alert. You will be using the SELECT * FROM DEADLOCK_GRAPH WQL query. Type the following T-SQL code, and execute it:
USE AdventureWorks ; GO -- Create SQL Agent Job EXEC msdb.dbo.sp_add_job @job_name = 'Capture Deadlocks', @enabled = 1, @description = 'Capture DEADLOCK_GRAPH events' GO EXEC msdb.dbo.sp_add_jobstep @job_name = 'Capture Deadlocks', @step_name = 'Insert DEADLOCK_GRAPH event into [DeadlockEvents]', @step_id = 1, @subsystem = 'TSQL', @command = 'INSERT INTO [tbl_DeadlockEvents] (AlertDateTime, DeadlockGraph) VALUES (GETDATE(), ''$(WMI(TextData))'')', @database_name = 'AdventureWorks' GO EXEC msdb.dbo.sp_add_jobserver @job_name = 'Capture Deadlocks' GO -- Create WMI Event Alert EXEC msdb.dbo.sp_add_alert @name = 'Respond to DEADLOCK_GRAPH', @wmi_namespace = '\\.\root\Microsoft\SqlServer\ServerEvents\MSSQLSERVER', @wmi_query = 'SELECT * FROM DEADLOCK_GRAPH', @job_name = 'Capture Deadlocks' GO
-
It’s time to test the WMI event alert by creating a deadlock. So, you need to open a new query window to start your first transaction. Click the New Query toolbar button to open a second query window.
-
Type the following T-SQL code, and execute it:
USE AdventureWorks ; GO -- Start first transaction BEGIN TRANSACTION SELECT * FROM Person.Contact WITH (TABLOCKX) GO
-
Now you need to open another new query window to start the second transaction. Click the New Query toolbar button to open a third query window.
-
Type the following T-SQL code, and execute it:
USE AdventureWorks ; GO -- Start second transaction BEGIN TRANSACTION SELECT * FROM Person.Address WITH (TABLOCKX) SELECT * FROM Person.Contact WITH (TABLOCKX) GO
-
To create the deadlock, you have to switch back to the first transaction and try accessing a resource that has been exclusively locked by the second transaction. Switch back to the query window that was used to start the first transaction.
-
Type the following T-SQL code, and execute it:
-- Back to first transaction to create the deadlock BEGIN TRANSACTION SELECT * FROM Person.Address WITH (TABLOCKX) GO
-
SQL Server 2005 should choose one of the two transactions as a victim, and you will get an error message similar to the following one:
Msg 1205, Level 13, State 51, Line 2 Transaction (Process ID 69) was deadlocked on lock resources with another process and has been chosen as the deadlock victim. Rerun the transaction.
-
Wait a while. By now SQL Server 2005 has written the deadlock graph to the [tbl_ DeadlockEvents] table, so you’ll query it and examine the contents.
-
Close the two query windows you used to execute the two transactions. You should now be in the query window that was used to create the WMI event alert.
-
Type the following T-SQL code, and execute it (make sure you double-click the [DeadlockEventGraph] XML column):
-- Examine deadlock graph SELECT * FROM [tbl_DeadlockEvents] GO
-
Type the following T-SQL code to clean up your SQL Server instance, and execute it:
USE AdventureWorks ; GO -- Clean up EXEC msdb.dbo.sp_delete_alert @name = 'Respond to DEADLOCK_GRAPH' GO EXEC msdb.dbo.sp_delete_job @job_name = 'Capture Deadlocks' GO DROP TABLE [tbl_DeadlockEvents] GO
Implementing Triggers
The major benefits of triggers are that they cannot be bypassed and they are transparent to the user. Connected users are not even aware of their execution because they are executed automatically in the background by the SQL Server 2005 database engine.
Consequently, triggers are a great tool for monitoring certain activity in your database solution. Remember that you do not necessarily need to generate some sort of “alert” programmatically within triggers. It might be sufficient to write information or gather metrics that can be polled or analyzed later. Auditing security, data access, and DDL operations come to mind straightaway. The great thing about triggers is that anything is possible because of their programmatic nature.
SQL Server 2005 supports the following types of triggers:
-
DML triggers DML triggers fire whenever a DML operation occurs on a table.
-
DDL triggers DDL triggers fire whenever a DDL operation occurs in a database or on the server.
-
Logon triggers Logon triggers fire whenever a LOGON event occurs on the server.
| Note | Logon triggers are new to SQL Server 2005 Service Pack 2 and consequently are outside the scope of this book in the context of preparing you for the 70-444 exam. For more information about logon triggers, search for the “Logon Trig-gers” topic in SQL Server 2005 Books Online (February 2005) or later. |
You can nest both DML and DDL triggers. Nesting basically means a trigger that modifies another table can spawn another trigger. This obviously brings up the potential problem of creating an infinite loop. Well, by default, triggers are not recursive, but in any case there is a finite limit to the nesting level, which has not changed since the SQL Server 6.0 days.
| Note | You can nest DML and DDL triggers up to 32 levels. |
Nested triggers are turned on by default. You can turn this feature off, but be cautious because it applies globally to the entire SQL Server instance:
EXEC sp_configure 'nested_triggers',0 RECONFIGURE
You can disable both DML and DDL triggers, which can be a common requirement in database solutions. The syntax for disabling a trigger is as follows:
DISABLE TRIGGER { [ schema . ] trigger_name [ ,...n ] | ALL } ON { object_name | DATABASE | ALL SERVER } [ ; ] -
To disable all DDL triggers at the server level, you can execute the following:
DISABLE TRIGGER ALL ON ALL SERVER GO
| Tip | You can query the sys.triggers and sys.server_triggers catalog views to find out more information about the triggers that exist in your database solution and their states. |
You’ll now look at how to implement DML and DDL triggers.
Implementing DML Triggers
DML triggers fire whenever an INSERT, UPDATE, or DELETE operation occurs on a table or view. You can define multiple triggers on the same table; however, remember that you can only partially control the execution order. You can also define a trigger to fire multiple actions. DML triggers are versatile.
| Tip | Implement only what needs to be done in triggers. Don’t forget that your trig-ger(s) will fire every time that DML operation occurs, which can potentially impact performance. |
The syntax for creating DML triggers is as follows:
CREATE TRIGGER [ schema_name . ]trigger_name ON { table | view } [ WITH <dml_trigger_option> [ ,...n ] ] { FOR | AFTER | INSTEAD OF } { [ INSERT ] [ , ] [ UPDATE ] [ , ] [ DELETE ] } [ WITH APPEND ] [ NOT FOR REPLICATION ] AS { sql_statement [ ; ] [ ...n ] | EXTERNAL NAME <method specifier [ ; ] > } <dml_trigger_option> ::= [ ENCRYPTION ] [ EXECUTE AS Clause ] <method_specifier> ::= assembly_name.class_name.method_name
Determining the Order of Execution
When implementing triggers, it is critical to understand the order of execution of triggers within the database. Figure 4.7 shows the order in which triggers are fired in relation to other events in a DML operation.
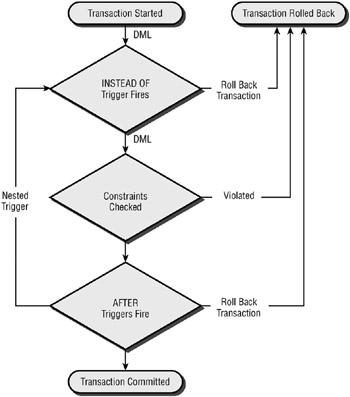
Figure 4.7: Trigger execution order
You need to consider this execution order when designing your trigger architecture. Another important consideration is the order in which multiple triggers fire for a given action.
You can’t really “fully” control the order in which triggers fire, in which case you might be better off recoding multiple triggers into a single, longer, sequential trigger.
| Note | You can use the sp_settriggerorder system stored procedure to set the first and last trigger. |
AFTER DML Triggers
AFTER DML triggers have always been available with SQL Server. They are the default DML trigger type.
By default, DML triggers within a database cannot call themselves recursively. To turn on recursive triggers, you need to enable them at the database level using the following syntax:
ALTER DATABASE database_name SET RECURSIVE_TRIGGERS ON
AFTER DML triggers are your standard triggers that you use to perform the majority of your database actions. Don’t forget that these actions can pretty much do whatever you want within the databases, within other databases on the same SQL Server 2005 instance, and potentially within databases on other SQL Server instances.
The following example shows a delete trigger that automatically “moves” the deleted data into a table, thereby allowing the DBA to “undelete” data if required:
USE Adventureworks ; GO -- Create a table to store deleted customers CREATE TABLE [Audit].[tbl_DeletedCustomer] ( [CustomerID] INT NOT NULL, [TerritoryID] INT NULL, [AccountNumber] VARCHAR(10) NOT NULL, [CustomerType] NCHAR(1) NOT NULL, [rowguid] UNIQUEIDENTIFIER NOT NULL, [ModifiedDate] DATETIME NOT NULL, -- Extra Auditing Columns [HostName] VARCHAR(50) NOT NULL, [UserName] VARCHAR(50) NOT NULL, [DateDeletion] SMALLDATE NOT NULL ) GO -- CREATE TRIGGER [trg_DeletedCustomer] ON [Sales].[Customer] FOR DELETE AS INSERT [Audit]. [tbl_DeletedCustomer] ( ) SELECT CustomerId, TerritoryId, AccountNumber, CustomerType, Rowguid, ModifiedDate, HOST_NAME(), USER_NAME(), GETDATE() FROM deleted GO
INSTEAD OF DML Triggers
SQL Server 2000 introduced the concept of INSTEAD OF DML triggers. Unlike AFTER DML triggers, these execute before the actual DML operation. The other important difference is that INSTEAD OF DML triggers can be bound to views, so developers use them to rewrite DML operations. The classic example in SQL Server 2000 was to use INSTEAD OF triggers when implementing updatable partitioned views.
However, any action is possible. The important fact to remember with INSTEAD OF DML triggers is that they fire before the actual DML operation, so before the database engine starts to log the individual steps that make up the DML operation in the database’s transaction log. So the obvious tip is to try to use INSTEAD OF DML triggers instead of AFTER DML triggers because they will fire more quickly and potentially do not do any needless work in the transaction log if you decide to roll back the transaction.
Exercise 4.4 will demonstrate the power of these types of triggers.
Exercise 4.4: Implementing INSTEAD OF Triggers
Here you’ll look a simple example (a proof of concept, really) of where you might want to use an INSTEAD OF trigger.
-
Open SQL Server Management Studio, and connect to your SQL Server 2005 instance using Windows authentication.
-
Click the New Query toolbar button to open a new query window.
-
Type the following T-SQL code, and execute it:
USE tempdb ; GO -- Create underlying table CREATE TABLE [tbl_Products] ( ProductNumber INT NOT NULL IDENTITY (1,1), Product VARCHAR(50) NOT NULL, Price MONEY NULL ) GO -- Insert some data INSERT [tbl_Products] VALUES ('Muffin', $69) INSERT [tbl_Products] VALUES ('Pink Silly Cow', NULL) INSERT [tbl_Products] VALUES ('Cherry Cheesecake', $150) GO -- Create view which calculates the GST price CREATE VIEW [viw_Products] AS SELECT ProductNumber, Product, Price, (Price * 1.1) AS GSTPrice -- Goods & Services Tax FROM [tbl_Products] GO -- Test the view SELECT * FROM [viw_Products] GO
-
Try to modify the [Product] column of the view. You should have no problems; type the following T-SQL code, and execute it:
UPDATE [viw_Products] SET Product = 'Strawberry Cheesecake' WHERE ProductNumber = 3
-
However, let’s see what happens when you try to modify the [GSTPrice] field. Type the following T-SQL code, and execute it:
UPDATE [viw_Products] SET GSTPrice = $110 WHERE ProductNumber = 2
-
As expected, you get the following error message because you cannot modify a derived/ calculated field:
Msg 4406, Level 16, State 1, Line 2 Update or insert of view or function 'viw_Products' failed because it contains a derived or constant field.
-
A potential solution in this case (but not necessarily a good one) is to rewrite the DML operation on the fly. You can do this via an INSTEAD OF DML trigger. Type the following T-SQL code, and execute it:
ALTER TRIGGER [trg_ReUpdate] ON [viw_Products] INSTEAD OF UPDATE AS SET NOCOUNT ON IF UPDATE(GSTPrice) UPDATE [tbl_Products] -- Tibor will hate this ;o) SET Price = ((i.GSTPrice * 10)/11) FROM tbl_Products AS p JOIN inserted AS i ON p.ProductNumber = i.ProductNumber GO
-
Let’s see what happens now if you try to update the [GSTPrice] field. Type the following T-SQL code, and execute it:
UPDATE viw_Products SET GSTPrice = $110 WHERE ProductNumber = 2
-
You do not get the error message! You have modified the record successfully, so look at the view now. Type the following T-SQL code, and execute it:
SELECT * FROM [viw_Products] GO
-
As you can see, you have in effect really modified the [Price] column, not the calculated [GSTPrice] column. Now, this is not necessarily a good idea, but the exercise did show how you can use INSTEAD OF DML triggers.
Implementing DDL Triggers
DDL triggers are a new addition in SQL Server 2005. Basically, DDL triggers fire whenever certain CREATE, ALTER, DROP, GRANT, DENY, REVOKE, and UPDATE STATISTICS statements execute. Compared to their cousins, DDL triggers are geared more toward DBAs and security administrators.
DDLs represent a great way of setting up a real-time database monitoring solution. The other nice thing about them is that they cannot be bypassed by shutting down something because they are so closely tied to the database. Although that does come at a price, you can potentially slow down transactions, as with DML triggers.
The syntax for creating a DDL trigger is as follows:
CREATE TRIGGER trigger_name ON { ALL SERVER | DATABASE } [ WITH <ddl_trigger_option> [ ,...n ] ] { FOR | AFTER } { event_type | event_group } [ ,...n ] AS { sql_statement [ ; ] [ ...n ] | EXTERNAL NAME < method specifier > [ ; ] } <ddl_trigger_option> ::= [ ENCRYPTION ] [ EXECUTE AS Clause ] <method_specifier> ::= assembly_name.class_name.method_name Unlike DML triggers, DDL triggers have two separate scopes at which they can fire:
-
Server scope These events occur at the SQL Server instance level.
-
Database scope These events occur at each individual database instance level.
| Note | When working with DDL triggers, it is important to identify the correct scope at which you should be working. |
You can create DDL triggers that fire whenever certain DDL operations occur at the server level. The following list shows the trigger events at this server level:
-
DDL_SERVER_LEVEL_EVENTS: CREATE_DATABASE, ALTER_DATABASE, DROP_DATABASE
-
DDL_ENDPOINT_EVENTS: CREATE_ENDPOINT, ALTER_ENDPOINT, DROP_ ENDPOINT
-
DDL_SERVER_SECURITY_EVENTS
-
DDL_AUTHORIZATION_SERVER_EVENTS: ALTER_AUTHORIZATION_ SERVER
-
DDL_GDR_SERVER_EVENTS: GRANT_SERVER, DENY_SERVER, REVOKE_ SERVER
-
DDL_LOGIN_EVENTS: CREATE_LOGIN, ALTER_LOGIN, DROP_LOGIN
You can also define DDL triggers at the database scope. The following list shows the events against which you can define DDL triggers:
-
DDL_DATABASE_LEVEL_EVENTS
-
DDL_ASSEMBLY_EVENTS: CREATE_ASSEMBLY, ALTER_ASSEMBLY, DROP_ ASSEMBLY
-
DDL_DATABASE_SECURITY_EVENTS
-
DDL_APPLICATION_ROLE_EVENTS: CREATE_APPLICATION_ROLE, ALTER_APPLICATION_ROLE, DROP_APPLICATION_ROLE
-
DDL_AUTHORIZATION_DATABASE_EVENTS: ALTER_AUTHORIZATION_ DATABASE
-
DDL_CERTIFICATE_EVENTS: CREATE_CERTIFICATE, ALTER_CERTIFI-CATE, DROP_CERTIFICATE
-
DDL_GDR_DATABASE_EVENTS: GRANT_DATABASE, DENY_DATABASE, REVOKE_DATABASE
-
DDL_ROLE_EVENTS: CREATE_ROLE, ALTER_ROLE, DROP_ROLE
-
DDL_SCHEMA_EVENTS: CREATE_SCHEMA, ALTER_SCHEMA, DROP_ SCHEMA
-
DDL_USER_EVENTS: CREATE_USER, DROP_USER, ALTER_USER
-
DDL_EVENT_NOTIFICATION_EVENTS: CREATE_EVENT_NOTIFICATION, DROP_EVENT_NOTIFICATION
-
DDL_FUNCTION_EVENTS: CREATE_FUNCTION, ALTER_FUNCTION, DROP_FUNCTION
-
-
DDL_PARTITION_EVENTS
-
DDL_PARTITION_FUNCTION_EVENTS: CREATE_PARTITION_FUNCTION, ALTER_PARTITION_FUNCTION, DROP_PARTITION_FUNCTION
-
DDL_PARTITION_SCHEME_EVENTS: CREATE_PARTITION_SCHEME, ALTER_PARTITION_SCHEME, DROP_PARTITION_SCHEME
-
DDL_PROCEDURE_EVENTS: CREATE_PROCEDURE, DROP_PROCEDURE, ALTER_PROCEDURE
-
-
DDL_SSB_EVENTS
-
DDL_CONTRACT_EVENTS: CREATE_CONTRACT, DROP_CONTRACT
-
DDL_MESSAGE_TYPE_EVENTS: CREATE_MSGTYPE, ALTER_MSGTYPE, DROP_MSGTYPE
-
DDL_QUEUE_EVENTS: CREATE_QUEUE, ALTER_QUEUE, DROP_QUEUE
-
DDL_SERVICE_EVENTS: CREATE_SERVICE, DROP_SERVICE, ALTER_SERVICE
-
DDL_REMOTE_SERVICE_BINDING_EVENTS: CREATE_REMOTE_ SERVICE_BINDING, ALTER_REMOTE_SERVICE_BINDING, DROP_ REMOTE_SERVICE_BINDING
-
DDL_ROUTE_EVENTS: CREATE_ROUTE, DROP_ROUTE, ALTER_ROUTE
-
-
DDL_SYNONYM_EVENTS: CREATE_SYNONYM, DROP_SYNONYM
-
DDL_TABLE_VIEW_EVENTS
-
DDL_INDEX_EVENTS: CREATE_INDEX, DROP_INDEX, ALTER_INDEX, CREATE_ XML_INDEX
-
DDL_STATISTICS_EVENTS: CREATE_STATISTICS, UPDATE_STATISTICS, DROP_STATISTICS
-
DDL_TABLE_EVENTS: CREATE_TABLE, ALTER_TABLE, DROP_TABLE
-
DDL_VIEW_EVENTS: CREATE_VIEW, ALTER_VIEW, DROP_VIEW
-
-
DDL_TRIGGER_EVENTS: CREATE_TRIGGER, DROP_TRIGGER, ALTER_TRIGGER
-
DDL_TYPE_EVENTS: CREATE_TYPE, DROP_TYPE
-
DDL_XML_SCHEMA_COLLECTION_EVENTS: CREATE_XML_SCHEMA_COL-LECTION, ALTER_XML_SCHEMA_COLLECTION, DROP_XML_SCHEMA_ COLLECTION
| Note | You can’t use all DDL events in DDL triggers because some events are intended for asynchronous, nontransacted statements only. A good example is the CREATE DATABASE event, which cannot be used in a DDL trigger. In these cases, you have to use event notifications instead. |
Within the body of the trigger, you have access to a structure called EVENTDATA(). You can interrogate this to extract information about the DDL activity that just occurred.
| Note | A common question with DDL triggers is, what does the EVENTDATA() contain? The answer, as with most things, is an unsatisfactory “it depends.” The structure is actually represented as XML because it contains different elements depending on the scope being covered and the particular event being processed. |
Implementing DDL triggers is a relatively straightforward process, as shown in Exercise 4.5.
Exercise 4.5: Implementing DDL Triggers
Once you have deployed your database solution to your production environment, you do not want developers to be able to create tables in the database solution-no matter what. Consequently, you have decided to implement DDL triggers to prevent the CREATE TABLE statement within the database.
-
Open SQL Server Management Studio, and connect to your SQL Server 2005 instance using Windows authentication.
-
Click the New Query toolbar button to open a new query window.
-
Type the following T-SQL code, and execute it:
USE AdventureWorks ; GO -- Create DDL trigger CREATE TRIGGER [trg_UnauthorizedDDL] ON DATABASE FOR CREATE_TABLE AS RAISERROR ('*** Unauthorized DDL Operation. ***',16,1) ROLLBACK TRANSACTION GO -
It’s time to test the DDL trigger. Try to create a table within the database. Type the fol-lowing T-SQL code, and execute it:
CREATE TABLE [tbl_Futility] ( VeryLongColumnName INT, EvenLongerColumnName BIGINT ) GO
-
Success! You should see the following error message:
Msg 50000, Level 16, State 1, Procedure trg_UnauthorizedDDL, Line 4 *** Unauthorized DDL Operation *** Msg 3609, Level 16, State 2, Line 1 The transaction ended in the trigger. The batch has been aborted.
-
To clean up your SQL Server instance, you will need to execute the following code:
-- Clean up DROP TRIGGER [trg_UnauthorizedDDL] ON DATABASE GO
Implementing Event Notifications
I (Victor) am sitting here in Lusaka (Zambia) discussing a project with Anton Delsink, an excellent Microsoft Certified Trainer who concentrates more on the development space. (You can check out his blog at http://codedebate.spaces.live.com.) In any case, I asked him what notifications were in SQL Server 2005, and we had a bit of a laugh about how one can confuse the market. It’s not exactly an easy question to answer because SQL Server 2005 has query notifications, Notification Services of course, and what we are interested in this chapter-event notifications.
Event notifications are a completely new feature of SQL Server 2005 that are designed to help with auditing activity (or events) within your database solution. Unlike DDL triggers (which are closely tied to the relational database engine), event notifications rely on peripheral SQL Server 2005 technology. Because event notifications do not “piggyback” the normal functioning of the SQL Server 2005 database engine, they are less invasive because of their asynchronous architecture.
The syntax for creating event notifications in SQL Server 2005 is as follows:
CREATE EVENT NOTIFICATION event_notification_name ON { SERVER | DATABASE | QUEUE queue_name } [ WITH FAN_IN ] FOR { event_type | event_group } [ ,...n ] TO SERVICE 'broker_service' , { 'broker_instance_specifier' | 'current database' } [ ; ] Fundamentally, event notifications react to specific events within the database (or server) and send a message through the Service Broker service. We won’t cover Service Broker in this book (though see the “Service Broker” sidebar about it), but it’s sufficient to say that the Service Broker component of SQL Server 2005 facilitates asynchronous communication in a loosely coupled message queuing system.
| Note | Event notifications can also occur in response to a SQL trace event. |
Figure 4.8 shows the close relationship between event notifications and the Service Broker service in SQL Server Management Studio.
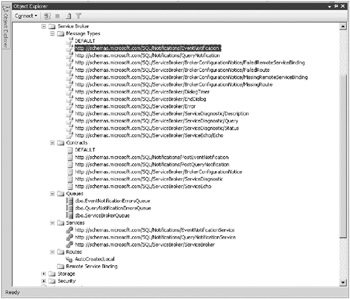
Figure 4.8: Event notification components in the Service Broker service
As you can see, the Service Broker has a number of elements you need to understand. We’ll go through them briefly to help provide a context for their purpose with respect to event notifications:
-
Service A service is a Service Broker set of tasks that form the fundamental framework for processing messages. In the case of event processing, some of the links are even predefined for you, such as the contract and the message type.
-
Contract A contract forms part of a service. It is something you agree to offer as part of a service, and the service may consist of many contracts. In Service Broker terms, it is an agreement to process a message of a predefined type. In the case of event notification, the contract is predefined for you.
-
Message Type A message type is a predefined form that contains defined data points, which can be populated by a process to facilitate the request or provision of a service. In the case of event notifications, the message type is predefined for you.
-
Queue A queue is a storage location for messages to be processed or messages that have been processed.
-
Route A route is a means by which the service will be provided; the service could be provided either locally or at a remote site.
What are the benefits of using event notifications over what you have seen so far? Well, if your solution requirements are more to monitor what is happening than to control events, then you should consider using event notifications instead of DDL triggers because they’re “lightweight.”
Because of their asynchronous architecture, they will potentially not have the same performance impact as triggers, which run in a transaction space, potentially heavily utilizing the database’s transaction log, and so on. Table 4.7 shows the main differences between triggers and event notifications.
| Triggers | Event Notifications |
|---|---|
| DDL triggers respond to DDL operations. DML triggers respond to DML operations. | Event notifications respond to DDL events and a subset of the SQL trace events. |
| Triggers are processed synchronously within transaction space. | Event notifications are processed asynchronously outside transaction space. |
| Triggers can be rolled back. | Event notifications cannot be rolled back. |
| Triggers can run T-SQL or managed code. | Event notifications send XML messages to the Service Broker. |
To which events can event notifications react? As you would expect, quite a few exist, so you should take some time to become familiar with them. The following list represents the set of server-level events:
-
DDL_SERVER_LEVEL_EVENTS: CREATE_DATABASE, ALTER_DATABASE, DROP_DATABASE
-
DDL_ENDPOINT_EVENTS: CREATE_ENDPOINT, ALTER_ENDPOINT, DROP_ ENDPOINT
-
DDL_SERVER_SECURITY_EVENTS: ADD_ROLE_MEMBER, ADD_SERVER_ ROLE_MEMBER, DROP_ROLE_MEMBER, DROP_SERVER_ROLE_MEMBER
-
DDL_AUTHORIZATION_SERVER_EVENTS: ALTER_AUTHORIZATION_ SERVER
-
DDL_GDR_SERVER_EVENTS: GRANT_SERVER, DENY_SERVER, REVOKE_ SERVER
-
DDL_LOGIN_EVENTS: CREATE_LOGIN, ALTER_LOGIN, DROP_LOGIN
-
The following list represents the set of database-level events:
-
DDL_DATABASE_LEVEL_EVENTS
-
DDL_ASSEMBLY_EVENTS: CREATE_ASSEMBLY, ALTER_ASSEMBLY, DROP_ ASSEMBLY
-
DDL_DATABASE_SECURITY_EVENTS
-
DDL_APPLICATION_ROLE_EVENTS: CREATE_APPLICATION_ROLE, ALTER_APPLICATION_ROLE, DROP_APPLICATION_ROLE
-
DDL_AUTHORIZATION_DATABASE_EVENTS: ALTER_AUTHORIZATION_ DATABASE
-
DDL_CERTIFICATE_EVENTS: CREATE_CERTIFICATE, ALTER_CERTIFI-CATE, DROP_CERTIFICATE
-
DDL_GDR_DATABASE_EVENTS: GRANT_DATABASE, DENY_DATABASE, REVOKE_DATABASE
-
DDL_ROLE_EVENTS: CREATE_ROLE, ALTER_ROLE, DROP_ROLE
-
DDL_SCHEMA_EVENTS: CREATE_SCHEMA, ALTER_SCHEMA, DROP_ SCHEMA
-
DDL_USER_EVENTS: CREATE_USER, DROP_USER, ALTER_USER
-
DDL_EVENT_NOTIFICATION_EVENTS: CREATE_EVENT_NOTIFICATION, DROP_EVENT_NOTIFICATION
-
DDL_FUNCTION_EVENTS: CREATE_FUNCTION, ALTER_FUNCTION, DROP_FUNCTION
-
-
DDL_PARTITION_EVENTS
-
DDL_PARTITION_FUNCTION_EVENTS: CREATE_PARTITION_FUNCTION, ALTER_PARTITION_FUNCTION, DROP_PARTITION_FUNCTION
-
DDL_PARTITION_SCHEME_EVENTS: CREATE_PARTITION_SCHEME, ALTER_PARTITION_SCHEME, DROP_PARTITION_SCHEME
-
DDL_PROCEDURE_EVENTS: CREATE_PROCEDURE, DROP_PROCEDURE, ALTER_PROCEDURE
-
-
DDL_SSB_EVENTS
-
DDL_CONTRACT_EVENTS: CREATE_CONTRACT, DROP_CONTRACT
-
DDL_MESSAGE_TYPE_EVENTS: CREATE_MSGTYPE, ALTER_MSGTYPE, DROP_MSGTYPE
-
DDL_QUEUE_EVENTS: CREATE_QUEUE, ALTER_QUEUE, DROP_QUEUE
-
DDL_SERVICE_EVENTS: CREATE_SERVICE, DROP_SERVICE, ALTER_SER-VICE
-
DDL_REMOTE_SERVICE_BINDING_EVENTS: CREATE_REMOTE_SERVICE_ BINDING, ALTER_REMOTE_SERVICE_BINDING, DROP_REMOTE_SERVICE_ BINDING
-
DDL_ROUTE_EVENTS: CREATE_ROUTE, DROP_ROUTE, ALTER_ROUTE
-
-
DDL_SYNONYM_EVENTS: CREATE_SYNONYM, DROP_SYNONYM
-
DDL_TABLE_VIEW_EVENTS
-
DDL_INDEX_EVENTS: CREATE_INDEX, DROP_INDEX, ALTER_INDEX, CREATE_ XML_INDEX
-
DDL_STATISTICS_EVENTS: CREATE_STATISTICS, UPDATE_STATISTICS, DROP_STATISTICS
-
DDL_TABLE_EVENTS: CREATE_TABLE, ALTER_TABLE, DROP_TABLE
-
DDL_VIEW_EVENTS: CREATE_VIEW, ALTER_VIEW, DROP_VIEW
-
-
DDL_TRIGGER_EVENTS: CREATE_TRIGGER, DROP_TRIGGER, ALTER_TRIG-GER
-
DDL_TYPE_EVENTS: CREATE_TYPE, DROP_TYPE
-
DDL_XML_SCHEMA_COLLECTION_EVENTS: CREATE_XML_SCHEMA_COL-LECTION, ALTER_XML_SCHEMA_COLLECTION, DROP_XML_SCHEMA_COL-LECTION
Additionally, the following list represents the set of SQL trace events:
-
TRC_CLR: ASSEMBLY_LOAD
-
TRC_DATABASE: DATA_FILE_AUTO_GROW, DATA_FILE_AUTO_SHRINK, DATABASE_MIRRORING_STATE_CHANGE, LOG_FILE_AUTO_GROW, LOG_ FILE_AUTO_SHRINK
-
TRC_DEPRECATION: DEPRECATION_ANNOUNCEMENT, DEPRECATION_ FINAL_SUPPORT
-
TRC_ERRORS_AND_WARNINGS: BLOCKED_PROCESS_REPORT, ERRORLOG, EVENTLOG, EXCEPTION, EXCHANGE_SPILL_EVENT, EXECUTION_WARN-INGS, HASH_WARNING, MISSING_COLUMN_STATISTICS, MISSING_JOIN_ PREDICATE, SORT_WARNINGS, USER_ERROR_MESSAGE
-
TRC_FULL_TEXT: FT_CRAWL_ABORTED, FT_CRAWL_STARTED, FT_CRAWL_ STOPPED
-
TRC_LOCKS: DEADLOCK_GRAPH, LOCK_DEADLOCK, LOCK_DEADLOCK_ CHAIN, LOCK_ESCALATION
-
TRC_OBJECTS: OBJECT_ALTERED, OBJECT_CREATED, OBJECT_DELETED
-
TRC_OLEDB: OLEDB_CALL_EVENT, OLEDB_DATAREAD_EVENT, OLEDB_ ERRORS, OLEDB_PROVIDER_INFORMATION, OLEDB_QUERYINTERFACE_ EVENT
-
TRC_PERFORMANCE: SHOWPLAN_ALL_FOR_QUERY_COMPILE, SHOWPLAN_XML, SHOWPLAN_XML_FOR_QUERY_COMPILE, SHOWPLAN_ XML_STATISTICS_PROFILE
-
TRC_QUERY_NOTIFICATIONS: QN_DYNAMICS, QN_PARAMETER_TABLE, QN_SUBSCRIPTION, QN_TEMPLATE
-
TRC_SECURITY_AUDIT: AUDIT_ADD_DB_USER_EVENT, AUDIT_ADDLOGIN_ EVENT, AUDIT_ADD_LOGIN_TO_SERVER_ROLE_EVENT, AUDIT_ADD_ MEMBER_TO_DB_ROLE_EVENT, AUDIT_ADD_ROLE_EVENT, AUDIT_APP_ ROLE_CHANGE_PASSWORD_EVENT, AUDIT_BACKUP_RESTORE_EVENT, AUDIT_CHANGE_AUDIT_EVENT, AUDIT_CHANGE_DATABASE_OWNER, AUDIT_DATABASE_MANAGEMENT_EVENT, AUDIT_DATABASE_OBJECT_ ACCESS_EVENT, AUDIT_DATABASE_OBJECT_GDR_EVENT, AUDIT_ DATABASE_OBJECT_MANAGEMENT_EVENT, AUDIT_DATABASE_OBJECT_ TAKE_OWNERSHIP_EVENT, AUDIT_DATABASE_OPERATION_EVENT, AUDIT_ DATABASE_PRINCIPAL_IMPERSONATION_EVENT, AUDIT_DATABASE_ PRINCIPAL_MANAGEMENT_EVENT, AUDIT_DATABASE_SCOPE_GDR_EVENT, AUDIT_DBCC_EVENT, AUDIT_LOGIN, AUDIT_LOGIN_CHANGE_PASSWORD_ EVENT, AUDIT_LOGIN_CHANGE_PROPERTY_EVENT, AUDIT_LOGIN_FAILED, AUDIT_LOGIN_GDR_EVENT, AUDIT_LOGOUT, AUDIT_SCHEMA_OBJECT_ ACCESS_EVENT, AUDIT__SCHEMA_OBJECT_GDR_EVENT, AUDIT_SCHEMA_ OBJECT_MANAGEMENT_EVENT, AUDIT_SCHEMA_OBJECT_TAKE_ OWNERSHIP_EVENT, AUDIT_SERVER_ALTER_TRACE_EVENT, AUDIT_ SERVER_OBJECT_GDR_EVENT, AUDIT_SERVER_OBJECT_MANAGEMENT_ EVENT , AUDIT_SERVER_OBJECT_TAKE_OWNERSHIP_EVENT, AUDIT_ SERVER_OPERATION_EVENT, AUDIT_SERVER_PRINCIPAL_ IMPERSONATION_EVENT, AUDIT_SERVER_PRINCIPAL_MANAGEMENT_ EVENT, AUDIT_SERVER_SCOPE_GDR_EVENT
-
TRC_SERVER: MOUNT_TAPE, SERVER_MEMORY_CHANGE, TRACE_ FILE_CLOSE
-
TRC_STORED_PROCEDURE: SP_CACHEINSERT, SP_CACHEMISS, SP CACHEREMOVE, SP_RECOMPILE
-
TRC_TSQL: SQL_STMTRECOMPILE, XQUERY_STATIC_TYPE
-
TRC_USER_CONFIGURABLE: USERCONFIGURABLE_0, USERCONFIGURABLE_ 1, USERCONFIGURABLE_2, USERCONFIGURABLE_3, USERCONFIGURABLE_ 4, USERCONFIGURABLE_5, USERCONFIGURABLE_6, USERCONFIGURABLE_7, USERCONFIGURABLE_8, USERCONFIGURABLE_9
So, we’ll finish up with an example of a server-level event notification and a database-level event notification. We’ll show how to create a server-level notification called [CreateLoginEvent] that will send event information to the [NotifyService] service whenever the CREATE LOGIN statement executes. Additionally, we’ll show how to create a database-level notification called [TableOrViewEvent] that will send event information whenever a table or view is modified through a DDL operation.
-- Create queue to receive messages. CREATE QUEUE NotifyQueue GO -- Create service on queue that references EN contract. CREATE SERVICE NotifyService ON QUEUE NotifyQueue ([http://schemas.microsoft.com/SQL/Notifications/PostEventNotification]); GO -- Create route on service to define the address to which -- the Service Broker will sends messages. CREATE ROUTE NotifyRoute WITH SERVICE_NAME = 'NotifyService', ADDRESS = 'LOCAL'; GO --Create the server-level event notification. CREATE EVENT NOTIFICATION CreateLoginEvent ON SERVER FOR CREATE_LOGIN TO SERVICE 'NotifyService', 'current database' GO --Create the database-level event notification. CREATE EVENT NOTIFICATION TableOrViewEvent ON DATABASE FOR DDL_TABLE_VIEW_EVENTS TO SERVICE 'NotifyService', '8140e771-3a4t-4479-8pus0-81008sy17!84' GO
| Note | In case you’re interested, the project in Zambia that Anton and I were discussing was http://www.healthyafrica.net. |
EAN: 2147483647
Pages: 146