Troubleshooting Instance Performance
We’ll now drill down into the SQL Server 2005 instance and show what tools you have for troubleshooting performance problems. Of course, there will be some overlap with what we have discussed already because the SQL Server 2005 instance is using the same physical server.
Troubleshooting Tools
You have access to quite a large set of tools, on top of the ones we have already introduced and discussed, that you can use to troubleshoot the performance of your SQL Server 2005 instance. Make sure you remember all of them and become familiar with what they return and when it is appropriate to use them, especially the error log files, which always seem to be forgotten.
Summary Report Pane
The Summary Report pane is a tool that is often overlooked by DBAs new to SQL Server 2005. It really should be the “first port of call” when troubleshooting your SQL Server 2005 instance.
The Summary Report pane has a number of summary reports at the SQL Server instance level:
-
Server Dashboard The Server Dashboard report provides an overview of your SQL Server 2005 instance, including configuration and activity details. Figure 1.5 shows the Server Dashboard.
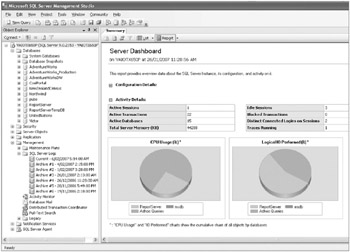
Figure 1.5: Server Dashboard report -
Configuration Changes History The Configuration Changes History report provides a history of all sp_configure and trace flag changes recorded by the default trace.
-
Schema Changes History The Schema Changes History report provides a history of all committed Data Definition Language (DDL) statements recorded by the default trace.
-
Scheduler Health The Scheduler Health report provides detailed activity data about each scheduler. Figure 1.6 shows the Scheduler Health report.
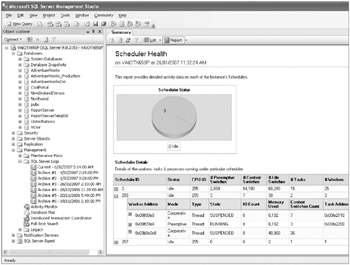
Figure 1.6: Scheduler Health report -
Memory Consumption The Memory Consumption report provides detailed information about the consumption of memory by the various SQL Server 2005 components. Figure 1.7 shows the Memory Consumption report.
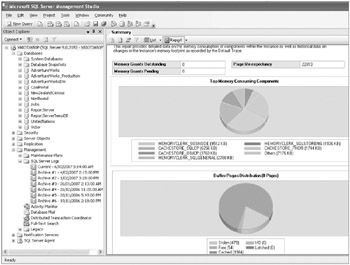
Figure 1.7: Memory Consumption report -
Activity There are several different Activity reports based on the following:
-
All blocking transactions
-
All cursors
-
Top cursors
-
All sessions
-
Top sessions
-
Dormant sessions
-
Top connections
Tip The All Blocking Transactions Activity report allows you to quickly identify blocking transactions within your SQL Server instance.
-
-
Top Transactions Three different reports report information about transactions, each based on one of the following:
-
Age
-
Blocked transactions
-
Locks
-
-
Performance There are several different Performance reports based on the following:
-
Batch execution statistics
-
Object execution statistics
-
Top queries by average CPU time
-
Top queries by average I/O
-
Top queries by total CPU time
-
Top queries by total I/O
-
-
Service Broker Statistics The Service Broker Statistics report shows basic information about Service Broker activity.
-
Transaction Log Shipping Status The Transaction Log Shipping Status report shows the status of your log shipping configuration, depending on whether your SQL Server 2005 instance is a primary, secondary, or monitor server.
Error Logs
Another obvious starting point when troubleshooting instance-level performance-related problems is to look at the error log files generated by SQL Server 2005. You’d be surprised how often these potentially rich sources of information are overlooked. You will be predominantly interested in two main logs, both of which are located in the C:\Program Files\Microsoft SQL Server\MSSQL.x\MSSQL\LOG directory:
-
The SQL Server error log (ERRORLOG.x) is used by the SQL Server 2005 database engine and thus reflects events and errors that are related to its operations.
-
The SQL Server Agent error log (SQLAGENT.x) is used by the SQL Server Agent and typically logs events and errors that are related to the execution of scheduled and on-demand jobs in SQL Server 2005.
One of the great new features in SSMS is the ability to view multiple log files concurrently through the Log File Viewer, as shown in Figure 1.8.
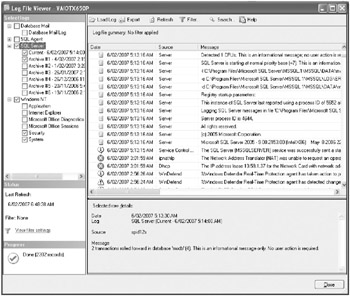
Figure 1.8: Log File Viewer
| Tip | Don’t let your SQL Server 2005 error log grow out of control! One of the most annoying things when you have a performance crisis is waiting several minutes for the SQL Server log to load in whatever graphical user interface (GUI) tool you are using. You can use the sp_cycle_errorlog system stored procedure to periodically restart the log without having to shut down and restart SQL Server 2005. |
Default Trace
If you installed SQL Server 2005 using the defaults and you look in the C:\Program Files\ Microsoft SQL Server\MSSQL.x\MSSQL\LOG directory, you will notice a number of .trc files that represent a “new” feature of SQL Server 2005, the default trace. This default trace, which is enabled by default, provides a log mainly of the activity of and changes to the configuration options. You can open the trace file in SQL Server Profiler.
The following query shows you how to open this default trace using T-SQL:
SELECT * FROM fn_trace_gettable ('C:\Program Files\Microsoft SQL Server\MSSQL.1\MSSQL\LOG\log.trc', default) ; GO However, the location of your default trace may differ, depending on the installation, so this is a better query:
SELECT * FROM fn_trace_gettable (1) ; GO
| Note | The default trace has the id value of 1. |
Activity Monitor
The Activity Monitor available in SSMS is the replacement for the Current Activity tool found in previous versions of SQL Server. Personally we preferred Current Activity because it had richer functionality, but we have gotten used to the Activity Monitor.
The Activity Monitor basically shows all the current connections made to your SQL Server 2005 instance, who they are, what database they are using, what they are doing, and a lot more. It is an easy-to-use and handy utility for quickly seeing what is going on at the instance level. As you can see from Figure 1.9, it has three different “points of view”:
-
Process Info
-
Locks by Process
-
Locks by Object
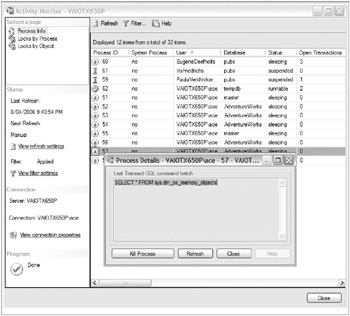
Figure 1.9: Activity Monitor
Don’t forget that the Activity Monitor is not a real-time utility-nor would you really want it to be, because of the potential overhead on your SQL Server 2005 solution. So, pay attention to the date and time shown on the left of the Activity Monitor windows. If you are not seeing what you expect, just refresh the console.
| Tip | In SQL Server 2005 you can set the Activity Monitor to autorefresh every x number of seconds. |
System Stored Procedures
SQL Server has always come with a comprehensive set of system stored procedures that you can use to determine the state of your SQL Server 2005 instance and to troubleshoot and performance tune your database solutions. These system stored procedures are typically located in the resource system database.
| Tip | If you want to learn more about SQL Server and become a real guru, we highly recommend browsing the source code of various system stored procedures where you’ll learn more about the internals of SQL Server, undocumented features, and good programming techniques. You’ll also see examples of poor programming techniques. |
Table 1.1 describes a number of system stored procedures that you can use for performance tuning and troubleshooting problems.
| System Stored Procedure | Description |
|---|---|
| sp_who | Returns information about current SQL Server users and processes. You can replace it with the sys.dm_exec_sessions and sys.dm_exec_requests DMVs. |
| sp_lock | Returns locking information such as the object ID, index ID, type of lock, and type or resource to which the lock applies. You can replace it with the sys.dm_tran_locks DMV. |
| sp_monitor | Returns statistic information such as CPU usage or I/O usage. |
Figure 1.10 shows the output of the sp_monitor system stored procedure.
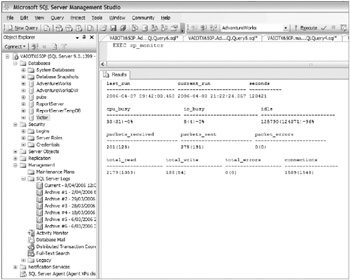
Figure 1.10: Output of sp_monitor
System Functions
SQL Server 2005 has several built-in statistical and system functions that display status information. Although not commonly used, they still provide some useful, typically global information. Table 1.2 shows a number of system functions available in SQL Server 2005. Figure 1.11 shows the output of the fn_virtualfilestats system function.
| System Function | Description |
|---|---|
| @@CONNECTIONS | Returns the number of attempted connections |
| @@TOTAL_READ | Returns the number of disk reads by SQL Server |
| @@PACK_SENT | Returns the number of packets sent by SQL Server |
| fn_virtualfilestats | Returns the I/O statistics for database files |
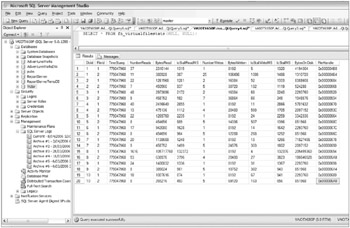
Figure 1.11: Output of fn_virtualfilestats
Trace Flags
You can use SQL Server trace flags to enhance the information available for diagnostic or troubleshooting purposes such as memory allocation, for example. Table 1.3 shows some documented SQL Server trace flags.
| Trace Flag | Description |
|---|---|
| 1204 | Returns the type of locks participating in the deadlock and the current command affected |
| 1211 | Disables lock escalation based on the memory pressure/number of locks |
| 1224 | Disables lock escalation based on the number of locks |
| 2528 | Disables parallel checking of objects by DBCC CHECKDB, DBCC CHECKFILEGROUP, and DBCC CHECKTABLE |
| 3625 | Limits the information returned in error messages |
Trace flags are typically set on and off via the DBCC TRACEON and DBCC TRACEOFF commands. Alternatively, you can use the /T SQL Server service start-up option. Use the DBCC TRACESTATUS command to see which trace flags have been set.
| Warning | Be careful with using trace flags because they are typically undocumented and officially unsupported. |
Instance-Level DMVs
Most of the DMVs in SQL Server 2005 return data about how your database engine and other SQL Server 2005 components are executing. We’ll now go through the various DMVs to help you become familiar with what they do.
Common Language Runtime DMVs
The DMVs described in Table 1.4 will return more information about the common language runtime (CLR) environment.
| DMV | Description |
|---|---|
| sys.dm_clr_appdomains | Returns a row for each application domain in the server. An application domain (AppDomain) is a construct in the Microsoft .NET Framework CLR that is the unit of isolation for an application. |
| sys.dm_clr_loaded_assemblies | Returns a row for each managed user assembly loaded into the server address space. |
| sys.dm_clr_properties | Returns a row for each property related to CLR integration. |
| sys.dm_clr_tasks | Returns a row for all CLR tasks that are currently running. A T-SQL batch that contains a reference to a CLR routine creates a separate task for executing all the managed code in that batch. Multiple statements in the batch that require managed code execution use the same CLR task. |
Full-Text Index DMVs
You can use the DMVs described in Table 1.5 to find out more with respect to the full-text indexes and engine.
| DMV | Description |
|---|---|
| sys.dm_fts_active_catalogs | Returns information about the full-text catalogs that have some population activity in progress on the server |
| sys.dm_fts_crawl_ranges | Returns information about the specific ranges related to a full-text index population currently in progress |
| sys.dm_fts_crawls | Returns information about the full-text index populations currently in progress |
| sys.dm_fts_memory_buffers | Returns information about memory buffers belonging to a specific memory pool that are used as part of a full-text crawl or a full-text crawl range |
| sys.dm_fts_memory_pools | Returns information about the memory pools used as part of a full-text crawl or a full-text crawl range |
I/O DMVs
The DMVs described in Table 1.6 will return I/O-related information.
| DMV | Description |
|---|---|
| sys.dm_io_backup_tapes | Returns a list of backup devices and the status of mount requests for backups |
| sys.dm_io_cluster_shared_drives | Returns the drive name of the shared drives if the current server is a clustered server |
| sys.dm_io_pending_io_requests | Returns a row for each pending I/O request in SQL Server |
| sys.dm_io_virtual_file_stats | Returns I/O statistics for data and log files |
Query Notification DMVs
The DMV described in Table 1.7 returns information about query notifications.
| DMV | Description |
|---|---|
| sys.dm_qn_subscriptions | Returns information about the active query notifications subscriptions in the server |
Replication DMVs
The set of DMVs described in Table 1.8 will return basic information about your replication environment.
| DMV | Description |
|---|---|
| sys.dm_repl_articles | Returns information about database objects published as articles in a replication topology |
| sys.dm_repl_schemas | Returns information about table columns published by replication |
| sys.dm_repl_tranhash | Returns information about transactions being replicated in a transactional publication |
| sys.dm_repl_traninfo | Returns information about each replicated transaction |
Service Broker DMVs
You can query the DMVs described in Table 1.9 to return more information about the Service Broker component of SQL Server 2005.
| DMV | Description |
|---|---|
| sys.dm_broker_activated_tasks | Returns a row for each stored procedure activated by Service Broker. |
| sys.dm_broker_connections | Returns a row for each Service Broker network connection. |
| sys.dm_broker_forwarded_messages | Returns a row for each Service Broker message that an instance of SQL Server is in the process of forwarding. |
| sys.dm_broker_queue_monitors | Returns a row for each queue monitor in the instance. A queue monitor manages the activation for a queue. |
SQL Operating System DMVs
If you want to learn more about the SQLOS, you should use the DMVs described in Table 1.10.
| DMV | Description |
|---|---|
| sys.dm_os_buffer_descriptors | Returns the buffer pool buffer descriptors that are being used by a database on an instance of SQL Server. |
| sys.dm_os_child_instances | Returns a row for each SQL Server Express user instance that has been created from the parent database. |
| sys.dm_os_cluster_nodes | Returns a row for each node in the virtual server configuration. |
| sys.dm_os_hosts | Returns all the hosts currently registered in an instance of SQL Server. This view also returns the resources that are used by these hosts. |
| sys.dm_os_latch_stats | Returns information about all latch waits organized by class. |
| sys.dm_os_loaded_modules | Returns a row for each module loaded into the server address space. |
| sys.dm_os_memory_cache_clock_hands | Returns the status of each hand for a specific cache clock. |
| sys.dm_os_memory_cache_counters | Returns a snapshot of the health of a cache. |
| sys.dm_os_memory_cache_entries | Returns information about all entries in caches. Use this view to trace cache entries to their associated objects. |
| sys.dm_os_memory_cache_hash_tables | Returns a row for each active cache in the instance of SQL Server. |
| sys.dm_os_memory_clerks | Returns the set of all memory clerks that are currently active in the instance of SQL Server. |
| sys.dm_os_memory_objects | Returns memory objects that are currently allocated by SQL Server. |
| sys.dm_os_memory_pools | Returns a row for each object store in the instance of SQL Server. |
| sys.dm_os_performance_counters | Returns a row per performance object counter maintained by the server. |
| sys.dm_os_schedulers | Returns one row per scheduler in SQL Server where each scheduler is mapped to an individual processor. |
| sys.dm_os_stacks | Is used internally by SQL Server to keep track of debug information. |
| sys.dm_os_sys_info | Returns a miscellaneous set of useful information about the computer and about the resources available to and consumed by SQL Server. |
| sys.dm_os_tasks | Returns one row for each task that is active in the instance of SQL Server. |
| sys.dm_os_threads | Returns a list of all SQL Server operating system threads that are running under the SQL Server process. |
| sys.dm_os_virtual_address_dump | Returns information about a range of pages in the virtual address space of the calling process. |
| sys.dm_os_wait_stats | Returns information about the waits encountered by threads that are in execution. |
| sys.dm_os_waiting_tasks | Returns information about the wait queue of tasks that are waiting on some resource. |
| sys.dm_os_workers | Returns a row for every worker in the system. |
Dedicated Administrator Connection
We’ll end your look at the monitoring tools with some words about the dedicated administrator connection (DAC). The DAC is a special diagnostic connection, typically invoked via the –A switch when using the SQLCMD command-line utility, for administrators to use when SQL Server is not responding to standard connection requests. It is designed to allow DBAs to connect to an “unresponsive” SQL Server 2005 instance and perform diagnostic and troubleshooting commands on it.
Don’t forget to close the DAC, because only one is allowed per SQL Server 2005 instance. Otherwise, you will be blocking all other administrators from using it.
Troubleshooting Methodology
The troubleshooting methodology for your SQL Server 2005 instance will closely follow the one we discussed for your physical server. After all, they are using the same resources. However, as you can see from the following list, we have added the tempdb system database because that is used globally by the SQL Server 2005 instance:
-
Processor
-
Memory
-
I/O
-
The tempdb system database
Again, we’ll go through the different subsystems so you know what you should be looking for and how to resolve it.
Troubleshooting Processor Problems
The main causes for high processor utilization for a SQL Server 2005 instance include the following:
-
Excessive compilations (or recompilations)
-
Inefficient query plans
-
Intraquery parallelism
Otherwise, you will need to determine the cause of the high processor utilization of your SQL Server instance by determining the root cause.
Detecting Processor Problems
The performance object counter model does not have the granularity to show you what internally in SQL Server 2005 is consuming the processor resource. You will have to take advantage of the set of SQLOS DMVs in this case.
The sys.dm_os_schedulers DMV monitors the condition of schedulers or identifies runaway tasks. In this monitoring case, the runnable_tasks_count column is the important one. It represents the number of workers waiting to be scheduled on the runnable queue. If the value is frequently greater than zero, you have a processor problem.
You can use the sys.dm_exec_query_stats DMV to get aggregate performance statistics for cached query plans. Two columns of this DMV can help you identify processor-intensive queries: the execution_count column, which represents the number of times the plan has been executed, and the total_worker_time column, which gives you the total amount of processor time consumed by executions of a plan.
You could have many potential causes for processor bottlenecks, and this is where your knowledge of your database solution becomes critical. It is typically important to talk to the developers of the client application to understand how it works with your SQL Server databases.
Excessive Compilations and Recompilations
Compilations and recompilations of query plans are potentially processor intensive and can have various causes, not just the use of the RECOMPILE option in stored procedure definitions or in the EXECUTE statements. The main reasons for recompilations include the following:
-
The schema, bindings to dependent objects, or permissions have changed.
-
The statistics have sufficiently changed (or been updated explicitly).
-
The data in the tables has “sufficiently” changed.
-
Deferred name resolution.
| Note | SQL Server has had the ability to compile objects that have dependencies against nonexistent objects for quite a while now. It’s a cool feature. Of course, it has now deferred the check to runtime. |
-
A SET option has changed in the batch, including the following:
-
ANSI_NULL_DFLT_OFF
-
ANSI_NULL_DFLT_ON
-
ANSI_NULLS
-
ANSI_PADDING
-
ANSI_WARNINGS
-
ARITHABORT
-
CONCAT_NULL_YIELDS_NULL
-
DATEFIRST
-
DATEFORMAT
-
FORCEPLAN
-
LANGUAGE
-
NO_BROWSETABLE
-
NUMERIC_ROUNDABORT
-
QUOTED_IDENTIFIER
-
-
The temporary table’s schema, binding, or permission has changed.
-
The remote rowset’s schema, binding, or permission has changed.
-
The query notification environment has changed.
-
The partition view has sufficiently changed.
Figure 1.12 gives a brief overview of how SQL Server 2005 decides whether to perform a recompilation.
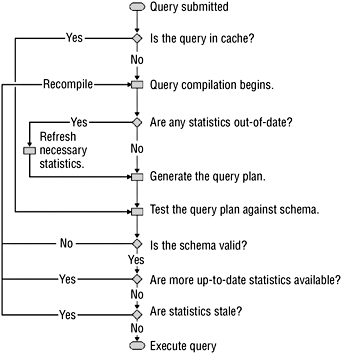
Figure 1.12: Recompilation
Detecting excessive compilation and recompilation can sometimes be a bit complex, but you’ll typically use the following resources:
-
Use System Monitor to monitor the following counters:
-
SQLServer:SQL Statistics : Batch Requests/sec
-
SQLServer:SQL Statistics : SQL Compilations/sec
-
SQLServer:SQL Statistics : SQL Recompilations/sec
-
-
Use SQL Trace, and watch the SP:Recompile/SQL : StmtRecompile events.
-
Query the sys.dm_exec_query_optimizer_info DMV to get an idea of the time SQL Server has spent on optimization.
-
Query the sys.dm_exec_query_stats DMV to examine the number of plan generations and executions for queries.
Inefficient Query Plans
An inefficient query plan can cause increased processor consumption and usually can be detected comparatively easily. DMVs such as sys.dm_exec_query_stats can be particularly useful for detecting queries that are processor intensive because of possibly inefficient query plans.
Additional Causes
Other potential reasons for excessive processor usage are poor cursor usage and incorrectly configured intraquery parallelism that potentially needs to be investigated. Again, the more you know about the way your database solution has been architected and the SQL Server 2005 database engine, the more empowered you will be to efficiently determine the cause of excessive processor usage.
Resolving Processor Problems
Before you rush out and buy more or faster processors, you can try a number of techniques to potentially reduce the processor utilization of your SQL Server 2005 instance.
Resolving excessive compilations or recompilations can be quite difficult, especially if you aren’t familiar with the way the underlying T-SQL code or SQL Server 2005’s query optimizer works. For resolution, you can follow these recommendations:
-
Avoid changing SET options in stored procedures.
-
Change your T-SQL code to use table variables instead of temporary tables.
-
Take advantage of the KEEP PLAN query hint.
| Note | Don’t forget that you can use the Database Engine Tuning Advisor to see whether any indexing changes improve the compile time and the execution time for queries. |
For inefficient query plans, you typically have to talk to your database developers because the problem typically stems from poor indexes or badly written queries. Consequently, SQL Server 2005’s processors have to perform expensive operations such as hash joins. We will cover tuning queries in Chapter 2, “Optimizing the Performance of Queries.” Otherwise, you can try using the Database Engine Tuning Advisor to tune the queries. Alternatively, you can try updating statistics for tables involved in your processor-intensive queries, although SQL Server 2005 should be taking care of that for you.
If your processors are the bottleneck because of intraquery parallelism, you can control the number of processors that SQL Server 2005 will use or turn it off altogether. You do this through the max degree of parallelism configuration option. To turn off intraquery parallelism, you would execute this:
USE master ; GO sp_configure 'show advanced options', 1 ; GO RECONFIGURE WITH OVERRIDE ; GO EXEC sp_configure 'max degree of parallelism', 1 ; GO RECONFIGURE WITH OVERRIDE ; GO
| Note | You can also control the degree of parallelism at the query level through the MAXDOP optimizer hint. The MAXDOP index option overrides the max degree of parallelism configuration option only for the query specifying this option. |
Troubleshooting Memory Problems
To troubleshoot memory problems, as discussed earlier, you should have a good understanding of SQL Server 2005’s memory architecture and the different types of memory pressure (such as internal and external and physical and virtual).
| Note | For more information about how SQL Server 2005 utilizes memory, search for the “Memory Architecture” topic in SQL Server 2005 Books Online. |
In addition, you should understand how SQL Server reacts to each type of memory pressure and what corrective actions you can take. Having memory pressure is not necessarily the sign of a problem but might indicate that your SQL Server is running near its capacity and that memory errors could occur in the near future.
Detecting Memory Problems
A number of signs could indicate your SQL Server 2005 is having memory problems. You could experience the following symptoms when you have insufficient memory:
-
SQL Server starts generating one of the error messages described in Table 1.11.
Table 1.11: Memory-Related Error Messages
 Open table as spreadsheet
 Error Number
Message
701
There is insufficient system memory to run this query.
802
There is insufficient memory available in the buffer pool.
8628
A timeout occurred while waiting to optimize the query. Rerun the query.
8645
A timeout occurred while waiting for memory resources to execute the query. Rerun the query.
8651
Could not perform the requested operation because the minimum query memory is not available. Decrease the configured value for the min memory per query server configuration option.
-
The system experiences intense I/O activity, because a lack of memory will typically result in intensive paging.
-
The system appears to be slow from a user’s point of view. (However, this tends to be a subjective metric, so you should not rely on it exclusively.)
Low values for the SQLServer:Buffer Manager : Buffer Cache Hit Ratio and SQLServer:Buffer Manager : Page Life Expectancy counters are typically good indications. Monitoring these performance objects counters will show memory pressure:
-
For SQLServer:Buffer Manager : Buffer Cache Hit Ratio (the percentage of pages found in the buffer cache), ideally the value will be greater than 90 percent.
-
For SQLServer:Buffer Manager : Page Life Expectancy (the number of seconds a page will remain in the buffer pool), a value less than 300 seconds can indicate problems.
| Tip | Don’t get carried away with the SQLServer:Buffer Manager : Page Life Expectancy counter. In 2005 everyone was talking about it; you saw it at all the SQL Server conferences around the world. It was the counter of the year! Or was it the most misunderstood counter of the year? There was a lot of confusion about what values you should expect. The problem is that it is very subjective to your operational environment. So, be careful about drawing any conclusions by looking at that counter by itself. Use it more as a correlating factor. |
Several memory-related DMVs can help you detect and analyze memory problems:
-
The sys.dm_os_memory_clerks DMV displays memory for various components such as CLR or extended stored procedures.
-
The sys.dm_os_ring_buffers DMV returns the content of internal ring buffers, which is particularly useful for seeing the internal memory notifications sent to SQL Server components, out-of-memory conditions, and so on.
-
If you need to drill down for a particular problem, you can use the following DMVs: sys.dm_os_memory_objects, sys.dm_os_memory_cache_clock_hands, and sys.dm_os_ cache_counters.
The DBCC MEMORYSTATUS command will return a snapshot of the current memory status of your Microsoft SQL Server 2005 instance. You will find it useful to troubleshoot memory allocation issues or out-of-memory errors.
| Note | You can find more details about how to use the DBCC MEMORYSTATUS command in the Knowledge Base article “How to use the DBCC MEMORYSTATUS command to monitor memory usage on SQL Server 2005” at http://support.microsoft.com/kb/907877. |
Resolving Memory Problems
By this stage you should be concerned only about internal memory pressure. So, you will need to identify the major memory consumers inside SQL Server 2005 and identify the cause of memory pressure, considering the existing workload, design issues, or other possible bottlenecks.
Verify and correct, if possible, the SQL Server’s memory configuration such as min memory per query, min/max server memory, and AWE enabled configuration options, as well as the Lock Pages in Memory privilege. This might be particularly relevant if you have multiple instances of SQL Server running on the same server.
Otherwise, it’s time for more RAM!
Troubleshooting I/O Bottlenecks
There’s not really all that much to troubleshooting I/O bottlenecks at the SQL Server 2005 instance level. Generally, I/O bottlenecks manifest themselves at the physical server level. Consequently, Microsoft has provided some basic DMVs that you can use.
Detecting I/O Bottlenecks
SQL Server 2005 now also has the following DMVs that you can use to monitor and troubleshoot I/O activity:
-
The sys.dm_os_wait_stats DMV can help you get latch wait statistics, which can help you identify I/O problems.
-
The sys.dm_io_virtual_file_stats DMV and the sys.dm_io_pending_io_requests DMV can help you monitor pending I/O operations.
-
The sys.dm_exec_query_stats DMV can give you the number of logical and physical reads and writes for cached queries.
Resolving I/O Bottlenecks
The ultimate cause of excessive disk I/O might have nothing to do with the actual disk drives but can be a consequence of your database design, user behavior, or lack of other resources. Consequently, you have a number of possible resolution methods:
-
Identifying the I/O-intensive queries and rewriting them
-
Checking and solving memory-related problems
-
Moving the transaction log files to separate disk drives in intense OLTP database solutions
-
Moving tempdb onto a separate disk drive for database solutions that heavily utilize this system database
| Note | The tempdb system database is often overlooked in performance-tuning methodologies because developers and DBAs aren’t aware of how SQL Server 2005 utilizes it in their database solutions. Consequently, it is worth examining tempdb and related performance issues in more detail. |
Troubleshooting tempdb Problems
In SQL Server 2005 the tempdb system database has become more important because of the ever-increasing number of features that rely on this system database. It is important to understand what components of SQL Server use this temporary workspace. The list includes the following:
-
The new SQL Server 2005 row versioning feature uses tempdb as its version store. A lot of other features utilize row versioning and consequently tempdb.
-
Bulk load operations with triggers enabled use row versioning and thus take up space in tempdb.
-
Common table expression (CTE) queries utilize work tables that are created in tempdb for spool operations during execution.
-
Keyset-driven and static cursors use work tables that are generated in tempdb.
-
The Service Broker component uses tempdb for various reasons such as caching and preserving dialog box context. Features that rely on Service Broker such as Database Mail, event notifications, and query notifications implicitly use tempdb.
-
DBCC CHECKDB uses tempdb work tables.
-
Creating and rebuilding indexes with the SORT_IN_TEMPDB option will use tempdb.
-
Online index operations use row versioning and therefore tempdb implicitly.
-
Large object (LOB) data type variables and parameters of types such as VARCHAR(MAX), NVARCHAR(MAX), VARBINARY(MAX), TEXT, NTEXT, IMAGE, and XML can use tempdb for storing values.
-
Multiple active result sets (MARS) can also use tempdb.
-
Queries that contain Data Manipulation Language (DML) statements can use internal objects to store intermediate results for hash joins, hash aggregates, or sorting.
-
Temporary tables and table variables both utilize tempdb. For some reason, many developers and DBAs have assumed that table variables reside in memory, which is completely wrong.
-
Tables returned in table-valued functions need temporary workspace.
-
Triggers in SQL Server 2005 now use tempdb.
So as you can see, many SQL Server components rely on the tempdb system database. Unfortunately, it can be quite difficult to predict its usage and therefore capacity plan correctly. Consequently, it is important to monitor tempdb in any new database solution to ensure that it has been configured correctly for the operating environment.
Detecting tempdb Problems
As you can see, the tempdb system database is much more important to the database engine in SQL Server 2005 than in any previous version. Consequently, Microsoft added the sys.dm_ db_file_space_usage and sys.dm_db_task_space_usage DMVs to help you detect any capacity problems with tempdb.
| Note | The sys.dm_db_file_space_usage and sys.dm_db_task_space_usage DMVs are applicable to the tempdb system database only in SQL Server 2005. |
Table 1.12 shows some specific error messages that you might encounter with tempdb-related issues. Otherwise, it is simply a matter of using the standard techniques that you would use to monitor any database. After all, tempdb is ultimately just another database being used by SQL Server 2005, albeit a special one. Don’t forget to keep an eye on transaction log activity as well!
| Error Number | Message |
|---|---|
| 1101, 1105 | This is raised whenever any session must allocate space in tempdb. |
| 3959 | The version store is full. (This error usually appears after a 1105 or 1101 error in the log.) |
| 3967 | The version store is forced to shrink because tempdb is full. |
| 3958, 3966 | A transaction cannot find the required version record in tempdb. |
Resolving tempdb Problems
It’s all about separating the disk I/O in a SQL Server solution that heavily utilizes tempdb, although you can adopt a number of programming techniques to stop tempdb from becoming a bottleneck:
-
Put the tempdb system database on a separate disk subsystem. Additionally, you could put it on an appropriate RAID array.
-
Allocate additional separate files to tempdb because SQL Server will then use more worker threads concurrently to service requests.
-
Correctly capacity plan the amount of disk space required for tempdb, and preallocate that space to avoid automatic growth and shrinkage during production hours.
-
Eliminate unnecessary DDL statements in stored procedures that use tempdb.
EAN: 2147483647
Pages: 146