Troubleshooting Database Performance
By the time you are troubleshooting database performance, you are typically trying to resolve a specific known issue. Consequently, there is less of a methodology because it’s more of a matter of using the appropriate tool to troubleshoot the known issue.
In some cases, however, you are more interested in getting metrics on the database globally, such as with the number of connections, transactions, amount of blocking, and other key statistical information.
Troubleshooting Tools
Microsoft has introduced some really great tools to troubleshoot database performance at both the high level and the low level in this release of SQL Server. We highly encourage you to look at all of them in depth to get an understanding of the rich information they so easily provide.
Summary Report Pane
Again, the Summary Report pane is potentially your best friend because it provides a number of reports that help you easily deduce the source of your performance problem within your database.
The Summary Report pane has a number of summary reports at the SQL Server instance level:
-
Disk Usage The Disk Usage report provides detailed data about the utilization of the database files by database objects. Figure 1.13 shows the Disk Usage report.
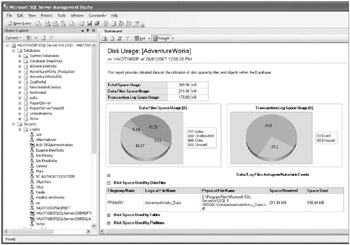
Figure 1.13: Disk Usage reportNote To view the Disk Usage report, a database must be running in 80 compatibility level.
-
Backup and Restore Events The Backup and Restore Events report provides historical data about all backup and restore events performed on the database.
-
All Transactions The All Transactions report provides details on all currently executing transactions within the database. Figure 1.14 shows the All Transactions report.
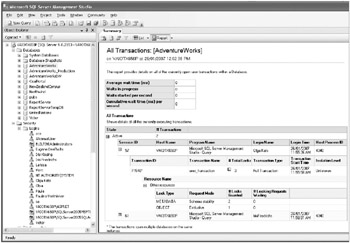
Figure 1.14: All Transactions report -
All Blocking Transactions The All Blocking Transactions report provides details about executing transactions within the database that are blocking other transactions.
-
Top Transactions by Age The Top Transactions by Age report provides details on the oldest transactions executing within the database.
-
Top Transactions by Blocked Transactions Count The Top Transactions by Blocked Transactions Count report provides details on transactions that are being blocked by the highest number of other transactions.
-
Top Transaction by Locks Count The Top Transactions by Locks Count report provides details on transactions that have acquired the most number of locks.
-
Resource Locking Statistics by Object The Resource Locking Statistics by Object report provides statistical data on all objects within the database that have got locks acquired on them.
-
Object Execution Statistics The Object Execution Statistics report provides historical data about all currently cached execution plans within the database.
-
Database Consistency History The Database Consistency History report provides historical data about all executions of DBCC CHECKDB on the database captured by the default trace.
-
Index Usage Statistics The Index Usage Statistics report provides details on the usage and maintenance cost of indexes within the database.
-
Schema Changes History The Schema Changes History report provides historical data on all the committed DDL statements executed against this database. Figure 1.15 shows the Schema Changes History report.
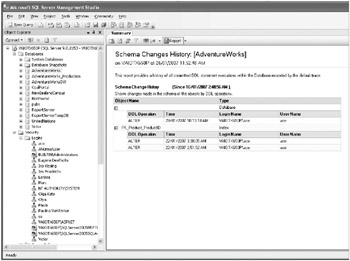
Figure 1.15: Schema Changes History report -
User Statistics The User Statistics report provides details about all currently connected users to the database.
DBCC Commands
The DBCCs are a legacy of the Sybase days but still can be used for a variety of purposes such as enabling trace flags, performing maintenance tasks, and displaying various types of information. Table 1.13 shows a number of commonly used DBCCs.
| DBCC Command | Description |
|---|---|
| DBCC CHECKDB | Checks and repairs database problems |
| DBCC SHOW_STATISTICS | Returns the current distribution statistics for the specified table or view |
| DBCC PROCCACHE | Displays information about the procedure cache |
| DBCC OPENTRAN | Returns information about the oldest active transactions within the specified database |
| DBCC LOGINFO | Shows the internal layout of the transaction log file, including which virtual log files (VLFs) are active |
| DBCC SHOWCONTIG | Returns the level of internal and external fragmentation in a table or index |
| DBCC TRACEON | Turns on trace flags |
| DBCC TRACEOFF | Turns off trace flags |
| DBCC USEROPTIONS | Returns the current SET options |
| DBCC DROPCLEANBUFFERS | Removes all buffers from the buffer pool |
| DBCC FREEPROCCACHE | Invalidates all elements from the procedure cache |
| DBCC INDEXDEFRAG | Defragments indexes of a table or view |
| DBCC FREESYSTEMCACHE | Releases all unused cache elements from all caches |
| DBCC CLEANTABLE | Reclaims space for dropped variable-length columns and text columns |
| DBCC UPDATEUSAGE | Reports and corrects page and row count inaccuracies in the database catalog views |
| DBCC HELP | Returns syntactical information for the specified DBCC command |
Figure 1.16 shows the output of the DBCC SHOWCONTIG command.
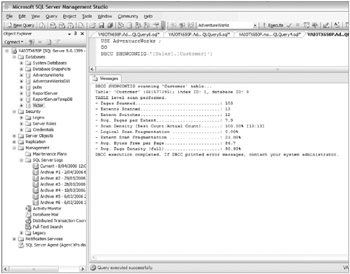
Figure 1.16: Output of DBCC SHOWCONTIG
We will cover some of the more important DBCC commands in Chapter 5, “Designing a Strategy to Maintain a Database Solution.”
Database Engine Tuning Advisor
The Database Engine Tuning Advisor (DTA) is the replacement for the Index Tuning Wizard (ITW). It can analyze workloads and sets of T-SQL statements and recommend changes in the physical design structure of a database such as adding, removing, or modifying indexes, indexed views, and partitions. Figure 1.17 shows the Database Engine Tuning Advisor interface and the advanced options available.
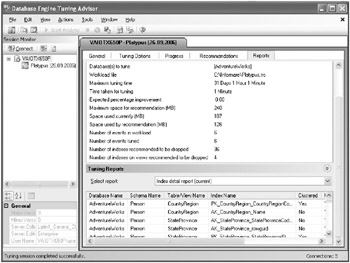
Figure 1.17: The Database Engine Tuning Advisor
The DTA is particularly useful for seeing the adequacy of indexes and picking up other problems where you have purchased a third-party database solution and therefore do not have the development knowledge required about the database.
| Tip | You can use the SQL Server 2005 DTA to tune SQL Server 2000 databases. In theory, it should do a better job than the SQL Server 2000 ITW because Microsoft has invested more research and development in the DTA. |
We will cover the DTA in more detail in Chapter 2, “Optimizing the Performance of Queries.”
Database-Level DMVs
Two main categories of DMVs are at the database level. Nevertheless, as far as troubleshooting performance problems is concerned, they provide some invaluable information, especially about potentially missing indexes and cached execution plans.
Database DMVs
You can use the DMVs described in Table 1.14 to report on the state of the database, returning rich information that the developer can use to tune the database environment.
| DMV | Description |
|---|---|
| sys.dm_db_file_space_usage | Returns space usage information for each file in the database. |
| sys.dm_db_index_operational_stats | Returns current low-level I/O, locking, latching, and access method activity for each partition of a table or index in the database. |
| sys.dm_db_index_physical_stats | Returns size and fragmentation information for the data and indexes of the specified table or view. |
| sys.dm_db_index_usage_stats | Returns counts of different types of index operations and the time each type of operation was last performed. |
| sys.dm_db_mirroring_connections | Returns a row for each connection established for database mirroring. |
| sys.dm_db_missing_index_columns | Returns information about database table columns that are missing an index. This is a dynamic management function. |
| sys.dm_db_missing_index_details | Returns detailed information about missing indexes. |
| sys.dm_db_missing_index_group_stats | Returns summary information about groups of missing indexes. |
| sys.dm_db_missing_index_groups | Returns information about what missing indexes are contained in a specific missing index group. |
| sys.dm_db_partition_stats | Returns page and row count information for every partition in the current database. |
| sys.dm_db_session_space_usage | Returns the number of pages allocated and deallocated by each session for the database. |
| sys.dm_db_task_space_usage | Returns page allocation and deallocation activity by task for the database. |
Query DMVs
The DMVs described in Table 1.15 will give you more information about the queries that are executing in your SQL Server 2005 environment.
| DMV | Description |
|---|---|
| sys.dm_exec_background_job_queue | Returns a row for each query processor job that is scheduled for asynchronous (background) execution. |
| sys.dm_exec_background_job_queue_stats | Returns a row that provides aggregate statistics for each query processor job submitted for asynchronous (background) execution. |
| sys.dm_exec_cached_plans | Returns information about the query execution plans that are cached by SQL Server for faster query execution. |
| sys.dm_exec_connections | Returns information about the connections established to this instance of SQL Server and the details of each connection. |
| sys.dm_exec_cursors | Returns information about the cursors that are open in various databases. |
| sys.dm_exec_plan_attributes | Returns one row per attribute associated with the plan specified by the plan handle. |
| sys.dm_exec_query_optimizer_info | Returns detailed statistics about the operation of the SQL Server query optimizer. |
| sys.dm_exec_query_plan | Returns the showplan execution plan in XML format for a T-SQL batch whose query execution plan resides in the plan cache. |
| sys.dm_exec_query_stats | Returns aggregate performance statistics for cached query plans. The view contains one row per query plan, and the lifetime of the row is tied to the plan itself. When a plan is removed from the cache, the corresponding row is eliminated from this view. |
| sys.dm_exec_requests | Returns information about each request that is executing within SQL Server. |
| sys.dm_exec_sessions | Returns one row per authenticated session on Microsoft SQL Server 2005. |
| sys.dm_exec_sql_text | Returns the text of the SQL statement that is given the sql_handle for that statement. |
| Tip | When you initially query sys.dm_exec_query_stats, it might return inaccurate results if a workload is currently executing on your SQL Server instance. You can get more accurate results by rerunning the query. |
Transaction DMVs
The DMVs described in Table 1.16 will give more information about the transactions that are executing in your database environment.
| DMV | Description |
|---|---|
| sys.dm_tran_active_snapshot_database_transactions | Returns a virtual table for all active transactions that generate or potentially access row versions |
| sys.dm_tran_active_transactions | Returns information about transactions for the SQL Server instance |
| sys.dm_tran_current_snapshot | Returns a virtual table that displays all active transactions at the time when the current snapshot transaction starts |
| sys.dm_tran_current_transaction | Returns a single row that displays the state information of the transaction in the current session |
| sys.dm_tran_database_transactions | Returns information about transactions at the database level |
| sys.dm_tran_locks | Returns information about currently active lock manager resources |
| sys.dm_tran_session_transactions | Returns correlation information for associated transactions and sessions |
| sys.dm_tran_top_version_generators | Returns a virtual table for the objects that are producing the most versions in the version store |
| sys.dm_tran_transactions_snapshot | Returns a virtual table for the sequence_number of transactions that are active when each snapshot transaction starts |
| sys.dm_tran_version_store | Returns a virtual table that displays all version records in the version store |
Troubleshooting Methodology
When troubleshooting performance at the database level, you tend to stay entirely within the SQL Server 2005 database engine, so the hardware tends to be less important. Therefore, you don’t examine the processor, memory, and I/O subsystems like you do at the physical server and SQL Server 2005 instance level.
When troubleshooting performance at the database level, you tend to focus on the follow-ing aspects:
-
Poorly written queries
-
Inefficient indexing strategies
-
Concurrency issues
We’ll cover these concepts in Chapter 2, “Optimizing the Performance of Queries,” in more detail.
EAN: 2147483647
Pages: 146