Multiple Data Providers
|
| < Day Day Up > |
|
Multipass SQL automatically synchronizes result sets by common dimensions within the same universe. The synchronization happens even when you have multiple data providers from different star schemas, as shown in the previous section. For example, in the EFASHION universe, Sales is one star schema and Promotions is in a second star schema. They both share common dimensions such as Time and Articles. However, let’s assume they are in two separate universes; you can no longer build one query or one data provider to create the report shown in Figure 22-1. You need to create a data provider for each universe. If the data providers and/or dimension names are different between the two result sets, you must manually synchronize the common dimensions by linking them.
| Caution | BusinessObjects will allow you to build one table with variables from both data providers; however, until you link the common dimensions, the results will be incorrect. Also, this procedure works only with the reports that contain measure objects with an aggregate function; when the measures do not contain aggregate functions, BusinessObjects displays null values. |
In Chapter 18, you saw a ranking of the top ten wine producers according to Robert Parker’s rating. In the following example, you will insert a report from a second data provider and link the common dimensions. The second data provider is a spreadsheet that contains ratings and prices for the top ten wines, according to Wine Spectator. In this example, you want to use the second data provider to see if the ratings are different between the two sources. The original wine database has prices for only a small number of total wines rated, so the personal data source provides price information not otherwise available.
-
To insert a second data provider, you can either create a new report and insert another table or insert a second data provider into the main report by selecting Data | New Data Provider.
-
When prompted by the New Table Wizard, select Access new data in a different way and click Begin >.
-
Under Specify Data Access, select Others, select Personal data files and click Finish. BusinessObjects displays the Access Personal Data dialog box. (This dialog is explained in Chapter 9, “Incorporating Personal Data Files.”) Complete the selections and click Run.
Synchronizing Data Providers
When you insert a new data provider, BusinessObjects does not automatically affect the data displayed in the report or current table block; the data has only been retrieved into the local microcube. In order to display the results in the table, you insert the new variables via the Report Manager or the Slice and Dice Panel. In order to ensure the data is correctly displayed, you must first synchronize the common dimensions via the Data Manager shown in Figure 22-3.
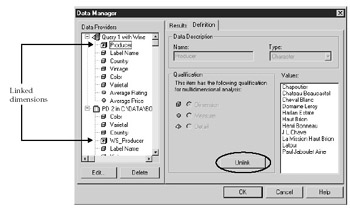
Figure 22-3: Data Manager allows you to link common dimensions.
To access the Data Manager, select Data | View Data or select View Data from the standard toolbar, then select the Definition tab. Under Data Providers, the name of each data provider is assigned according to the type of data provider (Query from a universe, PD from a personal data file, and so on) and a sequential number. In Figure 22-3, note the link symbol next to Producer and WS_Producer. This indicates that the two variables represent the same dimensions and content, even though the variable names are different. When you select a variable that is not linked, the Unlink button becomes a Link button.
Even if you display only one dimension in your report, you must link all dimensions to ensure you continue to get correct results. If you fail to do this correctly, you will get incorrect results in any block that accesses both data providers. If you are working with a personal data file, freehand SQL, or another data provider that does not accurately qualify dimension objects, you also must first modify the qualification for the object. In this example, Vintage in the spreadsheet contains numeric values. BusinessObjects incorrectly classifies this as measure. Also, BusinessObjects automatically aggregates measures by applying a SUM projection aggregate. For ratings and price, these should be converted to AVERAGE.
Modifying Object Qualifications
To modify the object qualifications:
-
Launch Data Manager by selecting Data | View Data or click View Data, then select the Definition tab.
-
Select the variable from the non-universe data provider. In this example, Vintage.
-
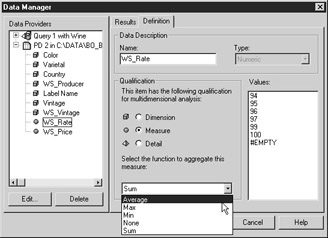
When you select an object from a non-universe data provider, the Name, Type, and Qualification settings that are grayed out in Figure 22-3 become available. Change the qualification from measure to dimension by clicking dimension radio.
-
Now correct the projection aggregate for any measures. Select the measure variable whose projection aggregate you wish to change. In this example, select WS_Rate from the Data Provider pane.
-
In the drop-down box Select the function to aggregate this measure, change the setting from Sum to Average.
Leave the Data Manager open so you can continue linking the dimensions in the next section.
Linking Dimensions
Once you have corrected the object qualifications and aggregates, you continue to use the Data Manager to link the dimensions:
-
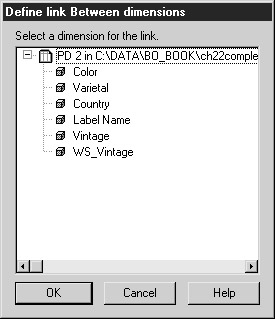
Select the variable in the first data provider. In this example, Query 1 with Wine, Label Name.
-
Click Link to.
-
The Define link Between dimensions dialog box displays a list of dimension objects from the second data provider (in this case, from a Personal Data File). Note that only the dimensions that do not have an existing link appear (WS_Producer does not appear, as the link was previously defined). Select the common dimension, Label Name, and click OK.
-
Repeat this process for all common dimensions.
-
Click OK to close Data Manager.
-
Use Report Manager to drag the new measure from the second data provider to the report table.
Figure 22-4 shows the combined results. Notice that data from the two sources has nicely been merged into one table; it is not split into two tables as in the report on the right in Figure 22-1.
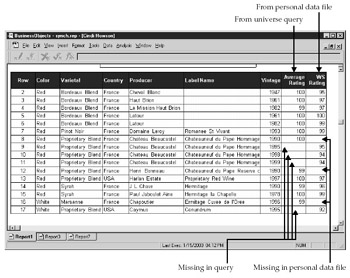
Figure 22-4: One table created with two data providers, with manually linked dimensions
Data Mismatches
When you synchronize data between two different data sources, there is a strong likelihood that the dimensional values will not match exactly. BusinessObjects will nicely merge whatever data does match and display null values in the measure column for which there is no data. As shown in Figure 22-4, there are data rows in both data providers that do not share the same dimensional values. For example, the Producer Chateau Beaucastel has three different vintages in data provider two (the personal data file) that do not exist in data provider one (the query), displayed in rows 9–11; Producer Caymus does not exist at all in the query results, row 17. For these rows, BusinessObjects displays null values in the measure column that comes from data provider one (Average Price). Conversely, Producer Chapoutier and Chateau Beaucastel, Vintage 1990 exists in data provider 1 but not in the second data provider data file, displayed in rows 8, 12, and 16; for these rows null values appear in the measure column from the second data provider (WS Rating).
|
| < Day Day Up > |
|
EAN: 2147483647
Pages: 206