Profiling and Performance
Profiling is often one of those areas that never seem to have great value in some people's minds, but in certain respects it is the most important area of development. A slow web site is a great way to put off users and lose customers, and remains the bane of many administrators' lives. The simple fact is that performance testing often gets cut due to time constraints as, when deadlines get tight, people cut things that don't have an immediate impact. The attitude is often to get the product shipped, and then release a performance-enhanced version at a later date. The reality is, of course, that users expect great things from a first release, and there should be no excuses for not delivering the best-performing application.
So, if you want the best possible performance from an application, how do you go about it? How do you find the areas of an application that need improvement, and go about testing those areas? Profiling is the act of gathering that data about an application, allowing you to see which areas take longest to execute.
Performance testing isn't only about seeing how well an application performs in its current incarnation, but also includes:
-
Baselining :This is the act of collecting performance data to be used as a comparison for future tests. Collecting metrics is important as applications and loads change “ you need to have some base figures against which you can compare future analysis.
-
Loading :Application performance decreases as the load increases , so you need to see how your application will perform under increasing load. That's the thing about web sites “ the load is never guaranteed to stay the same “ it can increase and decrease sharply as usage trends change.
-
Stability :Web sites need to have constant availability as they have global reach. It is not possible to assume that no one will use your site at night, because your night may be your user 's day. Therefore, you have to ensure your application stays stable, especially under load.
As applications become more complex, so does testing. This is especially true now, where ASP.NET applications may be written with interoperability in mind to provide integration with, or reuse of existing technology. An example of this is the reuse of an existing COM data layer. This layer may be performing optimally in a current application, but when used from a .NET application does it become a bottleneck? At this stage, you have to ask if performance could be improved by rewriting the layer. This sort of question is discussed further in Chapter 23, where we look at migration and interoperability issues.
There are three steps in the process of profiling:
-
Instrumentation :Where you add profiling to your code. This could be adding Windows performance counters, or custom profiling statements to identify the execution of the code, as well as logging and tracing information.
-
Sampling :Where you run your application to collect the profiling data.
-
Analysis :Where you examine the collected data, and validate it against your baseline data.
We will be concentrating on the first of these, although we will discuss the latter two options to show how the instrumentation process is used.
Instrumentation
Instrumentation is a bit like Schrdinger's Cat, where the act of viewing changes the outcome. In performance testing, you are examining how your application performs under certain conditions, and you add profiling to detect this. However, the profiling you add affects those very things you are testing “ the performance metrics. The more profiling code you add to applications, the more you affect performance. So, the act of instrumentation is one that should be carefully handled. There is no harm in adding large amounts of profiling code as long as you understand the implications.
The Trace class shown earlier provides some performance data for events, but this has to be manually viewed , and is not really designed for profiling. To profile, you want a simple way of adding profiling code as well as collecting information. This is provided by Performance Monitor Counters . Both the .NET Framework and ASP.NET have counters (which you'll look at under the Analysis section), but to provide custom profiling you will need to create custom counters.
Security
The ASPNET account does not have sufficient privileges to read performance counter data, although it does have privilege to write performance counter data. To read performance counter data, the process requires Administrator or Power User permissions. To enable reading of data from counters, your ASP.NET pages will need to run under impersonation. Placing these pages in a separate directory and modifying the configuration file will allow this.
When to Create and Remove Counters
The creation and removal of counters is something you should think carefully about, as they are really installer and uninstaller features. If your application requires custom counters, then the counters should be created when the application is installed, and removed when the application is uninstalled . One problem with this approach is fitting it into ASP.NET applications where the xcopy deployment method is used. The ways to solve this could be to:
-
Create an application installer so that the counters are created and removed in the correct place.
-
Create a separate script or page to create and remove the counters.
-
Check for the existence of counters in your application (perhaps the Application_OnStart event), and if missing create them. This leaves the problem of removing counters if the application is uninstalled, as well as a performance problem since you are checking for them every time the application starts.
Of these solutions, the first option is certainly the best.
Along with the question of when to create counters, there is the question of why? The answer is simple “ create custom counters when you need to profile areas within your application. The supplied counters are perfect for looking at the application or ASP.NET as a whole, but isn't fine-grained enough to show you how the individual parts of your application are performing. So, it is only if you need this amount of information that you need to create custom counters. For example, imagine you have an e-commerce site, and you need to know how well the order processing section is performing. You will probably be storing the orders in a database, so you can see how many orders you have, but unless you also keep time information you can't see any performance metrics. Adding instrumentation to the order processing allows fine grained monitoring of this information.
Custom Performance Counters
The base class library supplies a set of classes for interacting with the Windows performance monitor, allowing both read-and-write access, as well as the creation of custom objects and counters. These objects are as follows :
| Object | Description |
|---|---|
| PerformanceCounterCategory | A counter category to contain individual counters. |
| PerformanceCounter | The details of an individual performance counter. |
| CounterCreationData | The details required for the creation of a counter. |
| CounterCreationDataCollection | A collection of performance counter creation details, for creating multiple counters in a category. |
| CounterSample | A sample of data from a counter. |
The first two of these objects are easy to relate to, by looking at the Add Counters screen of the Windows Performance Monitor. See Figure 22-19:
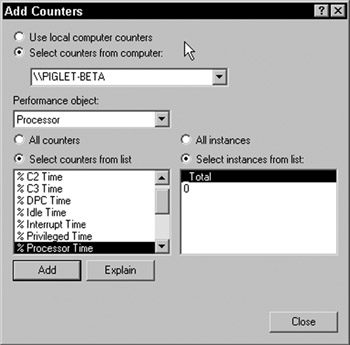
Figure 22-19:
The performance object drop-down list on the dialog corresponds to the PerformanceCounterCategory , and the counters list corresponds to the PerformanceCounter . Just like the dialog in Figure 22-19, the use of the counter objects isn't limited to the local machine “ many of the methods allow the addition of a machine name , allowing manipulation of counters on remote machines ( assuming the correct permissions).
The PerformanceCounterCategory Object
Let's first look at the category object, as this contains details for the category itself, allowing creation of new categories and counters as well as the retrieval of category and counter information. It has three properties as follows:
| Property | Description |
|---|---|
| CategoryName | The name of the category |
| CategoryHelp | Text describing the category |
| MachineName | The machine upon which the category is installed |
The methods are more extensive :
| Method | Description |
|---|---|
| CounterExists | Indicates whether or not the selected counter exists |
| Create | Creates a category and a counter or counters |
| Delete | Deletes a category and counters |
| Exists | Indicates whether or not the category exists |
| GetCategories | Returns an array of categories |
| GetCounters | Returns an array of counters for the category |
| GetInstanceNames | Returns an array of names of counter instances |
| InstanceExists | Indicates whether or not the counter instance exists |
| ReadCategory | Returns a collection of all category and instance data |
Many of these methods are overloaded, allowing several forms of use. For example, the CounterExists method has three forms:
CounterExists( CounterName ) CounterExists( CounterName , CategoryName ) CounterExists( CounterName , CategoryName , MachineName )
The first case of these requires the PerformanceCounterCategory object to have been initialized to an existing category. For example:
Dim PC As New PerformanceCounterCategory("Wrox") If PC.CounterExists("MyCounter") Then ... ... End If
The latter two cases are static methods, and don't require an object instance. For example:
If PerformanceCounterCategory.CounterExists("MyCounter", "Wrox") Then ... ... End If
Or:
If PerformanceCounterCategory.CounterExists("MyCounter", "Wrox", "Eeyore") Then ... End If
Creating Custom Performance Counters
The first point to note about creating counters is that they can only be created in new categories. This means that you cannot modify any of the existing categories, and that if you want to add counters to a custom category, you need to remove the category first. To create counters, use the Create method of the PerformanceCounterCategory object, which has several forms:
Create( CategoryName , CategoryHelp , CounterName , CounterHelp ) Create( CategoryName , CategoryHelp , CounterName , CounterHelp , MachineName ) Create( CategoryName , CategoryHelp , CounterCreationDataCollection ) Create( CategoryName , CategoryHelp , CounterCreationDataCollection , MachineName )
The first two of these allow a category and a single counter to be created. For example:
PerformanceCounterCategory.Create("Wrox", "Wrox Press Counters", _ "Counter1", "This counter is counter 1")
The second two methods use a collection of CounterCreationData objects, allowing the creation of multiple counters, as well as being able to specify the type of counter (which defaults to RateOfCountsPerSecond32 “ more on types later). This object can be constructed like so:
Dim CCD As CounterCreationData CCD = New CounterCreationData("Counter1", "This counter is counter 1", _ PerformanceCounterType.NumberOfItems32)
or, alternatively using the properties:
Dim CCD As New CounterCreationData() CCD.CounterName = "Counter1" CCD.CounterHelp = "This counter is counter 1" CCD.CounterType = PerformanceCounterType.NumberOfItems32
Once created, the object can be added to the collection:
Dim CCDC As New CounterCreationDataCollection() CCDC.Add(CCD) PerformanceCounterCategory.Create("Wrox", "Wrox Press Counters", CCDC)
This process can be abbreviated by combining creation and addition into one line, making adding multiple counters easier to read:
Dim CCDC As New CounterCreationDataCollection() CCDC.Add(New CounterCreationData("Counter1", "This counter is counter 1", _ PerformanceCounterType.NumberOfItems32) CCDC.Add(New CounterCreationData("Counter2", "This counter is counter 2", _ PerformanceCounterType.NumberOfItems32) CCDC.Add(New CounterCreationData("Counters/sec", _ "Counters per second", _ PerformanceCounterType.RateOfCountersPerSecond32) PerformanceCounterCategory.Create("Wrox", "Wrox Press Counters", CCDC)
The allowable values for PerformanceCounterType are as follows:
| Type | Description |
|---|---|
| AverageBase | Used as the base data in the computation of time or count averages ( AverageCounter64 and AverageTimer32 ). |
| AverageCount64 | A count that usually gives the bytes per operation when divided by the number of operations. |
| AverageTimer32 | A timer that usually gives time per operation when divided by the number of operations. |
| CountPerTimeInterval32 | Count per time interval. Typically used to track number of items queued or waiting. |
| CountPerTimeInterval64 | Large count per time interval. Typically used to track number of items queued or waiting. |
| CounterDelta32 | Difference between two counters. |
| CounterDelta64 | Large difference between two counters. |
| CounterMultiBase | Used as the base data for the Multi counters. It defines the number of similar items sampled. |
| CounterMultiTimer | Timer sampling of multiple but similar items. Result is an average sampling among the items. |
| CounterMultiTimer100Ns | Timer sampling of multiple , but similar items, every 100 nanoseconds. Result is an average sampling among the items. |
| CounterMultiTimer 100NsInverse | The inverse of CounterMultiTimer100Ns . Used when the object is not in use. |
| CounterMultiTimer Inverse | The inverse of CounterMultiTimer . Used when the object is not in use. |
| CounterTimer | A common timer for percentage values. |
| CounterTimerInverse | The inverse of CounterTimer . Used when the object is not in use. |
| ElapsedTime | The data is the start time of the item being measured. |
| NumberOfItems32 | A raw counter value. |
| NumberOfItems64 | A large raw counter value. |
| NumberOfItemsHEX32 | A raw counter value for display in hexadecimal. |
| NumberOfItemsHEX64 | A large raw counter value for display in hexadecimal. |
| RateOfCounts PerSecond32 | Rate of counter per second. |
| RateOfCounts PerSecond64 | Large rate of counts per second. |
| RawBase | Used as the base data for RawFraction . The counter value holds the denominator of the fraction value. |
| RawFraction | Instantaneous value, to be divided by the base data ( RawBase ). |
| SampleBase | Used as the base data for SampleCounter and SampleFraction . |
| SampleCounter | A count that is either 1 or 0 on each sampling. The counter value is the counter of 1s sampled. |
| SampleFraction | A count that is either 1 or 0 on each sampling. The counter value is the counter of 1s sampled. For display in terms of a percentage. |
| Timer100ns | Timer sampling every 100 nanoseconds. |
| Timer100nsInverse | The inverse of Timer100ns . Used when the object is not in use. |
The type of counter you create depends upon what you are trying to measure. For simple count values (for example, the total number of orders in an e-commerce system) you can use NumberOfItems32 or NumberOfItems64 (the difference being the magnitude of number allowed). For a performance metric (such as the number of orders per second) you can use RateOfCountsPerSecond32 or RateOfCountsPerSecond64 . The difference between the large and normal counters (those ending in 32 and 64 ) is the size of data they can hold. Those ending in 32 are 32 bits wide (holding 4 bytes) and those ending in 64 are 64 bits wide (holding 8 bytes).
The counter type also comes into effect when you look at sampling, as explained later in the chapter.
Creating Counter Instances
The term instance can be confusing when dealing with performance counters, as it is easy to think in terms of class instantiation giving you an instance of a class. This is, in fact, the right way to think of it “ the difference is that an instance of a performance counter is reflected as part of the instrumentation. For example, consider the Performance Monitor application, where you have the choice to add counters (Figure 22-19). At the bottom right of this dialog you see instances of a counter dealing with the Process object. The instances here reflect the number of processors in the monitored machine (sadly I only have 1 CPU). There is also a _Total instance, which aggregates the values for other instances. Some counters, such as Memory , don't have specific instances, as they are concerned with a single object. What's especially noteworthy about this is the instances apply to a Performance object (or category), and not to individual counters. You cannot have two counters in the same category with different instances.
Creating instances is different from creating the counters themselves , because instances are created for existing custom counters. Use the PerformanceCounter object for this:
Dim pc As New PerformanceCounter("Wrox", "Counter1") Dim pc As New PerformanceCounter("Wrox", "Counter1", "Instance1") Dim pc As New PerformanceCounter("Wrox", "Counter1", "Instance2") Dim pc As New PerformanceCounter("Wrox", "Counter1", "_Total")
The first line creates a counter with the default instance. The latter three lines show the creation of explicit instances. These examples create read-only counters “ the constructor is overloaded to allow a Boolean flag to indicate a read/write counter:
Dim pc As New PerformanceCounter("Wrox", "Counter1", "Instance2", True) There is also another form allowing the addition of a machine name:
Dim pc As New PerformanceCounter("Wrox", "Counter1", "Instance2", _ "EEYORE", True)
You will look at the use of counters in more detail a little later when we discuss updating counter values and sampling.
Counter Lifetime
It is important to understand that performance counter values are values rather than entries “ when you write a value to a performance counter, you are not making a permanent entry in the counter, as you do when you write an entry to an event log. Rather, performance counter values are transitory , and reflect a point in time. When the last PerformanceCounter component to reference a particular system counter is disposed of, the counter resets itself to zero.
There are several ways you can manage the lifetime of a performance counter if you want to retain values for a longer period of time than the default counter behavior allows:
-
You can run the Performance Monitor application on the server where the counter lives. As long as the Performance Monitor is open , the reference to the counters is maintained and counter values continue to accumulate.
-
You can make sure that there is always an instance of the PerformanceCounter component connected to the particular counter for which you want to maintain values.
-
You can write a Windows service that keeps a reference to the counter.
While these solutions are perfectly acceptable, you should realize that performance counters aren't meant to hold stateful data. Their very nature is for measuring metrics at a particular point in time. So, if no one is running your application, it makes sense for the counter values to be 0, or even to not exist at all.
Removing Counters
Custom counters can be removed by use of the Delete method of the PerformanceCounterCategory object, which removes the category and all counters associated with it. For example:
PerformanceCounterCategory.Delete("Wrox") What's important to remember is the lifetime of counters, because the counter will not be removed if another application is using the same. The counters use shared memory underneath, so this memory won't be released until all monitoring and instrumentation applications have been closed. This means that you could remove counters, and then recreate them immediately, and the old values would be retained. To guarantee their instant removal you can use the CloseSharedResources method of the performance counter object. For example:
Dim cat As New PerformanceCounterCategory("Wrox") Dim pc As New PerformanceCounter For Each pc In cat.GetCounters() pc.CloseSharedResources() Next PerformanceCounterCategory.Delete("Wrox")
The trouble with this code is that you would need to add more to check for instances. As a general rule it is best to just use the Delete method to delete the category and counters “ the counter values will be reset once all references are removed.
Updating Performance Counter Values
Once your counters have been created, there are several ways to update counter values. The first is to simply set the RawValue property:
Dim pc As New PerformanceCounter("Wrox", "Counter1", True) pc.RawValue = 10
The other ways all rely on a similar set of methods:
pc.Increment() pc.IncrementBy(5) pc.Decrement() pc.DecrementBy(5)
These just increment or decrement the counter, either by 1 or by a supplied value.
Sampling
The .NET Framework doesn't provide any new tools for performance testing, but instead, integrates with the Windows Performance Log, so you can use existing tools to track how your application performs. If you don't have an existing performance-testing tool, then the Web Application Stress Tool (WAST) is freely available from Microsoft at http://www.microsoft.com/downloads/ “ search for webtool . This allows you to run automated tests against a web site, simulating large numbers of users. A description of WAST is outside the scope of this book. If you have the Enterprise Version of Visual Studio .NET you will have Application Center Test, which is the new version of WAST.
Monitoring custom counters with the Performance Monitor is just the same as for Windows counters “ you just pick your custom category and counters as shown in Figure 22-20:
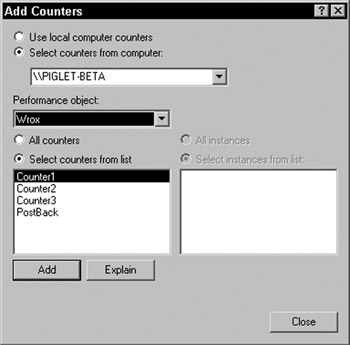
Figure 22-20:
This in itself is an acceptable form of monitoring, but if you want to build some form of custom graphs, you will need to take sample data and perform calculations on it.
Custom Sampling
There are several ways in which you can extract the values from performance counters. The simplest, and quickest, is to examine the value of the RawValue property, which gives the uncalculated value of the counter. When using this value, you should remember that it represents the counter value at its last sampling, and may only represent a transient state. For example, a counter measuring CPU utilization may have high fluctuations, and the RawValue property will only reflect this if you happen to sample at the same point as the fluctuation. You can also use the NextSample method to fetch the next raw value for the counter. For example:
Dim pc As New PerformanceCounter("Wrox", "Counter1", True) Dim ValueNow As Integer Dim ValueNew As Integer ValueNow = pc.RawValue ValueNew = pc.NextSample().RawValue
This example introduces the concept of the CounterSample object, which contains the following properties:
| Property | Description |
|---|---|
| BaseValue | Returns the base value. Only for samples that are based upon multiple counters. |
| CounterFrequency | Returns the frequency at which the counter is read. This is the number of milliseconds between samples. |
| CounterTimeStamp | The time at which the sample was taken. |
| CounterType | The type of counter. This will be one of the PerformanceCounterType constants. |
| RawValue | Returns the raw value of the counter. |
| SystemFrequency | The frequency at which the system reads from the counter. |
| TimeStamp | The system timestamp. |
| TimeStamp100nsec | The system timestamp, to within 0.1 milliseconds. |
There is also a single method, Calculate , to calculate sample values:
Dim pc As New PerformanceCounter("Wrox", "Counter1", True) Dim samp1 As CounterSample Dim result As Single samp1 = pc.NextSample() result = CounterSample.Calculate(samp1)
You can also use this method to calculate between two samples:
Dim pc As New PerformanceCounter("Wrox", "Counter1", True) Dim samp1 As CounterSample Dim samp2 As CounterSample Dim result As Single samp1 = pc.NextSample() samp2 = pc.NextSample() result = CounterSample.Calculate(samp1, samp2)
This takes two samples, and then uses the Calculate method to perform the calculation between them. When dealing with counters that could have fluctuations sampling gives a more accurate picture of the trends within your application.
The calculation performed depends upon the type of counter from the PerformanceCounterType enumeration, and the details are shown next:
AverageCount64 is a standard average counter, giving the result of the average count per operation:
(NewSample-OldSample)/(NewCount-OldCount) AverageTimer32 is the average of a time value, giving the result of the average time per operation:
((NewSample-OldSample)/SampleFrequency)/(NewTime-OldTime) CountPerTimeInterval32 and CountPerTimeInterval64 represent the number of counts per time interval:
(NewSample-OldSample)/(NewTime-OldTime) CounterDelta32 and CounterDelta64 represent the difference between two counter values:
NewSample-OldSample CounterMultiTimer gives the result of an average sampling among multiple items:
100.((NewSample-OldSample)/((NewTime-OldSample)/SampleFrequency)) CounterMultiTimerInverse is simply the inverse of CounterMultiTimer :
100.NumberOfItemsSampled-CounterMultiTimer CounterMultiTimer100ns is an average sample among multiple items per 100 nanoseconds:
100.((NewSample-OldSample)/((NewTime-OldTime)/100 ns ))/NumberOfItemsSampled CounterMultiTimer100nsInverse is the inverse of CounterMultiTimer100ns :
100.NumberOfItemsSampled-CounterMultiTimer100ns CounterTimer is the percentage of items over the sample period:
100.((NewSample-OldSample)/(NewTime-OldTime)) CounterTimeInverse is the inverse of CounterTimer :
100-CounterTimer ElapsedTime is the elapsed time for the measurement:
(SampleTime-SampleStartTime)/SampleFrequency The NumberOfItems32 , NumberOfItems64 , NumberOfItemsHEX32 , NumberOfItemsHEX64 counters have no calculation since they indicate fixed values.
RateOfCountsPerSecond32 and RateOfCountsPerSecond64 are the number of counts per time base:
((NewSample-OldSample)/(NewTime-OldTime))/SampleFrequency The RawFraction counter returns the raw fraction between two values:
100.(Sample/BaseValue) SampleCounter is the difference between samples:
(NewSample-OldSample)/(NewBaseValue-OldBaseValue) SampleFraction returns the fractional difference between samples:
100.((NewSample-OldSample)/(NewBaseValue-OldBaseValue)) Timer100ns gives the percentage of time (in 100ns units) for the counter:
100.((NewSample-OldSample)/(NewTime100 ns -OldTime100 ns )) Timer100nsInverse is the inverse of Timer100ns :
100-Timer100ns Analysis
There are two sets of information you can use to evaluate the performance of your web applications “ the .NET performance counters, and custom counters. ASP.NET has an extensive list of counters, which are well documented in the framework SDK.
Analysis of custom counters is application-specific, and there are no hard rules as to what you should analyze. It really depends upon what counters you have created and when you update them. Remember that custom counters can easily be tracked in the Performance Monitor.
Using tools such as WAST, you can test your application and collect performance counters for analysis, perhaps in a spreadsheet. You can also use the PerformanceCounter object to query counters, although this is a task best left to applications other than ASP.NET. This is because accurate monitoring depends on regular sampling of data, and this isn't a task that ASP.NET is suited to. In this case you'd be better off building a Windows Forms application that could sample the data at regular intervals.
EAN: 2147483647
Pages: 243