Instrumenting Applications
|
| Since the inception of computer programs, there have been bugs and performance-challenged applications. For developers, this is one of the reasons that they have jobs. For operations, this is a reason to blame developers. The problem is that each job category of the people responsible for the application seems to have a different language and interpretation of the events that led up to someone claiming that there is a bug or performance problem with the application. For some people, the response is always, "It just broke. I was sitting there minding my own business and it just broke." For others it is "I did A, B, and C and it started to perform very slowly." Unfortunately, when you start investigating the problem, you discover that they didn't do A, B, and C, but they did D, E, and F. Not only does this lead to a lot of frustration, but also to quite a bit of wasted time. Fortunately, you have an option. You can build in functionality to report on the health, performance, and events of a system. This is known as instrumenting an application. Introduction to Instrumenting an ApplicationThe phrase instrumenting your application refers to the act of modifying it to generate internal events and metrics. By instrumenting your application, you are adding the ability for people or processes outside the application to determine its health, performance, and events. This can be an important feature when attempting to debug your application; determining potential areas of improvement and performance bottlenecks; logging of transactions; and formulating the sequence of events of an application that is either in development or production. There are five basic reasons to instrument your application:
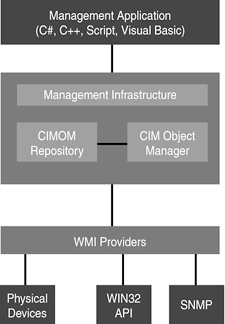
Instrumenting Versus External MonitoringThere are two basic types of application monitoring that can be performed: external monitoring techniques and instrumenting. When using external monitoring techniques, you are essentially using some form of query to check the metrics of an application. For example, consider the Task Manager. In the Task Manager, you can check to see which processes are running, how much CPU time they are utilizing, how much memory they have allocated, and if they are still responding (application hang). On a basic level, this is useful. However, what if the Task Manager asserts that an application is using an exorbitant amount of memory and is utilizing 100% of the CPU? After seeing this information, the natural next questions are "What is the application doing? What steps were being executed?" The answer to both questions is that you can't determine an answer from the Task Manager. The information simply isn't available. When you rely on an external program to monitor your application, you are completely at its mercy. When you instrument your application, you are taking control. You specify which metrics need to be reported and in what fashion. You can also specify specific tracing routines that should be executed and how they will be made available to the end user. Simply because you have more control over the content and method of reporting system health, performance problems, critical failures, and general metrics, instrumenting an application is superior to using external monitoring techniques. Methods of InstrumentationThere are many methods with which to instrument your application. You can choose to use the Windows event log, the Windows trace log, Windows Management Instrumentation, or you could use a custom technique for relaying you metric information to the end user. With the exception of creating a custom instrumentation technique (which is beyond the scope of this book), the next section will focus on the three more common techniques of instrumentation: Windows event log, Windows trace log, and Windows Management Instrumentation. Windows Event LogThe Windows event log, shown in Figure 44.1, is one of the easier ways to instrument your application. It enables you to write information to a log that is maintained by the Windows operating system. Users can retrieve and display the event log at a later date and time. Figure 44.1. The Windows event log.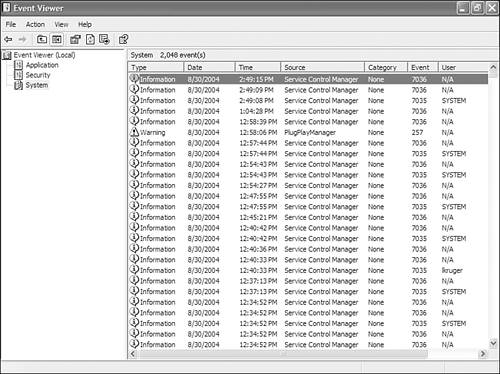 Using C#, it is easy to write information to the Windows event log. The .NET Framework provides an EventLog class that enables you to easily create and delete logs, add log entries, read entries, and respond to log entries. When writing to the event log, you must specify an event source. This registers your application as a valid provider of log entries for that log. TIP Because the Windows event log can store only a limited number of entries, it is recommended that the Windows event log be used only for lower-frequency events such as errors, warnings, and high-level audit information. Listing 44.1 shows a simple application that checks to see whether a log exists. If a log doesn't already exist, if(!EventLog.SourceExists("EventLogDemo", "Enter Machine Name Here")) and EventLog.CreateEventSource("EventLogSource", "EventLogDemo", "Enter Machine Name Here"); Listing 44.1. Simple Event Log Demo using System; using System.Diagnostics; namespace Sams.VisualCSharpDotNetUnleashed.WindowsEventLogDemo { /// <summary> /// Summary description for Class1. /// </summary> class EventLogDemo { /// <summary> /// The main entry point for the application. /// </summary> [STAThread] static void Main(string[] args) { Figure 44.2. The EventLogDemo event log.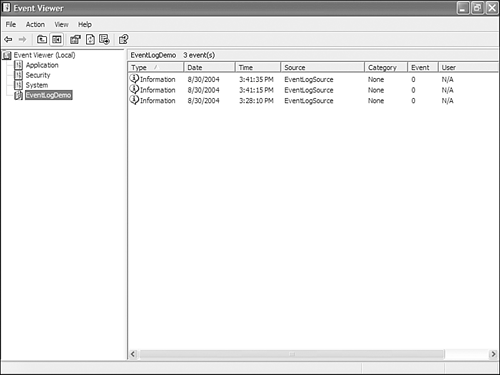 Examining the Debug and TRace ClassesAs previously stated, the phrase instrumenting an application refers to modifying an application to monitor or measure the level of its performance and to diagnose errors. In the world of programming, this means that the application has the capability to incorporate code tracing, debugging, performance counters, and event logs. Provided in .NET are the trace and Debug classes. These classes give you the means to monitor your application's performance during both development and after deployment. Adding Debug and Trace Code to Your ApplicationAdding debug and trace code to your applications is simple. For a debug statement, you simply add the following: System.Diagnositics.Debug.WriteLine("This is a Debug Statement!"); For a trace statement, there is a minor change: System.Diagnositics.Trace.WriteLine("This is a Debug Statement!"); Of course, the previous statements are at a basic level. There are several overloaded methods of both the Debug and trace classes that enable you to add variables and format them to their proper usage. When testing your application, you can build your application with the DEBUG and/or TRACE conditional attributes turned on. This enables you to view both Debug and trace statements. When you deploy the application, simply recompile the application with the DEBUG and/or trACE conditional attributes turned off. This instructs the compiler not to include the debug and trace code in the final executable. TIP To view debug and/or trace code, you must instruct the compiler to include this code in your executable. This is done by setting the DEBUG and/or TRACE conditional attributes to true. Visual Studio .NET includes both the trACE and DEBUG conditional attributes. This enables you to specify whether to include Debug, trace, or both in your executable. Trace SwitchesIn addition to tracing of your code, it is sometimes desirable to filter out some of the messages. For example, if you have an application that is monitoring the status of a bit on an I/O port and you are polling the bit every millisecond, you might want to see the results of all the individual reads, or you might want to see the status only when the bit changes. After all, if you view the status every millisecond, you will have 1,000 statements every second. Fortunately, .NET provides trace switches to aid in filtering trace statements. With trace switches, you can enable, disable, and filter tracing output. The best part about trace switches is that they are configurable from the .config file. In .NET, there are two basic types of trace switches: BooleanSwitch and traceSwitch. BooleanSwitch The BooleanSwitch acts as an on/off switch. To use the BooleanSwitch, simply instantiate a BooleanSwitch variable and check the Enabled property. For example, the following code snippet checks the enabled property and outputs the statement (if enabled) to the console: static BooleanSwitch booleanSwitch = new BooleanSwitch( "Some Category", "Some Module"); static public void SomeMethod(string location) { // Code omitted for brevity. if(booleanSwitch.Enabled) Console.WriteLine("Error occurred at " + location); } traceSwitch The traceSwitch class provides multilevel switching to control trace and debug output from your application. As previously stated, the traceSwitch is configurable from the .config file. As a general rule, trace switching is generally deployed disabled. It is only when a problem occurs, or you need more information about what is happening in your application, that you would enable this functionality. Before you can use a switch, you must first create an instance of a switch from a BooleanSwitch, traceSwitch, or a custom switch class. The following code snippet demonstrates the basic use of TRaceSwitch: static TraceSwitch traceSwitch = new TraceSwitch("Some Category ", "Some Application"); static public void TraceSwitchMethod() { // Output this message if the TraceSwitch level is set to Error or higher. if(traceSwitch.TraceError) Console.WriteLine("A trace message."); // Output this message if the TraceSwitch level is set to Verbose. if(traceSwitch.TraceVerbose) Console.WriteLine("Another trace message."); } For detailed information about using debug statements, trace statements, and trace listeners to instrument your application, please see Chapter 43, "Monitoring Your Application." Windows Management InstrumentationWindows Management Instrumentation (WMI) is Microsoft's implementation of the Web-Based Enterprise Management (WBEM) initiative. Included in the .NET namespace System.Management.Instrumentation, WMI has interfaces to languages such as C++, HTML, ODBC, and Visual Basic. In the following section, you will learn the basics of instrumenting an application through WMI. WMI ArchitectureWMI uses the Common Information Model (CIM) to represent managed components such as applications, systems, devices, and networks. As shown in Figure 44.3, WMI consists of a management infrastructure (Common Information Model Object Manager [CIMOM] Repository and CIM Object Manager) and WMI providers. The CIMOM provides applications with uniform access to management functions and the WMI providers are components that serve as mediators between the CIMOM and managed objects. Figure 44.3. WMI architecture.
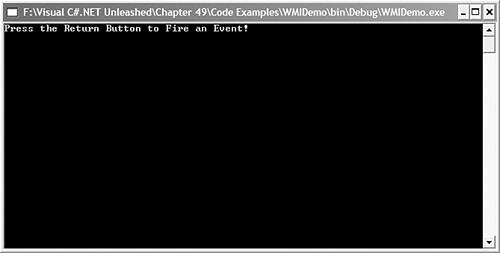
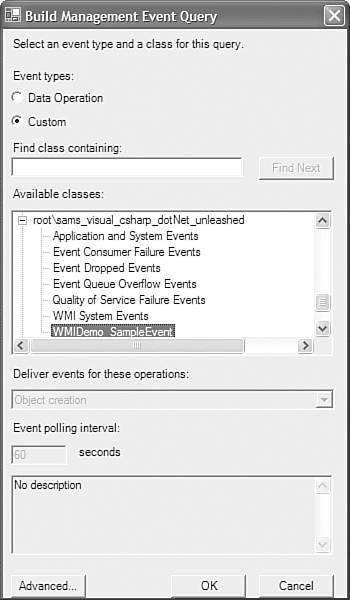
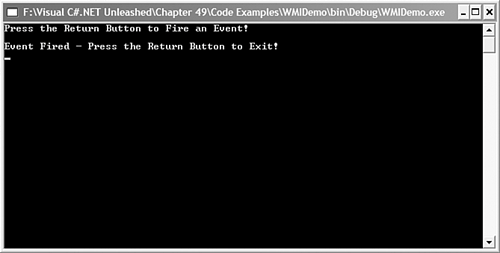
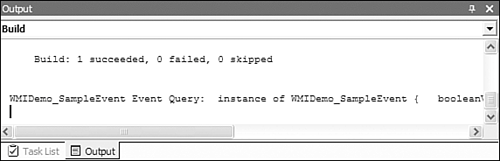
The WMI architecture provides two features that enable you to easily write powerful applications. The first is that the WMI is extensible. It allows you to seamlessly add providers to the architecture. The second helpful feature is that WMI hides the details of specific instrumentation sources from the CIMOM and the CIMOM in turn hides the capabilities of specific providers from a WMI-based client application. This allows the CIMOM to present a uniform set of capabilities (queries, method execution, events, and updates). Listing 44.2 shows a basic WMI-instrumented application. It demonstrates how to expose a class to a WMI client application and fire an event. To run and view the capabilities of the application follow these steps:
|
|