Identifying Optimization Needs
ProfilingYou don't have to wait until you've completed your presentation to see how it will look or how it's behaving. Macromedia Flash MX gives you the freedom to profile a document as you create it. This helps you troubleshoot problems as you goan extremely useful feature, since most of the time Flash documents grow to become quite complex. If we waited until the very end to test our published presentation, it may be difficult to pinpoint where a certain problem is occurring and why. Examining or profiling a Flash document's published presentation is a key component in measuring the success of the final product. Are certain scripts working? Are rollovers within buttons happening the way you envisioned them? Is the presentation too long or too short? Are the sounds crisp? This chapter outlines the key aspects of ensuring success and avoiding surprises when it comes time for final output. Flash gives you various ways to identify where your document needs optimization. The two main tools in retrieving this information are the size reports and the bandwidth profiler. Previewing MoviesWhile you're creating your Flash document, you can test the movie anytime to see if all is working properly to that point. This allows you to isolate any problems right away. To test your movie, select Control, Test Movie from the top drop-down menu. TIP The keyboard shortcut to test your movie is Control-Enter (Windows) or Command-Return (Macintosh). Whenever you test your movie, Flash creates an SWF file of that document for you. When you're previewing your movie, you're brought into the Macromedia Flash Player 6. You can now utilize all the benefits of the standalone player to profile your file. You can also use tools such as the bandwidth profiler and debugging features (see Table 16.1). When you're in the Flash authoring environment, you can see all the movie clips in action. By previewing a Flash document, you can see if all your movie clips are acting correctly. For example, you can confirm that all the buttons are functioning and animating properly. NOTE Although Enable Simple Buttons lets you see your buttons in action while you're in the Flash authoring environment, if you have embedded movie clips in any of the button's frames , you will not see them in action. To see these movie clips, you need to preview the movie. Table 16.1. Flash Playback Profiling Tools
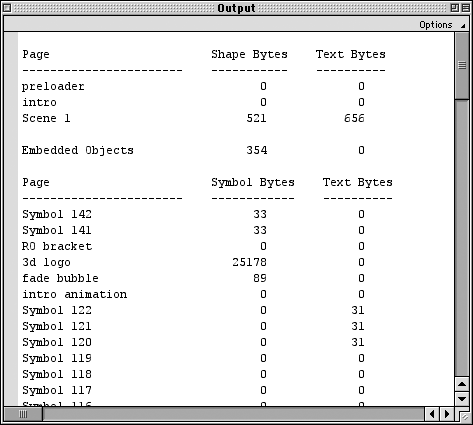
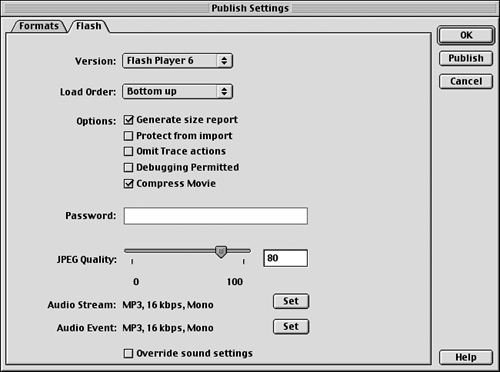
The Bandwidth ProfilerAnother tool that helps locate trouble spots in your Flash document is the bandwidth profiler (see Figure 16.1). It lets you see how your movie will act once it downloads. The bandwidth profiler consists of two panes: The left pane displays movie, settings, and state information. In this example, the site is 107 Kbytes' big. To preload the site at a bandwidth or modem connection speed of 4,800 bytes per second, it would take about 15 seconds. all this pertinent information can be retrieved from this left pane. Figure 16.1. The bandwidth profiler helps you locate trouble spots in your Flash document. The right pane displays a frame-by-frame bar graph. The numbers along the top indicate frames, and the numbers along the left side indicate the size of these frames. Each bar is measured in kilobytes. In this example, at frame 83 there is something weighing in at about 20 Kbytes. This allows you to check what is occurring at the 83 rd frame of this movie. You can then go in and tweak it, thus improving the overall file size of your movie. To activate the bandwidth profiler, you select View, Bandwidth Profiler from the top drop-down menu in Macromedia Flash Player 6. You are automatically brought into this player whenever you test your movie. The Output WindowThe output window is initiated through the Test Movie control in Flash. If syntax errors are present, this window opens by default, listing any and all errors and their location within the Flash document (see Figure 16.2). If you want to open this window, you simply select Window, Output Window from the top drop-down menu. Figure 16.2. The output window launches automatically if there are any syntax errors in your Flash document when you run a test movie. The right pane displays a frame-by-frame bar graph. The numbers along the top indicate frames, and the numbers along the left side indicate the size of these frames. Each bar is measured in kilobytes. In this example, at frame 83 there is something weighing in at about 20 Kbytes. This allows you to check what is occurring at the 83 rd frame of this movie. You can then go in and tweak it, thus improving the overall file size of your movie. To activate the bandwidth profiler, you select View, Bandwidth Profiler from the top drop-down menu in Macromedia Flash Player 6. You are automatically brought into this player whenever you test your movie. The Debug FeatureOnce inside the Macromedia Flash Player 6, you can test your Flash movie on various modem-connection speeds to see how your movie will display at those speeds. These debug features can be found under Debug in the top drop-down menu. Simply select the speed at which you wish to test, and the bandwidth profiler will change and display the suggested results accordingly . Generating a Size ReportOne way to see what items are contributing to the growth of your Flash document's file size is to generate a size report (see Figure 16.3). Figure 16.3. Flash can generate a size report to see what items are contributing to your document's file size. To generate a size report, select File, Publish Settings from the top drop-down menu. Once you're in the Publish Settings dialog box, be sure to select the Flash check box under Type. Once you do that, a Flash tab becomes available. Click the Flash tab to display all its options (see Figure 16.4). You will see that one of the options is to have Flash generate a size report. Check that option and click the Publish button. Once the SWF file is published, the output window populates with the size report. Figure 16.4. The Flash format has multiple options to choose from. This report details every use of all items used in your Flash document, showing each item's file size. Using Figure 16.1, notice the size of the 3-D logo is 25,178 bytes. To bring the size down, you can go into that symbol and tweak some of the information being rendered there, thus improving your overall file size.
|
EAN: 2147483647
Pages: 142


