Debugging Client-Side Script Using Visual Studio .NET and Internet Explorer 6
Debugging Client-Side Script Using Visual Studio .NET and Internet Explorer 6
VS .NET supports the debugging of client-side scripts, including JavaScript, VBScript, and JScript. VS .NET provides debugging services in conjunction with a script host such as Internet Explorer (IE). Script debugging works differently from server-side debugging in that you must specify the exact process you want to debug. Once you load the script into the script host, you can attach the VS .NET script debugger directly to the script host process and set breakpoints throughout the script.
Follow these steps to set up client-side script debugging using VS .NET and IE 6.0 (these software versions represent the minimum required versions for script debugging, in large part because VS .NET must have IE 6.0 installed on the same machine.):
-
Open IE and enable script debugging for your machine by selecting Tools Internet Options and switching to the Advanced tab. Scroll down to the Browsing category and uncheck the Disable Script Debugging box.
-
Next, load the script in the script host. Using IE, browse to the script that you want to debug. The script may be embedded within an *.html or *.aspx page as an include file. You should have only one IE window open to make it easier to locate the process to which you need to attach.
-
Now, open VS .NET and load the project for debugging. You open the project that contains the script you want to debug and then open the script in a code window.
-
Attach the debugger to the script host process. In other words, in VS .NET, open the Processes window, as shown in Figure 8-15, by selecting Debug Processes.
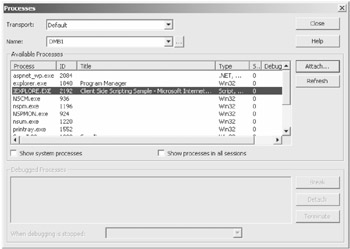
Figure 8-15: The Processes dialog box -
Locate the IEXPLORER.EXE process from the Available Process list and highlight it. Next, click the Attach button. You will see a pop-up window, shown in Figure 8-16.
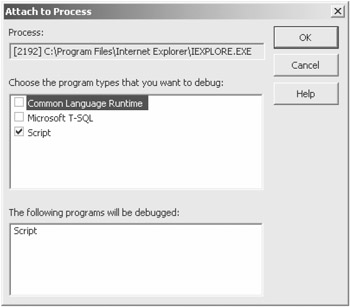
Figure 8-16: The Attach to Process dialog box -
Check the Script check box and click OK, which returns you to the Processes dialog box. The Processes window should now show the IEXPLORER.EXE script host process in the Debugged Processes window (see Figure 8-17). The process has been assigned a Process ID that uniquely identifies the process thread. Below this window is a combo box that indicates the action to take when debugging is stopped . You may choose to either detach the debugger from the process or to terminate the script host process completely.
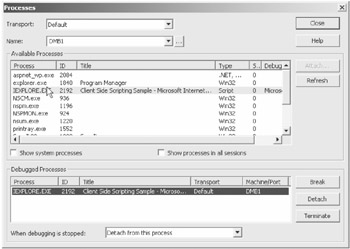
Figure 8-17: The debugged Processes window -
Click the Close button, and the VS .NET project will now be in break mode.
-
Now you can set your breakpoints. Switch to the code pane that contains the debugged script and set breakpoints. You cannot set a breakpoint directly on the JavaScript function declaration. Instead, you must set the breakpoint just inside the function. You can set the breakpoint on a variable declaration as long as the declaration also initializes the variable in the same line (see Figure 8-18).
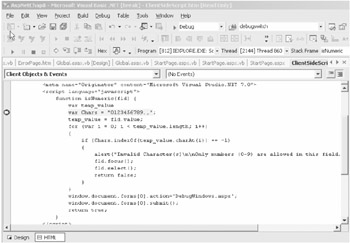
Figure 8-18: Client-side script debugging process -
Finally, detach or terminate the debugged process: You can stop debugging anytime from within VS.NET or by manually closing the IE browser window. If you close the process from within VS.NET, the debug window shows a message like the following:
The program '[1588] IEXPLORE.EXE: Script program' has exited with code 0 (0x0).
This concludes the discussion of debugging tools and technologies in VS .NET.
EAN: 2147483647
Pages: 91