Using Tracing Tools in ASP.NET
Tracing documents the execution path of an application and allows you to write trace statements and run assertions without interrupting the execution flow. By contrast, debugging enables you to interact with the code during execution and affect its outcome. There are two distinct programmatic tracing tools available for ASP.NET applications:
-
The TraceContext class: This is a special class only available to ASP.NET that allows tracing at the page level.
-
The Trace class: This is a robust class defined in System.Diagnostics.Trace that provides methods and properties to trace the execution of an application.
Using the TraceContext Class
The TraceContext class captures and presents execution details about a Web request. Specifically designed as a tracing tool for ASP.NET applications, the TraceContext class is available through the System.Web namespace in the Page.Trace property. When you use the Trace property in an ASP.NET page, it is important to understand that you are using an instance of the TraceContext class, not the more robust Trace class defined in the System.Diagnostics.Trace namespace.
In addition to showing user -provided trace content, the TraceContext class automatically includes performance data, control-tree structure information, and state management content. Trace information may also include some of the lifecycle stages of a page request. The TraceContext class is useful as a quick way to view the state of a page and the events within the rendering of the page. It is purely a method to show the state information for a page. Output of the TraceContext class is appended to the page and does not provide support output to another resource.
Using the TraceContext Class Methods and Properties
The TraceContext class provides two methods to write to the trace log: Warn() and Write() . Each method supports up to three arguments, a tracing category, a text message, and optional error information. If only one argument is passed, then it will be treated as the text message. If two arguments are passed, then the first argument will be treated as the category and the second argument as the text message. The only difference between the two methods is that the text from the Warn() method is displayed in red.
The TraceContext class has two properties:
-
IsEnabled: Indicates whether tracing is enabled for the current Web request
-
TraceMode: Gets or sets the sorted order in which trace messages should be output to a requesting browser
You can use these properties programmatically to control the tracing characteristics of a page.
Enabling the TraceContext Class
Whether the statements using the TraceContext class take effect on the page depends on whether page-level tracing is enabled or disabled. Similar to the Debug class statements discussed earlier, if page-level tracing is disabled, then the TraceContext class statements do not output to the page. You can control page-level tracing either at the page level or at the application level. Enabling page-level tracing directs ASP.NET to append a series of diagnostic information tables to the output of the page and to display any custom diagnostic messages from the TraceContext class to the trace information table. The information and tracing messages are appended to the output of the page and sent to the requesting browser. The information is also available using a separate trace viewer (discussed in the "Enabling Application Trace in Web.config" section).
Enabling Page-Level Tracing with the @ Page Directive
You control page-level tracing with the Trace attribute of the @ Page directive. To enable tracing for a page, add the Trace attribute to the @ Page directive at the beginning of the *.aspx file and set its value to "true."
<%@ Page Trace=" true" TraceMode=" SortByCategory" %>
As an example, the following code enables page-level tracing in GasLaw.aspx and adds Trace.Warn() statements to trace the logical flow of the page based on different inputs:
Private Sub WriteTrace(ByVal strMsg As String) Trace.Warn(strMsg) End Sub
The trace output appears as shown in Figure 8-19 for an input with a zero value.
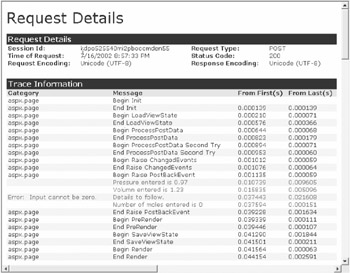
Figure 8-19: Trace outputs using the Warn() and Write() methods
Interpreting the Page-Level Trace Output
Page-level tracing output provides six sections of detail, as described in Table 8-5.
| OUTPUT SECTIONS | DESCRIPTION |
|---|---|
| Control Tree | The Control Tree section displays information about server controls within the page. It displays the ID, type, render size, and view state size of the control. The information gives an idea of the controls being used, as well as the associated cost (render size and view state). |
| Cookies Collection | The Cookies Collection section displays the names , values, and sizes of the cookies that the client sends in the request headers. |
| Headers Collection | This section provides the HTTP headers presented by the client to the server. It is a simple table that lists name -value pairs. |
| Request Details | The Request Details section displays basic request information, such as the session ID, time of the request, HTTP request type, and HTTP response status code. |
| Server Variables | The Server Variables section displays a name-value pair table of server variables. |
| Trace Information | The Trace Information section displays a table view of categories and messages, including messages from the TraceContext.Warn() and Write() methods. This section also provides the time from first to last byte. |
Enabling Application Trace in Web.config
You can enable tracing for the whole application by setting the <trace> section values in the Web.config file, under the System.Web node. To enable application trace, set the enabled attribute in the trace node to "true" and set the other optional attributes. This has the same effect as setting the page-level Trace attribute to "true" on each page within the application:
<configuration> <system.web> <trace enabled=" true" requestLimit="10" pageOutput=" true" traceMode=" SortByCategory" localOnly=" true" /> </system.web> </configuration>
The trace configuration in Web.config has five trace attributes that control the tracing characteristics (see Table 8-6).
| PROPERTY | DEFAULT | DESCRIPTION |
|---|---|---|
| enabled | "false" | Sets the ASP.NET page- or application-level trace. |
| localOnly | "true" | Set to "true" if you want the trace viewer ( trace.axd ) to function only on the host Web server; otherwise set to "false." |
| pageOutput | "false" | Set to "true" to display the trace information both on an application's pages and in the trace viewer ( trace.axd ); otherwise set to "false" to only display in the trace viewer. |
| requestLimit | "10" | Number of page requests to store on the server. |
| traceMode | "SortByTime" | Indicates whether trace information is displayed in the order it was processed , "SortByTime," or alphabetically by user-defined category, "SortByCategory." |
These attributes are scoped at the application level, but they are overridden at the page level by any attributes defined in the @ Page directive.
Using the Trace.axd HttpHandler
With the Web.config file, you can enable application tracing but disable the output from displaying directly on the Web page:
<system.web> <trace enabled=" true" pageOutput=" false" requestLimit="10" localOnly=" true" /> </system.web>
In this case you would use the Trace.axd handler to read the trace output from the page. Trace.axd is an HttpHandler, which is a specialized class for handling HTTP Requests (HTTP handlers are discussed in great detail in Chapter 2, "Introducing ASP.NET Applications"). The trace.axd handler displays the trace output from an ASP.NET page. When requested , the handler gives a trace log of the last n requests; n is determined by the value set by requestlimit="[int]" in the configuration file.
To use the trace.axd utility, simply request trace.axd from the root application directory. This brings up a listing of the last n requests in the application, as shown in Figure 8-20.
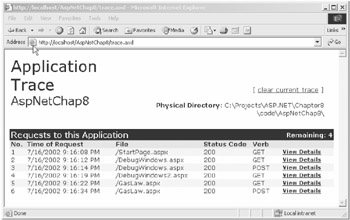
Figure 8-20: Trace output using the trace.axd utility
The View Details link brings up the trace information for each request. The only difference is trace.axd does not display the page outputs.
Using the Trace Class
The Trace class offers a robust set of methods that mirror the methods of the Debug class discussed earlier. The Trace class is in the System.Diagnostics namespace; you must import this namespace to use the class.
Enabling the Trace Class
You configure tracing with the Trace class as part of the project's property pages. By default, tracing is enabled in both debug and release builds. You can set the trace mode in the project's property pages under Configuration Properties Build Define TRACE constant. When checked, the Trace class statements are compiled into the build.
Understanding the Trace Class Methods
The Trace class has the same set of methods as the Debug class. Table 8-7 describes the methods available in the Trace class.
| METHOD | DESCRIPTION |
|---|---|
| Assert() | Tests a specified condition and displays a message if the condition is "false." |
| Fail() | Sends a message to the Listeners collection. Message will include the customer message and a dump of the call stack. |
| Write() | Writes information to the trace listeners in the Listeners collection. |
| WriteIf() | If the condition is "true," writes information to the trace listeners in the Listeners collection. |
| WriteLine() | Same as Write() except this method includes a carriage return. |
| WriteLineIf() | Same as WriteIf() except this method includes a carriage return. |
Adding Listeners to the Trace.Listeners Collection
As stated earlier, you can customize the target of the Debug class's assertion message by adding listeners to the Debug.Listeners collection. The Trace class behaves similarly. By default, the DefaultTraceListener is added to the Listeners collection to provide the default output methods for the Trace class. The DefaultTraceListener writes to the Output window, so you must add other listeners to output to other destinations if the Trace is to function outside the debug environment. These other listeners inherit from the TraceListeners base class.
As an example, you can update the CheckInput subroutine in GasLaw.aspx to write to the event log. Writing to the event log requires the EventLogTraceListener. Here, you use the Add() method in the Listeners class to add your EventLogTraceListener to the collection. You use the Contains() method to make sure you do not add more than one listener. The updated code is as follows :
Private Sub CheckInput(ByVal dblInput As Double) Dim myTraceListener As New EventLogTraceListener("AspNetChap8") If traceSwitch.Enabled Then If Not System.Diagnostics.Trace.Listeners.Contains(myTraceListener) Then System.Diagnostics.Trace.Listeners.Add(myTraceListener) End If System.Diagnostics.Trace.Assert((dblInput <> 0), _ "Error: Input cannot be zero.", "Details to follow.") End If End Sub When this code is executed, you will get the error in the event log, as shown in Figure 8-21.
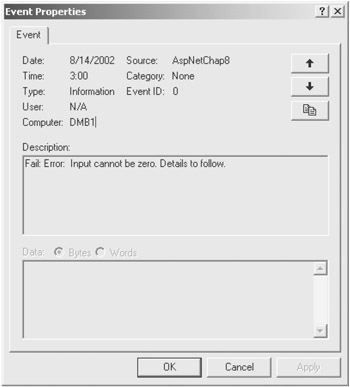
Figure 8-21: Trace error message in the event log
Trace Switching
You can control when information is written to the output target of a trace by using the features of the BooleanSwitch and TraceSwitch classes. The BooleanSwitch class provides a simple on/off activation switch, and the TraceSwitch provides a multilevel switch. To use a BooleanSwitch, first define the level of the BooleanSwitch in the Web.config file. The configuration in the file should be as follows:
<configuration> <system.diagnostics> <switches> <!-- This switch controls data messages. In order to receive data trace messages, change value="0" to value="1" --> <add name=" mySwitch" value="1" /> </switches> </system.diagnostics> ... </configuration>
You can find an example of using the BooleanSwitch in GasLaw.aspx . First create a new instance of the BooleanSwitch:
Private Shared myBoolSwitch As New BooleanSwitch("mySwitch", _ "Trace Boolean Switch") Then, you use the BooleanSwitch.Enabled property to determine whether to output trace information. The Enabled property returns "true" if the BooleanSwitch is enabled (set to 1) in Web.config . In this example, the WriteTrace() subroutine performs this task as follows:
Private Sub WriteTrace(ByVal strMsg As String) If myBoolSwitch.Enabled Then System.Diagnostics.Trace.WriteLine(strMsg) End If End Sub
| Note | In the preceding sample, you could achieve the same functionality with the following statement: System.Diagnostics.Trace.WriteLineIf(myBoolSwitch. Enabled, strMsg) . However, you will usually get better performance by testing the BooleanSwitch before calling the debug (or trace) method. This saves the overhead of evaluating all the parameters in the WriteLineIf method. |
TraceSwitch provides a mechanism to define multiple trace levels within an application. To define the settings, add a TraceSwitch configuration in Web.config as follows:
<system.diagnostics> <switches> <!-- This switch controls general messages. In order to receive general trace messages change the value to the appropriate level. "1" gives error messages, "2" gives errors and warnings, "3" gives more detailed error information, and "4" gives verbose trace information --> <add name=" TraceLevelSwitch" value="1" /> </switches>
Previously, we have added a switch named "TraceLevelSwitch" and assigned it a value of 1. In code, you can read the value for TraceLevelSwitch by creating a Share member as follows:
Private Shared trSwitch As New BooleanSwitch("TraceLevelSwitch", "Trace Switch") ... If trSwitch.Level = TraceLevel.Error Then System.Diagnostics.Trace.WriteLine(strMsg) End If The TraceLevel is a predefined enumeration within .NET, as shown in Table 8-8.
| NAME | VALUE | DESCRIPTION |
|---|---|---|
| Off |
| No trace messages |
| Error | 1 | Output error handling messages |
| Warning | 2 | Output error handling messages and warnings |
| Info | 3 | Output error handling messages, warnings, and informational messages |
| Verbose | 4 | Output all messages |
This concludes the discussion of tracing tools in VS .NET.
EAN: 2147483647
Pages: 91