Using Debugging Tools in Visual Studio .NET
Debugging an ASP.NET Web application with VS .NET is similar to debugging a Windows application. The integrated VS .NET debugger provides powerful tools for debugging both types of applications. In this section we describe some of the debugging tools provided by VS .NET for debugging ASP.NET applications both locally and on a remote server. Debugging involves discovering and correcting logical and semantic errors within the application. To meet these needs, the debugger allows you to inspect and modify the runtime behavior and state of the application through a set of server-side debugging tools integrated into VS .NET.
Using the Task List Window to Resolve Build Errors
VS .NET provides good support to help troubleshoot and resolve build and syntax errors. When a project is built in VS .NET, build errors will be written to a Task List window, with a text description of the error, and the file and line number on which the error occurred. Figure 8-5 shows a Task List window with a build error. The window shows an "Argument not specified" error, which is caused by calling a function without the correct number of arguments.
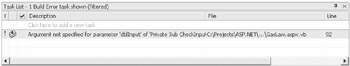
Figure 8-5: Task List window
You can click the error in the Task List and VS .NET will open the file and highlight the specific code within the file that causes the build error. A useful feature of the Task List window is the ability to keep track of the outstanding build errors since the last build. When you fix an error, it disappears from the Task List.
Setting the Debug Mode
To debug an ASP.NET application, you must first create a debug build using the debug build type. Then you must instruct the application to use the debug symbols. Debug mode tells ASP.NET to generate symbols for dynamically generated files and enables the debugger to attach to the ASP.NET application. You set the debug configuration attribute in the Web.config file in the <compilation> section. To enable debug mode, set the debug attribute to "true":
<compilation defaultLanguage=" vb" debug=" true" />
Because attributes are case sensitive, make sure the attribute name is "debug," not "Debug" or "DEBUG." ASP.NET automatically detects any changes to the Web.config file and applies the new configuration settings. You do not need to recompile the application after changing this setting because the setting simply instructs ASP.NET to attach the application to the existing debug symbols. ASP.NET applications inherit settings from Web.config files at higher levels in the URL path . The highest-level file, named Machine.config , is at the machine level and is located in the systemroot\Microsoft.NET\Framework\versionNumber\CONFIG directory. All ASP.NET applications inherit the base settings from this file. These hierarchical configuration files allow you to change settings for several ASP.NET applications simultaneously . Chapter 2, "Introducing ASP.NET Applications," provides a detailed discussion of ASP.NET application configuration.
Working in Debugger Windows and Dialog Boxes
Debugging involves the use of a debugger, a powerful tool that allows you to observe the runtime behavior of your program and determine the location of semantic errors. Using a debugger, you can examine the content of variables in your program without having to insert additional calls to output the values. You can insert a breakpoint in your code to halt execution at a certain point. When your program stops (in other words, enters break mode), you can examine local variables and other relevant data using the VS .NET debugger window and dialog boxes. Some windows allow you to execute statements, and others simply allow you to monitor current, in-scope variables. Table 8-3 summarizes the debugger window and its corresponding functionality.
| WINDOW | FUNCTIONALITY |
|---|---|
| Autos | Displays variables used in the current statement and the previous statement. The current statement is the statement at the current execution location. |
| Breakpoints | Lists all breakpoints currently set in your program and displays their properties. You can use this window to set (create) new breakpoints, delete breakpoints, enable or disable breakpoints, edit a breakpoint's properties, and find the source or disassembly code corresponding to a breakpoint. |
| Call Stack | Displays the function or procedure calls currently on the stack. |
| Command | Either issues commands or debugs and evaluates expressions in the IDE. |
| Disassembly | Shows assembly code corresponding to the instructions created by the compiler. These assembly instructions correspond to the native code created by the JIT compiler, not the intermediate language generated by the VS .NET compiler. |
| Locals | Displays variables local to the function containing the current execution location. |
| Memory | Displays large buffers, strings, and other data that do not display well in the Watch or Variables window. |
| Modules | Lists the modules (DLLs and EXEs) used by your program and shows relevant information for each. |
| Output | Displays status messages for various features in the IDE. These include build errors that occur when a project is compiled and the results when Transact-SQL syntax in a stored procedure is checked against a target database. |
| QuickWatch | Evaluates a variable or expression and edits the value of a variable or register. |
| Registers | Displays register contents. Values that have changed recently appear in red. |
| Running Documents | Helps debug scripts, especially scripts generated by code on the server. It displays a list of documents currently loaded into the process you are running. |
| This (Me) | Examines the data members of the object associated with the current method. |
| Threads | Examines and controls threads in the program you are debugging. A thread is a sequence of executable instructions created by a program. |
| Watch | Evaluates variables and expressions and keeps the results. You can also use this window to edit the value of a variable or register. |
Most of the time, you will not need to use all these windows while debugging an ASP.NET application. You enable the debug windows through their respective tool menu. You can drag and anchor each window anywhere on the development window within VS .NET. When you are not using a window, you can hide it by selecting the Auto Hide icon or close it by clicking the Close icon. Let's discuss some of the most commonly used debug windows in further detail.
Some of the main functions provided by the debug windows are the ability to evaluate variables and expressions and to set or edit the value of a variable. Several windows support this set of functions, notably the Autos, Locals, QuickWatch, This (Me), and Watch windows. The only difference between these windows is the scope of the variables within the window's control. Many of the windows are available only when the application is in break mode. One of the common methods to enter break mode is to set breakpoints in the application. To set a breakpoint, right-click on the left sidebar of the code window next to the line of code in question, or press F9 to set a breakpoint on the line where the cursor is located. Figure 8-6 shows a breakpoint set within the DebugWindows2.aspx file in the sample project.
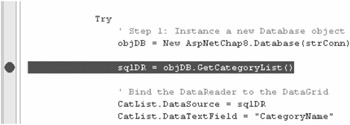
Figure 8-6: Setting a breakpoint
Using the Autos Window
The simplest way to check the variables in the current and previous statements is to use the Autos window. This window provides the smallest scope among the windows. To display the Autos window, choose Debug Windows Autos. (The debugger must be running or in break mode.) The window automatically identifies and displays the variables in the current and previous statement ”hence the name Autos .
In the DebugWindow2.aspx file, you return an array by using the Select() method within the Tables collection:
sortExp = "ProductName ASC" drarray = myDS.Tables(0).Select(filterExp, sortExp, DataViewRowState.CurrentRows)
The easiest way to check whether the input parameters to the Select() method are correct is to use the Autos window. Figure 8-7 shows the Autos window in VS .NET. If you wanted to change the value of a listed variable in a debug window, you would select the variable value to edit by double-clicking it or by pressing the Tab key. Then type in the new value and press the Enter key. In Figure 8-7, the sortExp variable is selected and is in the process of being edited.
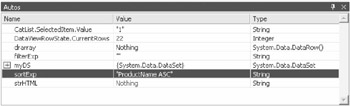
Figure 8-7: The Autos window
Using the Locals Window
The Locals window provides the ability to view and update variables local to a function. To display the Locals window, choose Debug Windows Locals. (The debugger must be running or in break mode.) The Locals window is similar to the Autos window. Instead of merely listing the variables from the current and previous statements, the scope of the variables within the Locals window is the function of the current execution location. As an example, Figure 8-8 shows the Locals window displaying the variables found in the Autos window as well as other variables local to the function Button1_Click .
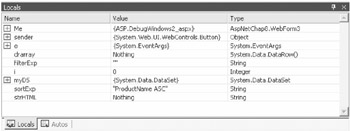
Figure 8-8: The Locals window
You can change the scope of the Locals window by doing one of the following:
-
Using the Debug Location toolbar to select the desired function, thread, or program
-
Double-clicking an item in the Call Stack or Threads window
You can change a variable the same way as in the Autos window. Select the value by double-clicking it, type the new value, and press Enter.
Using the Watch Window
The Watch window enables you to evaluate variables and expressions and edit the value of a variable or register. To display the Watch window, choose Debug Windows Watch and then click Watch1, Watch2, Watch3, or Watch4, depending on which one you want. (The debugger must be running or in break mode and supports a maximum of four Watch windows.) The behavior of the Watch window is similar to the other debug windows discussed, with the exception that the user specifies the variables listed in the Watch window. Figure 8-9 shows the Watch window with two variables, drarray and sortExp .
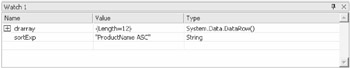
Figure 8-9: The Watch window
To add a new variable to the Watch window, select a row within the window and type the variable in the Name column. Once you add a variable to the Watch window, you can continue to monitor its value as you step through your program execution.
Using the QuickWatch Dialog Box
You can use the QuickWatch dialog box to quickly view a variable, expression, or register. The two ways to open the QuickWatch dialog box are as follows :
-
From the Debug menu, choose QuickWatch. (The debugger must be in break mode.)
-
In a source window, right-click a variable name and choose QuickWatch from the shortcut menu. This automatically places the variable into the QuickWatch dialog box. (The debugger must be in break mode.)
Because QuickWatch is a modal dialog box, you cannot leave it open like the Watch window to watch a variable or expression while you step through your program. If you need to do that, you can add the variable or expression to the Watch window by selecting the variable in the QuickWatch window and clicking the Add Watch button. Figure 8-10 shows the QuickWatch dialog box with the variable drarray, which holds the DataRow object that is returned from the Select() method of the DataSet using this code:
filterExp = "" sortExp = "ProductName ASC" drarray = myDS.Tables(0).Select(filterExp, sortExp, DataViewRowState.CurrentRows)
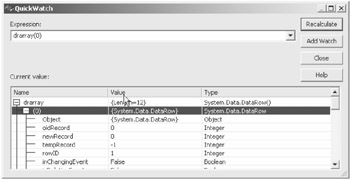
Figure 8-10: The QuickWatch window
Using the Breakpoints Window
The Breakpoints window lists all breakpoints currently set in your program and displays their properties. In the Breakpoints window, you can set (create) new breakpoints, delete breakpoints, enable or disable breakpoints, edit a breakpoint's properties, or find the source or disassembly code corresponding to a breakpoint. To display the Breakpoints window, select Debug Windows Breakpoints. Figure 8-11 shows an example of the Breakpoints window.
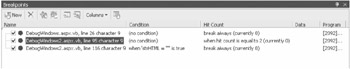
Figure 8-11: The Breakpoints window
To view or edit the properties of the breakpoint, right-click a breakpoint and select Properties to show the Breakpoint Properties dialog box (see Figure 8-12).
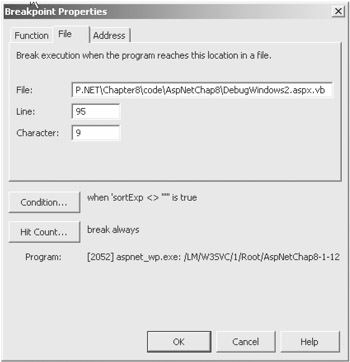
Figure 8-12: The Breakpoint Properties dialog box
Note that the Breakpoints Properties dialog box displays the condition and hit count parameters for each breakpoint. The condition parameter allows you to set a conditional expression to control when the breakpoint takes effect. The hit count parameter allows you to set one of four conditions:
-
Break always
-
When hit count is equal to n (where n is an editable numeric parameter)
-
When hit count is a multiple of n
-
When hit count is greater than or equal to n
So, a question arises while discussing breakpoints: Can you edit code while in break mode? VS .NET does provide an option to do this under Tools Options Debugging Edit and Continue. The command actually behaves differently based on the type of language used in your program. VS .NET does not support Edit and Continue for Visual Basic or C# code. You can use the command for C/C++ programs only. In Visual Basic or C#, you cannot edit the code and continue debugging with the new code. Instead, the program behaves according to the selection in the Edit and Continue options window, as shown in Figure 8-13.
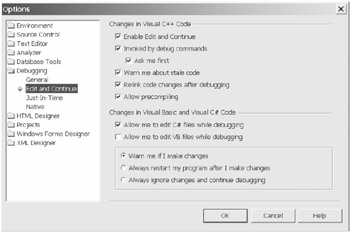
Figure 8-13: The Edit and Continue options window for Visual Basic,Visual C#, and Visual C++
Using the Command Window
The Command window allows you to issue commands or to debug and evaluate variables expressions in the debugger. To display the Command window, choose View Other Windows Command Window. The command has two modes: the command mode and the immediate mode.
Working in Command Mode
The > prompt within the Command window indicates the window is in command mode. The command mode executes VS .NET commands or commands not found within the menu system. VS .NET commands allow the user to display ”and in some cases, execute ”dialog boxes, windows, and other items within the IDE through a keyboard command. For example, you can add the selected variable within the code window to the QuickWatch window by typing the following while in command mode:
Debug.QuickWatch
The command mode supports IntelliSense, so you can view the list of available commands within the window. The command mode also supports aliases, which can be custom defined using the alias command. VS comes with a set of predefined aliases for your convenience. To view the list of existing aliases, type alias while in command mode. A predefined alias commonly used is ? , an alias for Debug.Print.
Working in Immediate Mode
You use the immediate mode for evaluating expressions, executing statements, and printing variable values. To open a Command window in immediate mode, press Ctrl+Alt+I. To change from command mode to immediate mode, enter debug.immediate or use the alias immed . There is no prompt within the Command window when in immediate mode. Instead, the window title will display "Command Window ”Immediate." To switch back to command mode from immediate mode, enter cmd or press Ctrl+Alt+A.
You can evaluate and execute expressions during the debug process while in immediate mode. You can also execute a single command while in immediate mode by prefacing the command with a greater-than sign ( > ).
Using Programmatic Debug Tools
An integral part of development is the ability to programmatically output relevant information during an application's execution. You can debug application flow by strategically placing several debug statements throughout the code and writing information out to a specific window. The Output window displays text output from the various IDE tools, including debug statements. The debug windows allow you to do much the same thing, so you rarely need to insert debug statements into code just to check values. One method of debugging is to check for conditions within the application to make sure the logic is correct. An assertion is a statement placed within an application that evaluates to "true" when the condition in the argument to the assertion evaluates to "true." By defining the assertion arguments to correspond to the application logic, you can use assertions to determine if the application is functioning properly. The .NET Framework provides a Debug class, which you can use to print debugging information and emit assertions.
Using the Debug Class
The Debug class provides write and assert methods to help debug applications during development. The Debug class is part of the System.Diagnostics namespace and must be imported into the code to be used. With the Debug class, you can record information about errors and application execution to logs, text files, or other devices for later analysis. The compilation configuration drives the availability of the Debug class. By default, a debug build compiles the procedures and functions of the Debug class, whereas a release build does not. Therefore, debug statements do not affect the size and performance of an application's release version.
Table 8-4 describes the Debug class's methods.
| METHOD | DESCRIPTION |
|---|---|
| Assert() | Checks a condition and writes a message to the Listeners collection if the condition is "false." |
| Fail() | Writes an error message to the trace listeners in the Listeners collection. The message will include the passed-in message string and a dump of the call stack indicating where the Fail() method was called. |
| Write() | Writes information to the trace listeners in the Listeners collection. |
| WriteLine() | Same as Write() except this method includes a carriage return. |
| WriteIf() | Writes information to the trace listeners in the Listeners collection if a condition is "true." |
| WriteLineIf() | Same as WriteIf() except this method includes a carriage return. |
By default, the Debug class writes all messages in the Output window by passing the messages to the set of listeners within the Listeners collection. You can write the debug messages to other destinations by adding other types of listeners to the Listeners collection. This will be covered in more detail in the section "Adding Listeners to the Trace.Listeners Collection."
Debugging with Assertions
There are many times during development when you need to check for logic errors within the application. Certain application flows and conditions may generate unforeseen errors caused by logic errors. Assertions help you pinpoint these problem areas in the application.
You can use an assertion to test conditions within the application that should hold true if the application is functioning correctly. An assertion raises if the condition of the specified argument to the assertion evaluates to false. If the condition evaluates to true, then the assertion has no effect on the application. For example, a mathematical application may have assertions to make sure the divisor is not equal to zero. If it is equal to zero, then the condition would be false, and an assertion would raise. This would help the programmer debug what condition caused the divisor to be set to zero.
The Debug.Assert() method evaluates a condition and, if the result is false, sends diagnostic messages to the Listeners collection. The Assert() method outputs the call stack with file and line numbers for each line in the call stack. The default behavior of the Assert() method outputs the message to the default trace output, when the application is run in user-interface mode, and also displays the message in a message box. You can customize this behavior by adding a listener to, or removing one from, the Listeners collection.
The GasLaw.aspx page of the AspNetChap8 project includes an example of the Debug.Assert() method. The page calculates a value of the Ideal Gas Law, PV=nRT , provided the other three parameters are entered. Figure 8-14 shows this page.
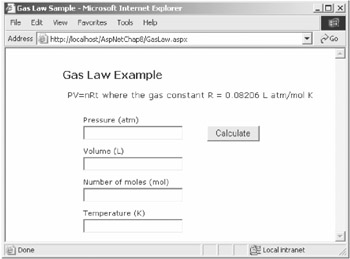
Figure 8-14: The Gas Law example page for illustrating debugging
The page includes a subroutine that tests to make sure the input values are not zero. You must import the System.Diagnostics namespace to use the Debug class:
Imports System.Diagnostics Private Shared debugSwitch As New BooleanSwitch("debugLevelSwitch", _ "Debug Boolean Switch") Private Sub CheckInput(ByVal dblInput As Double) If debugSwitch.Enabled Then Debug.Assert((dblInput <> 0), "Error: Input cannot be zero.", _ "Details to follow.") End If End Sub The subroutine does not automatically assume that debugging is enabled. Instead, it uses the BooleanSwitch class to read a flag from the Web.config file. You can use a simple configuration setting to dynamically enable or disable debug code from executing:
<system.diagnostics> <switches> <add name=" debugLevelSwitch" value="1" /> </switches> </system.diagnostics>
The assertion statement will be evaluated only if the debug switch is enabled. Whenever the input is equal to zero, the condition will be false and the assertion will take effect, writing the assertion message to the Listeners collection. The Assert() method has two optional string arguments for the short message and the long message. They are outputted with the assertion, if available. In this case, because no additional listeners were added to the Listeners collection, the default listener will output the message to the Output window as follows:
-- DEBUG ASSERTION FAILED -- -- Assert Short Message -- Error: Input cannot be zero. -- Assert Long Message -- Details to follow. at GasLaw.CheckInput(Double dblInput) C:\Projects\ASP.NET\Chapter8\code\AspNetChap8\GasLaw.aspx.vb(46) ...
When an application is compiled in a release configuration, Debug.Assert() statements are not included in the compilation. Thus, it is important when using Debug.Assert() statements to make sure that the logic and functionality of the application does not change when the assertion is removed. Otherwise, you may introduce a bug that only exists in the release build. Also, it is a good idea to avoid procedure or function calls within the Assert() method call. The reason is that other procedures and functions may change the state or value of variables and have an adverse effect on the application.
EAN: 2147483647
Pages: 91
- ERP Systems Impact on Organizations
- ERP System Acquisition: A Process Model and Results From an Austrian Survey
- Context Management of ERP Processes in Virtual Communities
- Intrinsic and Contextual Data Quality: The Effect of Media and Personal Involvement
- Development of Interactive Web Sites to Enhance Police/Community Relations