Hack 91 Track System Performance with the Performance Console
Hack 91 Track System Performance with the Performance Console Before you can hack away at things to speed up your computer, you should know how to monitor system performance in the first place. As a power user , you'll like knowing what's causing those slow- downs and blips in performance. The Performance Console is a great hacker's tool for monitoring and tracking resources of all kinds . Computers get faster every year, but somehow we still end up sometimes waiting around for them to finish a task.
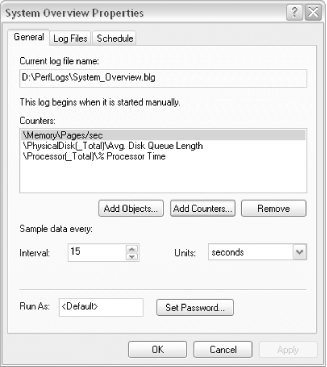
To figure out what's slowing your computer down and get to the root of the problem, use the Performance Console ( perfmon ) to track and graph the activities of Windows XP and its components . First, I'll show you how to set up a log, and then I'll give you some ways to put the console logs to good use. 11.2.1 Setting Up Your Logs Choose Start To create log files of your system's performance, click Performance Logs and Alerts in the left pane of the MMC. You can create counter logs (with the values of performance indicators, measured on a regular basis), trace logs (with the values of performance indicators when something happens, such as a program crash), and alerts (an action for Windows to take when a counter hits a specified value). Log files stored in text format contain one line per observation, with values separated by either commas or tabs, and are usually stored in the C:\Perflogs folder. You can import these log files into a spreadsheet or database for analysis, reporting, and graphing. SQL and binary (nontext) log file formats are also available. (See article Q296222 in the Microsoft KnowledgeBase for how to log data directly to an SQL database.) Create a counter log by right-clicking Counter Logs in the left pane and choosing New Log Settings from the shortcut menu. Specify the statistics you want to log by clicking Add Counters on the General tab of the Properties sheet for the log (see Figure 11-1). A nice feature of this utility is that you can choose whether to monitor the local computer or another computer on your LAN. Don't add more than a few counters, or your log file will grow quickly and be confusing to analyze. To select a counter, first select the performance object (i.e., the part of the computer system you want to monitor, such as memory or disks), and then choose counters from the list. Figure 11-1. Creating or editing a performance log Set the interval to the frequency you'd like to sample the data. Don't choose too frequent an interval, or your log file will take over your entire hard disk (start with once a minute). On the Log Files tab, specify the file type, name , and location. If you plan to import this file into a spreadsheet or database program, choose Text File (comma-delimited) for the type. On the Schedule tab, specify when the log start and stopsmanually, or automatically on a schedule.
11.2.2 What to WatchThese counters are often worth logging:
11.2.3 Viewing Performance LogsWith the System Monitor in the MMC, you can view a log as a graph. Click System Monitor in the left pane of the MMC window and click the View Log Data icon on its toolbar. Add the log file to the list. When you are looking at the graph, click the Properties button on the toolbar to change how the graph looks. To look at the contents of a comma-separated ( .cvs ) log file in Excel or your default spreadsheet program, double-click the filename in Windows Explorer. Excel may complain that the file is still open (since the Performance Console is still appending information to it); click Notify to see what's in the file so far. In Excel, you can analyze, graph, and print the counters. 11.2.4 Performance AlertsCreate an alert to let you know when a counter exceeds a specified value. For example, the Performance Console can let you know when the idle processor time drops below 10%. Right-click Alerts in the left pane of the MMC window and choose New Alert Settings to create a new alert. Add one or more counters, and specify the limit (upper or lower) beyond which Windows should take action. On the Action tab, specify what Windows does when the alert occurs: specifically , you can have it add a note to an event log or run a program. Margaret Levine Young |
EAN: 2147483647
Pages: 166
 Advanced