Monitoring System Utilization
System utilization is the broad term given to the notion of overall system load. As I've touched on in earlier chapters, system load is caused by a myriad of factors ”some of which are obvious, some of which aren't.
All the sections in this chapter that discuss system-based performance tooling in fact refer to overall system utilization. However, in the spirit of breaking down each form of hot spot within a system, you'll consider system utilization to be CPU, memory, and swap utilization in a performance context.
Each operating system has its own representation of system load and requirements, and each operating system has a different representation of what's high load and what's low load. In a WebSphere application server environment, any application that's performing badly could be caused by system overutilization. Then again, the WebSphere application itself might be causing the system utilization to be too high. This could constitute either a poorly written application or a poorly designed platform (in other words, one that's undermodeled).
As you've seen in earlier chapters, the Java Virtual Machine (JVM) is somewhat similar to a mini-operating system that sits on top of the core operating system. It manages its own threads and memory allocation and therefore is susceptible to CPU bottlenecks and poorly performing memory. Poorly performing memory refers to situations where your physical Random Access Memory (RAM) is depleted and swap memory or virtual memory is used excessively.
Generally , there's nothing wrong with your server operating system using swap and virtual memory as long as it's not used for runtime applications. Most of the time, the operating system will swap out unused applications to disk in order to free up the real physical memory for running and active processes.
Another way to look at it is to consider the performance (or lack thereof) of a JVM that's operating within swap or virtual memory and is continually performing garbage collection. The performance of the application would be abysmal.
CPU and System Load: Unix
Common with all Unix-based systems are a number of key load and performance identifiers that can be attributed to system load:
-
Load average
-
Number of waiting processes (similar to load average)
-
CPU utilization (percent available, percent used, and by what)
-
Memory usage
-
Swap usage and utilization
The uptime command on Unix is an important tool to gauge an approximate load rating of the server:
/> uptime 12:10pm up 62 day(s), 23:11, 13 users, load average: 0.07, 0.20, 0.23
Essentially , what this is showing is a bunch of information related to system usage. The information that you're most interested in is in the last three columns , which shows the load average of the server for the past 1, 5, and 15 minutes.
The load average value isn't exactly a highly accurate rating, but when used as a "measuring stick," it can be helpful. For example, if you've found that during a Stress and Volume Testing (SVT) run a particular WebSphere system operates with a one-minute load average of 6, with 70 percent CPU utilization, then you can use the load average along with the CPU utilization as a baseline.
| Tip | You can further improve the value of this type of baseline analysis by understanding the system's load at other system utilization ratings, such as 50 percent, 60 percent, and 80 percent. By using simple extrapolation, you should be able to plot the characteristics of the environment at these different system utilization ratings, with them appearing as a near linear line on a graph. |
If, then in production, you notice that the load average is, let's say, 12, you can generally state that something isn't operating correctly.
As you can see, this load average by itself is just a measurement ”it shows or proves nothing in terms of understanding what part of the system is running "hot."
What Is the Load Average?
The load average is an indicator that reports the average number of processes waiting in the Run queue. The Run queue, in Unix, is the controlling mechanism of the operating system that manages what processes and jobs run when, where, and how (in other words, the queue priority and the CPU and process priority). As you'll see in a moment, the vmstat command can also help you better understand what causes a load average to go high.
There's also no real rule that states what constitutes a high load average and what constitutes a low load average. As a guide, however, I tend to work with the notion that a system is operating within normal capacity if the load average doesn't exceed a value of 4 for every one CPU in the system. Therefore, if you have a 32-CPU system, a load average of 128 wouldn't be a major issue. It'd suggest that there's a lot of things going on within your server, and typically this type of load would be more representative of a database server or financial system.
On the other hand, if you had a load average of 18 on a single- or dual-CPU system, you'd have a major performance problem with your WebSphere applications.
Drilling Down to a High Load Average
So, you've notice your WebSphere environment operating sluggishly, you've run the vmstat command, and you've found that the load average is slightly high ” what do you do next ?
The vmstat command is your friend in this case. It shows a great deal about a Unix server's status. When you run it, a typical output will look similar to the following. This does vary, however, from Unix flavor to Unix flavor, but the basic elements are universal:
/> vmstat procs memory page disk faults cpu r b w swap free re mf pi po fr de sr dd dd s0 in sy cs us sy id 2 0 0 4078832 1321240 36 391 24 3 5 0 12 7 12 0 0 440 234 697 17 9 75
This output is showing you a snapshot of your overall system. The important columns to look for are the first three columns, the free size under the memory group (the fifth column), the sr column, and the last three columns.
| Note | In many Unix systems, a single line of vmstat output is usually incorrect because the application needs at least two inputs to correctly perform the calculations to obtain items such as CPU utilizations . Always run vmstat with at least two to five output lines via the command vmstat 1 5 ( 1 represents frequency, and 5 represents setting it to run five times). |
The first three columns are another representation of your load average. The first column is the Run queue, identified by the r . The second column is the I/O blocking average. If you constantly have a figure greater than zero in this column, your disks may be suffering under load.
The w column represents the swapped or waiting processes. This will be high if many processes on your system have a potential shortage of physical memory.
The sr column is the scan rate of the paging daemon. This will be different between Unix systems, but the figure basically represents how often the paging daemon is scanning the free page list for free pages. If this figure is constantly higher than 120 per 30 seconds, then you may have a shortage of memory and the system is starting to swap constantly. This is a sure sign of the need for additional RAM.
The last three columns show the state of the CPU (or CPUs if you have a multi-CPU system). The us field is the percentage of CPU utilization of processes consumed by user -based processes. This includes WebSphere and the WebSphere-managed JVMs.
The cs column indicates the number of context switches occurring during the test interval period. Context switches , in the vmstat output, refer to the number of both voluntary and forced context switches occurring within the CPUs during that period. A context switch is the associated event for when a process releases its time slice of a CPU. Generally, only one process can operate on the CPU at any one time, so if this value is high, then this can indicate that your system is overloaded and that various processes aren't getting sufficient time on the CPU.
It's difficult to give you a rule of thumb on this figure, but what you should do is capture this value during idle periods and during SVT and baselining and then use it as a guide to when there may be excessive context switching.
The switching itself of the processes on and off the CPU(s) occurs for two reasons. First, the process may have used up its delegated time slice on the CPU and is forced off the processor (an involuntary context switch). Second, the process voluntarily switches off the CPU in order to call or access an external interface such as disk or network interface.
Generally, if this figure is high, compared with your idle or baseline measurements, your processes may be struggling to get sufficient time on the CPU. This is a sure sign that either something in your environment is running out of control (such as in a broken process looping) or too much is going on within the system for the number of CPUs you have.
The sy column represents the system processes. This accounts for kernel activity. If this is high, then it indicates a lot of time is being spent on disk and network I/O, interrupts, and system calls. You should ensure that sy doesn't equal or exceed that of the user field. In fact, a healthy system shouldn't see a ratio any higher than 5:1 for user-to-system CPU utilization.
Determining Memory Usage: Real and Swap
Like the general Unix command and tool sets, Unix memory analysis is similar between competing Unix flavors. A number of tools can help you understand the current memory and swap usage. The most common tool available on all Unix flavors is the top command.
The top command is a handy tool that shows you a whole range of information when run by itself. A typical top output may look like the following:
last pid: 19972; load averages: 0.00, 0.00, 0.01 57 processes: 53 sleeping, 3 zombie, 1 on cpu CPU states: % idle, % user, % kernel, % iowait, % swap Memory: 512M real, 90M free, 18M swap in use, 278M swap free PID USERNAME THR PRI NICE SIZE RES STATE TIME CPU COMMAND 18536 was 11 25 2 39M 19M sleep 0:02 0.00% java 18517 was 10 34 2 39M 19M sleep 0:02 0.00% java 18508 was 10 0 2 38M 17M sleep 0:01 0.00% java 18553 was 11 16 2 37M 14M sleep 0:01 0.00% java 18522 was 10 14 2 37M 14M sleep 0:01 0.00% java 18506 was 19 0 2 34M 12M sleep 0:01 0.00% java 13713 was 1 47 4 25M 20M sleep 0:14 0.00% squid 342 was 5 58 0 6376K 2056K sleep 0:10 0.00% dtlogin 20515 root 1 46 4 3072K 1960K sleep 11:26 0.00% sshd 3168 root 1 58 0 3072K 1160K sleep 0:09 0.00% rpc.ttdbserverd 25705 root 1 41 4 2904K 1800K sleep 0:05 0.00% rpc.ttdbserverd
This top output is from a small Solaris server. You can tell this by the Solaris-specific items running in the command column.
The server is only running 512 megabytes (MB) of memory, of which 90MB is free. You can also see from the Memory line that 18MB of swap is in use.
If you're just after memory information, then you can run the top command and use Grep to extract only the memory line. For example, you can use top grep "Memory ". This will produce a line such as this:
~/hosts>/usr/local/bin/top grep Memory Memory: 2048M real, 1384M free, 853M swap in use, 3714M swap free
| Note | AIX Unix from IBM has a Monitor command that can provide details and statistics on memory usage. |
An important fact to note about the output of the top command is that it also allows you to break down and show the Java processes running within your server. This will ultimately be the WebSphere components and your JVMs that are operating your application servers.
With the previous top output, you're able to see that there are six Java processes running, all of which have approximate memory footprint sizes of 25MB and 39MB (from the SIZE column). This SIZE column shows the total memory consumed by that process, including swapped memory. The RES column shows the total amount of memory resident in memory, not swapped. These values should be capped at the maximum heap size for your JVM when viewing an output such as this.
Another method of obtaining a listing of the top processes running is to use the Unix ps command, which lists all processes running within your Unix server. There are two forms of ps . One is known as the standard SYS 5 Unix ps , and the other is the Berkeley (also called UCB) ps . Typically, the UCB ps is located in the /usr/ucb/ directory with the standard SYS 5 ps in /usr/bin or /usr/local/bin .
If you have the UCB version of ps , you can get a faster snapshot of the system state. For example, the following output is from a WebSphere server running multiple application servers. This output shows the top ten processes on the system from WebSphere (the command to obtain this is /usr/ucb/ps auxw head -10 ):
USER PID %CPU %MEM SZ RSS TT S START TIME COMMAND wasadmin 7376 4.9 10.112759041215920 ? S 21:52:07 61:37 /opt/WebSphere/.../java wasadmin 4018 0.8 9.812325841172632 ? S 10:22:06 26:09 /opt/WebSphere/.../java wasadmin 28974 0.6 9.712352161162848 ? S Aug 20 263:17 /opt/WebSphere/.../java wasadmin 1540 0.5 4.3652048512112 ? S Aug 11 420:23 /opt/WebSphere/.../java wasadmin 22633 0.4 6.8920232818184 ? S Aug 25 93:22 /opt/WebSphere/.../java wasadmin 1548 0.3 6.3884312755032 ? S Aug 11 302:15 /opt/WebSphere/.../java wasadmin 26404 0.3 6.7927128808720 ? S Aug 29 37:10 /opt/WebSphere/.../java wasadmin 1524 0.2 3.5512856412232 ? O Aug 11 188:54 /opt/WebSphere/.../java
The value in this output is that it shows you a snapshot of the top ten processes on your Unix server. Each process, all of which in this example are JVMs, is shown with its Process ID (PID), its CPU utilization, memory utilization, and a swag of other information such as start time, memory usage, and state. This is helpful output to determine if you have a particular JVM that's operating poorly or consuming too many system resources.
If you do happen to have a WebSphere Java process that's consuming a large amount of CPU utilization (as depicted by a high value in the %CPU column), you could track back to WebSphere and understand which Java application that is by using the PID.
Via the WebSphere Command Program (WSCP) or wsadmin tools (WebSphere 4 and 5, respectively), you can list the running state of each WebSphere application (for example wscp> ApplicationServer show < app_server_name > for WebSphere 4). Within those listings, a PID value is available. That PID corresponds to the Unix PID. Combining those items allows you to then find which PID is the offending or high-utilization process.
Swap Space
All operating systems, Unix and Windows alike, use a form of swap or virtual memory. In Unix, it's referred to as swap space . Swap space is essentially an overflow bucket of memory that the operating system can use to place less frequently used applications into when other, higher-priority applications require more physical memory.
The golden rule is to not use swap space for active processes. Doing so means that you reduce your memory access performance from 8 “60 nanoseconds for main memory to around 1,300 nanoseconds for disk-based swap plus operational overheads!
As soon as your active processes start to use swap for normal operations, your WebSphere application's performance will drop like a paperweight. It's a sure sign of insufficient memory in your server if this starts to occur.
Swap configuration is one area of Unix that has different commands for each flavor. For AIX, Linux, and Solaris, the following commands will display swap configuration:
-
Linux: free
-
Solaris: swap -l
-
AIX: lsps -a
You can also obtain swap information by using the aforementioned top command. The top command will provide you with a reading of your real memory and swap space usage via the command top grep "Memory" .
Here's an example:
~/> top grep "Memory" Memory: 2048M real, 1384M free, 853M swap in use, 3714M swap free
In this example, the server has 2 gigabytes (GB) of real memory, of which 1,384MB is being used, and approximately 4.5GB of swap space allocated, of which 853MB is being used.
Swap should always be at least double the size of your real memory. This provides the ability to core dump into the swap partition (if your Unix version supports this) as well as a good guide for configuring your swap bucket.
CPU and System Load: Windows NT/2000/XP
Since Windows NT became available on the market, the Windows server operating systems have come with a powerful performance monitoring tool. This tool, known as the Windows Performance tool is a graphical tool that provides information on just about every aspect of the Windows operating system.
Using this tool from a system and CPU utilization point of view, you're able to obtain a snapshot of various aspects of the state of your server. Similar to the previous Unix sections, you'll look at the following system-based states:
-
Overall server load
-
Queued processes
-
CPU utilization (percent available, percent used, and by what)
-
Memory usage
-
Virtual memory usage and utilization
CPU and Overall Server Load
In the Windows server Performance tool, there are several options that provide the ability to monitor a Windows server's CPU utilization. Within the Performance tool (usually found by Start ˜ Settings ˜ Control Panel ˜ Administrative Tools ˜ Performance), you're able to set up a tooling session where you can monitor, graph, and save information on the performance status of your server. The tool also allows you to save historic information relating to snapshots of your system's performance to view later.
Figure 13-1 shows main console screen of the Performance tool.
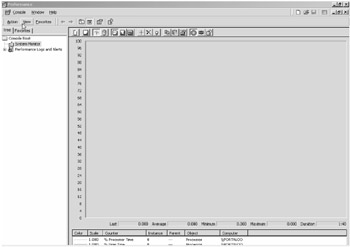
Figure 13-1: The Performance tool console
To set up and perform analysis on the utilization of the system, you need to choose which settings or components of the system you want to monitor. You do this by clicking the plus (+) button at the top of the console, as shown in Figure 13-2.
Figure 13-2: Adding a new monitor
At this point, you'll see a dialog box that allows you to select which elements you want to monitor. Follow these steps to set up active monitoring on your CPU:
-
Because you want to monitor CPU utilization in this example, set the Performance Object drop-down menu to Processor.
-
Once you do this, you want to select three options in the counters list: % Privileged Time, % Processor Time, and % User Time. You can select all three at the same time by pressing Ctrl and then clicking each of them with your mouse.
-
Now click the CPU you want to monitor (if you have a multi-CPU system) or select _Total from the right list, as shown in Figure 13-3.
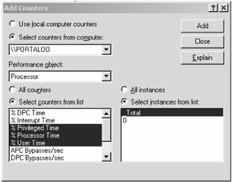
Figure 13-3: Selecting the monitor agents -
Click Add and then Close.
You'll return to the Performance tool's console, and the monitoring will commence. The key is to avoid excessive CPU utilization. If your server's CPU utilization for the % User Time counter is constantly higher than 60 “70 percent, then there are performance issues with your size of server or an abnormal process event is occurring. If your % User Time is high, then this typically means a running process is consuming too many CPU cycles.
It's possible to then drill down and view the WebSphere Java process similar to Unix if you find that your CPU is constantly utilized:
-
Open the Add Counters dialog box again (using the plus button shown in Figure 13-2).
-
Change the Performance Object option from Processor to Process.
-
On the right side of the dialog box, you'll then see a list of all active processes. Select the Java process that corresponds to your particular JVM.
-
On the left side of the dialog box, select % Processor Time (as shown in Figure 13-4).
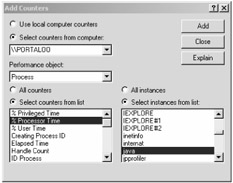
Figure 13-4: Adding the % Processor Time counter -
Click Close.
You'll then return to the main console where you can view the JVM process usage against the CPU utilization. If there's a correlation between the troughs and peaks of the CPU utilization and the JVM process usage, then you'll know you've found the problem JVM.
It's also possible to view the data in a report format as well as a historical format. Looking at Figure 13-5, select between the three icons that provide a different view of the data, highlighted by the circle.
Figure 13-5: Buttons to give you different views of the data
The three different views that are available allow you to switch between a Historical Graph view, a Total Summary view, and a Log Report view. Typically, the Historical Graph view is the most valuable view for understanding the state of your system's performance and resource load.
Memory Usage: Real and Virtual
Similar to Unix, Windows NT/2000/XP/2003 has virtual-like memory that allows the operating system to swap out unused processes into lower-priority memory. Although it's an important part of ensuring that you have enough overflow buffer and your applications don't run out of memory, it's also just as important to be sure your active applications don't try to run from virtual memory. Like Unix, this will quickly bring your server to a grinding halt.
To model the usage of memory and virtual memory, follow these steps:
-
Open the Add Counters dialog box, and in the Performance Object drop-down box, select Memory.
-
In the counters list, select Pages/sec and then click Add.
-
Select Available Mbytes in the counters list, and then click Add.
-
Click Close.
You'll return to the main console, and the new display should start to appear. At this point, you'll see the two monitoring lines continue across the screen.
The key item to watch here is how frequently the Pages/sec counter is higher than 100. If the value is constantly higher than 100, then there's many hard page faults occurring, typically pointing to a lot virtual memory in use. This can greatly slow down the performance of your applications. As your Available Mbytes counter approaches zero free, your Pages/sec average value will increase constantly. The CPU utilization will follow closely behind!
You can do a quick test by loading a Java application within WebSphere and monitoring this screen while you have users access the WebSphere application. As your load increases, memory consumption increases and page faults start to kick in (causing Pages/sec to increase). To a point, it's okay to have spikes every once in a while, but if it's a constant and the averages are high for both CPU utilization and the Pages/sec counter, then there's a shortage of memory in your server.
EAN: 2147483647
Pages: 111