The Dimensional Modeling Process
| | ||
| | ||
| | ||
With a basic understanding of dimensional modeling and the core techniques under your belt, this section shifts focus to describe the process of building a dimensional model. Creating a dimensional model is a highly iterative and dynamic process. After a few preparation steps, the design process begins with an initial graphical model pulled from the bus matrix and presented at the entity level. This model is critically scrutinized in a high-level design session that also yields an initial list of attributes for each table and a list of issues requiring additional investigation. Once the high-level model is in place, the detailed modeling process takes the model table by table and drills down into the definitions, sources, relationships, data quality problems, and transformations required to populate the model. The last phase of the modeling process involves reviewing and validating the model with several interested parties. The primary goals of this process are to create a model that meets the business requirements, provides the ETL team with a solid starting point and clear direction, and verifies that the data is available to fill out the model.
Designing a dimensional model is a series of successive approximations, where you create more detailed and robust models based on your growing understanding of the source systems, the business needs, and the associated transformations. This series of iterations usually stops once the model clearly meets the business needs in a flexible and extensible way. This iterative process typically takes a few weeks for a single business process dimensional model, but can take longer depending on the complexity of the business process, availability of knowledgeable participants , existence of well-documented detailed business requirements, and the number of pre-existing reusable dimension tables.
Figure 2.9 shows the dimensional modeling process flow; the modeling process runs down the left side, and the inputs and deliverables from each task run down the right. This process flow will be our roadmap as we cover each of the major steps both in this section and in the Adventure Works Cycles case study that follows . Note that the inputs to the dimensional modeling process are the deliverables from the requirements definition step.
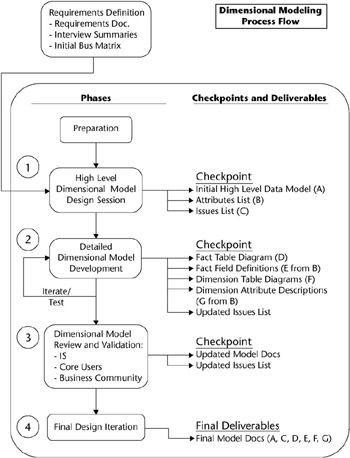
Figure 2.9: The dimensional modeling process flow diagram
The linear nature of the graphic can give the wrong impression . You will make many passes through the dimensional model, filling in blanks, adding detail, and changing the design over and over. Often weve made changes that sounded clever at the time, but ended up changing them back because they didnt work, either from the user or technical perspective, or both!
| Note | Creating the dimensional model is where an expert can help. If your team is new to the dimensional modeling process, bringing in someone who has extensive experience creating dimensional models can save you weeks of time, pain, and suffering. However, do not let the consultant take over the processmake them lead the team and facilitate the effort so everyone can participate in the design process and learn why various design decisions were made. Dont let the consultant disappear for a few days or a week or two and bring you back a completed model. The goal is to learn what goes into a dimensional model and why, so you know how to maintain and improve your model over time. More important, you need to know how to do the next one, so you dont have to pay someone to do this for you forever. |
Preparation
All the major steps in the Lifecycle involve an initial preparation phase. For dimensional modeling, preparation includes identifying the roles and participants in the modeling process, determining a data architecture strategy, reviewing the requirements document, setting up the modeling environment, and determining naming conventions. This section covers each of these areas in turn .
Identifying Roles and Participants
Creating the dimensional model is an iterative and interactive process. As Table 2.5 shows, several roles are involved in the modeling step, but a core modeling team of two or three people usually does most of the work. The core modeling team includes a data modeler with a strong technical background and solid experience with the source systems, and a business analyst who brings a solid understanding of how the data is used in the analysis process and how it could be made more useful or accessible. The core modeling team often includes someone from the ETL team with extensive source systems development experience and an interest in learning. The data modeler has overall responsibility for creating the dimensional model.
| PARTICIPANT | PURPOSE/ROLE IN MODELING PROCESS |
|---|---|
| Data modeler | Primary responsibility |
| Business analyst | Analysis and source expert, business definitions |
| Data steward | Drive agreement on enterprise names , definitions and rules |
| Business power user | Describe and refine data sources and business rules from a user perspective |
| Source system developer | Source expert, business rules |
| DBA | Design guidance, Early learning |
| ETL designer | Early learning |
| ETL developer | Early learning |
| Steering Committee | Naming, business definitions, model validation |
The data steward role is tightly linked to the modeling process because this role is responsible for driving enterprise agreement on the names, definitions, and business rules of the data elements that are used in reporting and analysis across the organization. This is a non-trivial effort that often gets mired in politics and personalities. The person who takes on the data steward role must be adept at interpersonal communications and organizational politics.
Try to include a business power user who has a particular interest or expertise in a business process. This person is usually very helpful in interpreting the data from a business perspective and can help speed the design. Also, this business power user can play the role of data steward in a pinch .
The core modeling team works closely with source system developers who can explain the contents, meaning, business rules, timing, and other intricacies of the particular source system involved in the dimensional model. You may need more than one source system expert to unravel the complexities of a given source system. You will almost certainly need to call on different experts as you model the different business processes on the bus matrix.
In addition to these participants, we suggest you include the DBA who will be implementing the physical database and the ETL designer and developer in the modeling process. These folks do so much better if they understand the business rationale for the model. Often the DBA comes from a transaction system background and wants to apply transaction system database design rules. In other words, the DBA wants to normalize the dimensions, which as weve described, does not work well for business intelligence queries. We find a similar tendency in the ETL designer. Without a full appreciation for the business requirements, the ETL designer often tries to simplify the ETL process by assigning certain calculations to the front-end tool, or skipping a description lookup step, or any of a number of time-saving shortcuts. While these do save time during the ETL development phase, they cost significant time whenever a user has to compensate for the omission.
There are generally a few additional participants as well. Although you risk slowing down the design process a bit by including more people, the benefits of a more robust design and engaged partners are almost always worth the price.
Understanding the Data Architecture Strategy
There are as many approaches to building a DW/BI system as there are consultants who dream them up. We will discuss the overall technical architecture of the Microsoft solution in Chapter 3. However, one of the big arguments centers on the issue of how you structure and manage your data. The questions are: What data do you keep, where do you keep it within your technical architecture, and how is it structured. Our standard approach is to build atomic-level dimensional models in the relational database platform that holds the lowest level of detail. This atomic level database provides for consistent data definitions, business rules, and tracking of history. It also supports the integration of data from multiple sources across the enterprise and from external sources such as vendors , customers, and third-party data providers. This atomic level also provides a means for including value-added data that is important to the analytic process but that currently exists only in spreadsheets on users desktops (if anywhere ). The atomic-level dimensional data warehouse is designed to be queried by users and built to meet their analytic needs and performance expectations. As we will describe in Chapter 3, this is generally true even though we encourage you to build atomic-level Analysis Services databases from the atomic-level relational warehouse and use Analysis Services as the primary query platform.
We believe both the relational and Analysis Services databases are key components of a successful enterprise Microsoft DW/BI system. The goal of this chapter, and of all the chapters that focus on the data track of the Lifecycle, is to make sure we build the system in a way that leverages the strengths of both tools. The good news is that a solid, well-designed dimensional model is the best foundation for both platforms.
Revisiting the Requirements
After the modeling team and the data strategy are in place, the teams first step will be to pull out the detailed requirements documentation and carefully comb through it. If you skipped to this chapter with the idea that you could avoid all that business stuff, sorry, but you need to go back and do the work. The modeling team must understand the business problems the users are trying to solve and the kinds of analyses they perform to solve them. Its the teams job to translate those requirements into a flexible dimensional model that can support broad classes of analysis, not just re-create specific reports . This isnt an easy job. The data modeler must be able to function at an advanced level in both the business and technical areas. In fact, much of the initial dimensional modeling effort actually begins as part of the requirements definition process.
| |
An experienced dimensional modeler can build a reasonable dimensional model based on the source system data structures. However, this model will inevitably fall short of meeting the business needs in many small but substantive ways. These little shortcomings add up to a weak dimensional model. We recently worked with a client whose requirements gathering had revealed a need for a field called PricingCategory. It turns out there is no such thing as PricingCategory in the source system. However, there was a Rate_Code field that in combination with some other status flags was the basis of what the business users called PricingCategory. A dimensional model based on the source system would have included Rate_Code (maybe) and left the users to re create the business rules for determining PricingCategory every time they built a query that needed the field.
In short, you must understand the business requirements in detail before you dive into the task of designing the dimensional model.
| |
The detailed business requirements document discussed in Chapter 1 has several sections that describe the high-priority business processes in detail. That document identifies analytic requirements supported by each high-priority business process. It describes the broad classes of questions and problems that management and business analysts have been trying (or would like to try) to answer. The requirements document should include a list of data elements, example questions, and even a list of desired reports that would help answer the analytic questions. These all play a central role when it comes time to defining the dimensional model. Your dimensional model must be able to answer these questions easily when it is finished, although the dimensional model is not built to provide a single target report.
Setting Up the Modeling Environment
It helps to get a few tools in place before you dive into the modeling process. We often start the modeling process using a spreadsheet as our initial tool because it allows us to make changes easily. Figure 2.10 gives a good example of the basic starting point for a model development spreadsheet. It captures the key elements of the logical model plus many of the physical attributes youll need later. It also gives you a place to begin capturing some of the ETL information, such as source system table and column(s), and a brief description of the extract and transformation rules. Finally, it includes the initial set of business metadata in the form of the names, descriptions, example values, and comments. In our ETL Toolkit book, we call this the logical data map. Regardless of the name , the central idea is to associate the original sources with the final targets.
Figure 2.10: Example dimensional model development spreadsheet
| Tip | You can get a copy of this spreadsheet at the books web site, www.MsftDWToolkit.com . Unhappy about the prospect of rekeying the model, we wrote a simple macro to generate the DDL to create the tables in SQL Server. We can then use the reverse-engineering capabilities of our modeling tool to pull the model out of the database. Our spreadsheet also writes the metadata info , such as the column description, transformations, and comments columns , into extended properties fields in the database system tables. Afterward, you can move this information into the metadata schema. |
This spreadsheet can be extended to include other columns that may be useful in your environment, such as physical name (if it will be different from the logical or business name), a short description that can easily fit into a tooltip, and a long description that fully captures the definition of the column or table.
Once the model gets fairly firm, typically after a few weeks, you can convert to your standard modeling tool. Most of the popular modeling tools (such as ERwin, PowerDesigner, Oracle Designer, E/R Studio, and Visio) allow you to lay out the logical model and capture physical and logical names, descriptions, and relationships.
| Tip | If you are using the spreadsheet mentioned previously, you can transfer its contents to your modeling tool by generating the script to create the database, building it in SQL Server 2005, and using your modeling tool to reverse engineer the database. A good tool will pull in all the elements youve already defined. |
Many of the tools are becoming dimensionally aware and have functions to support the creation of a dimensional model. For example, some tools can distinguish between a fact and dimension table; they can handle role-playing dimensions; and they can create multiple business process layers that correspond to the rows in the bus matrix. They also capture the information in their metadata stores and generally have a way to export or exchange that metadata with other systems or even with a centralized metadata catalog. Look for these features and take advantage of them.
Once the design is considered complete (for the first round, anyway), the modeling tools can help the DBA forward engineer the model into the database, including creating the tables, indexes, partitioning, views, and other physical elements of the database. Chapter 4 discusses these physical design issues. If you start using your modeling tool early on, things will be easier later.
Establishing Naming Conventions
Naming conventions are the rules you use to consistently name the objects in your dimensional model, and ultimately in the physical database. Spending time determining your naming conventions is one of those irritating tasks that feels like make-work. But it is definitely worth it in the long run.
Fortunately, it doesnt have to become your lifes work. There are ways to abbreviate the process. First, dont start from scratch. Use whatever naming conventions your organization has in place. Almost all large organizations have a group of data modelers and/or DBAs somewherethey might be called Data Administration, or Data Management. Somewhere in that group is the holder of the organizations official naming conventions. Given that you are reading the dimensional modeling chapter, you are likely either one of the folks in this group , or very close to them. Find the document and see if you can make them work for the DW/BI system. Existing naming conventions dont always work because sometimes they are not oriented toward user-friendly, descriptive names.
If youre in a smaller organization, dont despair. Several examples of naming conventions are available on the Internet. The web site for this book, www.MsftDWToolkit.com, has an example along with links to a few other examples. The point is, you dont need to start from scratch.
Data Profiling and Research
Once youve done your prep work, you can get started on the model. Throughout the modeling process, the modeler needs to dig into the under-layers of the data to learn about its structure, content, relationships, and derivation rules. You need to verify that the data exists (or can be created), that it is in a usable state, or at least its flaws are manageable, and that you understand what it will take to convert it into the dimensional model form. You dont have to find every piece of bad data or completely document every transformation at this point. Leave a little bit for the ETL folks to do.
This is not your first trip into data exploration. The requirements definition process in Chapter 1 included initial data profiling and data audit tasks to aid in the assessment of feasibility. The findings from those tasks are the starting point for this one.
Although data profiling is listed here as part of the preparation step, it is actually an ongoing process. As you work through the model table by table, filling in the list of attributes, you will find yourself returning to these data profiling and research tasks many times to resolve issues and clearly define each attribute.
There are several useful sources for detailed information about an organizations data, including the source system, data experts, and existing reporting systems.
Data Profiling and Source System Exploration
The data modeler usually has the benefit of both first-hand observation and documentation from the source system under investigation. Unfortunately, these two dont always line up. Gather and carefully review whatever documentation is available for the source systems. This might include data models, file definitions, record layouts, written documentation, and source system programs. More advanced source systems may have their own metadata repositories with all this information already integrated for your convenience. Dont count on this.
Perusing the source system data itself usually provides a quick jolt of reality. First, what you see typically does not match the documentation you carefully gathered and reviewed. Second, it usually is more difficult to unravel than you would hope. The older the system, the more time its had to evolve . This evolution, usually driven by short- term business needs, often takes the form of one or more of these standard data quality problems:
-
Substituted fields: We needed a place to store the new product group, and rather than re-org the table, we just used the product weight field since it really hadnt been used in a couple of years anyway.
-
Overloaded fields: We dont have any available fields in the database, so lets just append the product group on the product description field. We can separate the two with a ˜/.
-
Variable Definition fields: This field means product group unless we manufacture the product ourselves , in which case it lists the factory where it was manufactured.
-
Free form entry fields: Of course the Parent Customer data is in the database. The sales reps have been entering it into AddressLine5 for the last three years.
This is only a short listthere are plenty of other problems to be discovered . You can discover many of the content, relationship, and quality problems firsthand through a process that has come to be known as data profiling or data auditing . Data profiling is about using query and reporting tools to get a sense for the content of the system under investigation. Data profiling can be as simple as writing some SQL SELECT statements with COUNT s and DISTINCT s. An experienced modeler with a decent query tool and a source system data model can develop a good understanding of the nature of the source system data required for a given business process dimensional model in a few days.
On the other hand, data profiling can be a sophisticated study. Data profiling has become a product sub-category in the DW/BI software market. There are tools to make the data profiling task easier and probably more complete. These tools are available in stand-alone versions from data profiling tool companies, and the major ETL tool vendors include data profiling modules in their product offerings. The tools provide complex data analysis well beyond the realm of simple queries. They can reveal the following kinds of information:
-
The domain and distribution of the data in each column in a table
-
Relationships between columns, such as hierarchies and derivations
-
Relationships between tables, such as hidden foreign key relationships or columns with similar content
-
Common patterns in the data, such as telephone numbers , or zip codes, or money
-
Data quality problems, such as outlier values or exceptions to a common pattern, or exceptions to a relationship
Figure 2.11 shows a simple version of a data profile report for the Production.Product table from the Adventure Works Cycles transaction database. It gives a good sense for what the data in the Product table looks like. Starting at the top of the report, we see that there are 504 rows in the table. There are 504 distinct ProductIDs, Names, and ProductNumbers. Its interesting to note the ProductNumber isnt really a number at all. Moving down the list, only about half the products have a Color, the rest are NULL, and there are only nine distinct values for Color . A commercial tool would give us more information at the table level, and allow us to select on a column and drill down into its detail. But even this simple report gives us a good start on understanding the contents of the table.
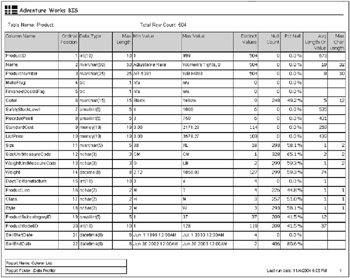
Figure 2.11: A simple data profile report for the Adventure Works OLTP Product table
| Note | The stored procedures and reporting services project that were used to create the data profiling report shown in Figure 2.11 are available at the books web site at www.MsftDWToolkit.com . They work on SQL Server tables only, but they do give you a place to start. |
Your goal is to make sure the data exists to support the dimensional model and identify business rules and relationships that will have an impact on the model. Write down any interesting complexities you uncover so the ETL folks wont have to re-discover them. You may not understand the exact business rules and derivation formulas as part of the modeling phase, but the modeling team should all agree that what you are proposing is reasonable, or at least possible.
Source System Experts
The best data profiling tools are generally not as complete or accurate as actually working with the people who maintain the source systems (although sometimes the exact opposite is true). If youre lucky, the person who actually built or originally installed the source system is still around. For any given dimensional model, there are usually several source system people you need to pull into the modeling process. There might be a DBA, a developer, and someone who works with the data input process. Each of these folks does things to the data that the other two dont know about. Even with the best database design and the greatest programs, the data entry group could decide to enter a middle initial of Z for every customer who was unpleasant to work with. There also might be different people you need to go to for different parts of the source system, even for different tables in some cases. Get to know these folks; develop good relationships with them. Help them understand how the DW/BI system will make their lives better. You will need their full cooperation.
Core Business Users
The core business users, often called power users, are the ones who have figured out how to get data out of the source system and turn it into information. They typically know how to build their own queries, sometimes by actually writing SQL. They are particularly valuable to the modeling process because they understand the source systems from a business point of view, and theyve created the business rules needed to convert the data from its form in the source system to something that can be used to support the decision-making process. Again, cultivate good relationships with these people. One or two of them should already be on the data modeling team. The rest should be brought in to work through the tight spots in defining individual dimensions or facts, and of course, participate in the dimensional model reviews.
Existing Reporting Systems
Existing reporting systems are often an excellent resource for information about the source systems and business rules needed to present information to the user community. Unfortunately, most of this information is buried somewhere in the codeeither in the reporting systems ETL process, if it has its own database, or in the report definitions themselves . Usually the best way to get this information out is to find the main developer of the reporting system and get him or her involved in the modeling process.
Building Dimensional Models
After a round of data exploration, the process of building dimensional models typically moves through three phases. The first is a high-level dimensional model design session that defines the boundaries of business process dimensional model. This first phase is labeled (1) in the process flow diagram in Figure 2.9. The second phase, labeled (2) in Figure 2.9, is detailed model development that involves filling in the attributes table by table and resolving any issues or uncertainties. The third phase is a series of model review, redesign, and validation steps labeled (3) in Figure 2.9.
High-Level Dimensional Model Design Session
The first dimensional modeling design session is meant to put several major stakes in the ground in terms of the basic structure and content of the dimensional model. This session is facilitated by the lead data modeler, and involves the core modeling team and any interested participants from the source system group and the ETL group. It can take a day or more to work through the initial model, so set expectations accordingly .
| |
It is extremely valuable to learn from the experience of those who went before you, but be very careful not to frighten or offend them. They may be threatened by the fact that they will no longer be needed. They might be angry or offended that you, not they, are building the DW/BI system. This is where your interper sonal skills will save you. Work to include them as part of the team early on. Keep them informed as the project moves forward. Involve them in the design of the database. Teach them how to use the reporting tools and include them in the development of new reports and applications from the DW/BI system. Let them (and their boss) know how much you appreciate their help.
| |
The session has two distinct parts and three intermediate deliverables, more properly thought of as early versions of the ultimate deliverables. The first part is creating the high-level dimensional modela graphical representation of the dimension, fact, and utility tables involved in representing the business process. As we describe in the next section, you should follow a four-step process for creating this high-level dimensional model. The second part of the session is creating the initial list of attributes for each dimension. The three checkpoints are: 1) the high-level graphical model; 2) the initial attribute list; and 3) the initial issues list. We describe the process of creating the high level dimensional model in this section and the two lists in the case study section.
Creating the High-Level Dimensional Model: The Four-Step Modeling Process
The initial task in the design session is to create a high-level dimensional model for the top priority business process. Creating the first draft is straightforward because the bus matrix from the detailed requirements document gives the team an excellent starting point (refer back to Figure 2.9). The high-level dimensional model is a data model at the entity level. You may also include any utility tables, such as lookup tables or user hierarchies, but usually these dont surface until later in the process. The process generally flows through four steps in this design session: choosing the business process, declaring the grain, choosing the dimensions, and identifying the facts.
-
Step 1: Choosing the business process. The first step in the four-step modeling process is to pick the subject area to be modeled . This is a business decision and it normally occurs after the high-level business requirements have been gathered and the analytic themes have been synthesized out. Recall from Chapter 1 that these themes are the central discussion points in a session with senior business management, the goal of which is to prioritize the themes and select the top-priority business process. If the analytic themes were well defined, selecting the initial business process is essentially picking a row on the bus matrix. This incremental approach allows you to carve off a piece that a) has significant value to the organization, b) can be built in a reasonable amount of timetypically about nine months for the initial business process, and c) lays the data foundation for the enterprise view by creating reusable, or conformed, dimensions.
-
By the time you get to this point, you should already know the initial business process to be modeled. If you dont, please return to Chapter 1 and work through the requirements gathering and prioritization process with your business folks. In the Adventure Works Cycles case study, the prioritization process clearly identified orders as the top-priority business process (see the prioritization chart in Figure 1.9 for a reminder).
-
Step 2: Declaring the grain. The second step in creating the high-level dimensional model is to decide on the level of detail, or the grain, needed for the selected business process. Choosing the grain is a combination of what is needed to meet the business requirements and what is possible based on the data collected by the source system. Weve seen cases where the business would like more detail than is available, and weve seen cases where the source system collects more detail than is relevant to understanding the business process. In general, our recommendation is to start out with the goal of building the dimensional model at the lowest level of detail availablethe atomic level. Its easy to roll up from the detail, but impossible to drill down from summary without underlying detail. This is one of the cornerstones of design flexibility in the dimensional model.
-
Part of declaring the grain is figuring out how to describe it. If youre pulling the lowest level of detail available, the grain can be thought of as one row in the fact table per source system transaction row. We usually describe this as one row per X where X is the business event, one row per customer call, one row per time sheet entry, one row per employee status change, and one row per order line item.
-
For Adventure Works Cycles, the grain of the orders business process clearly needs to be at the order line item level.
-
Step 3: Choosing the dimensions. The third step in the design session is a brainstorm discussion about the dimensions. Several major dimensions fall out naturally once youve determined the grain. The bus matrix usually provides a general idea of the major dimensions.
-
Scrutinize the dimensions to make sure they make sense (you will do this several times). Would certain dimensions be easier to work with or easier to understand if they were combined? How about if they were split apart? Look for hidden foreign key relationships, normalized hierarchies (one-to-many relationships). Ask hard questions about the assumptions behind each dimensionis it this way because it represents the true nature of the business process, or because it reflects the specific idiosyncrasies built into the transaction system? Revisit the bus matrix and test other dimensions to see if they fit. Any dimension that takes on a single value at the grain of the fact table is a candidate.
-
This step is where you begin to face the complexities of the real world. What you originally thought of as one dimension may really end up being two or three dimensions. Often an organization has strong preconceived notions about the data based on how its represented in the transaction system. These notions are etched in the corporate understanding because the source system, in all its transactional complexities, is the only window people have had on the data. In banking, for example, the account is a central organizing concept. In the source system, the account is actually a high-level entity that contains several other business objects, or dimensions. Once you know the account, you know the product, such as checking or savings. Once you know the account, you know the primary customer because the account carries its own primary customer name and address. In many banking systems, once you know the account, you also know the branch because the account number includes a branch indicator. Teasing out these hidden dimensions can be a challenge because they force people to re-think their understanding of the data and organization.
-
Choosing the dimensions may also cause you to realize your grain declaration was incorrect. You may have thought you were working at the atomic level of detail, when all of a sudden, the identification of a useful dimension that participates in the target business process forces the grain down to a lower level of detail. For example, a typical call detail record for a phone company usually includes the originating phone number and called phone number. However, the business users in a cellular phone company may want to include the cell tower IDs connected to the originating phone and the receiving phone. Because this could change many times during the phone call, what was one record now becomes several. Adding the tower IDs forces the grain down to a lower level of detail, and adds a lot more rows to the fact table.
-
Step 4: Identifying the facts. The fourth step in the modeling process is to identify the facts or measures generated by the business process. The facts usually tie directly to the grain declaration. For many transaction-oriented business processes there are only a few fundamental facts, such as quantity and sale amount, to measure business process performance. There are many combinations and calculations that can be derived from these fundamental facts, and which are used to monitor the business. These calculated measures are important but are not necessarily part of the atomic fact table itself. As we said when we defined these derived or computed facts at the beginning of this chapter, theyre usually best handled in Analysis Services or in the relational views. At this early point in the design, youre working to identify the fundamental facts. However, keep track of all the computed facts you come up withyoull need them soon.
The High-Level Graphical Model
Graphically summarize the initial design session in a deliverable called the high-level graphical model (or the bubble chart , for short). The model shown in Figure 2.12 is an example of a starting point dimensional model for Adventure Works Cycles orders business process based on the bus matrix from Chapter 1. We improve on this model in the next section.
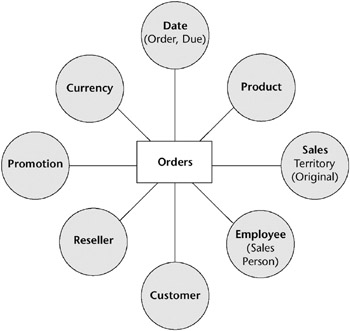
Figure 2.12: Initial Adventure Works Cycles High-Level Orders dimensional model
Once this high-level dimensional model is completed, the hard work of filling in the dimension attributes and hierarchies, identifying and validating data sources, and defining names begins. At this point, the process gets specific to each individual organization. The rest of this chapter explores the process of identifying dimension attributes and facts, and validating the model in the context of the Adventure Works Cycles business.
Identifying Dimension and Fact Attributes
The second part of the initial design session involves filling in each table with a robust attribute list . The attribute list is a list of all the relevant attributes needed by the business, grouped according to the dimension or fact table to which they belong. If youre working with the dimensional modeling spreadsheet shown in Figure 2.10, create one worksheet per table in the model, and fill in its attribute list. The initial list for dimension and fact table attributes is identified as checkpoint (B) in phase (1) of Figure 2.9. We use the modeling spreadsheet shown in Figure 2.10 to keep track of our attribute lists.
The team will identify a large number of attributes coming from a wide range of sources. List them out brainstorm-style, grouping them by the dimension or fact table to which they belong. Dont get caught up in naming or derivation yet; just pick a name and make a note of the alternatives names and the controversy on the issues list.
Speaking of the issues list, the last checkpoint from the high-level modeling session is the dimensional model issues list . This document comes to life in the high-level model design session, but its constantly updated throughout the detailed modeling process. Its the best way weve found to remember all the little details about the problems we encountered and how we decided to resolve them. Youll see an example issues list in Figure 2.15 as part of the Adventure Works Cycles case study.
| Chng Flag | Issue # | Task / Topic | Issue | ID Date | Rptd By | Resp | Date Closed | Status | Priority |
|---|---|---|---|---|---|---|---|---|---|
| 27 | Employee | Research availability of historical data. | 3/8/06 | Team | JM | - | Open | High | |
| 28 | Sales Territory | Research relationships and history among Sales Territory, Sales Rep, and Customer tables in the source system. | 3/8/06 | Team | JM | - | Open | High | |
| 29 | Customer | Assess projected impact of combined Internet and Reseller on data size and growth of Customer table. | 3/8/06 | Team | WT | - | Open | High | |
| 30 | Customer | Verify understanding of and support for combined Customer table with core users. | 3/8/06 | Team | WT | - | Open | High | |
| 31 | Promotions | Discuss special offer / promotions with marketing to understand how these might change. | 3/8/06 | Team | DK | - | Open | Med | |
| 32 | Order_Info | Verify concept of Channel with Marketing and Sales. | 3/8/06 | Team | DK | - | Open | High | |
| 33 | Order_Info | Verify usability of combined Channel and Sales Reason fields in the same table. | 3/8/06 | Team | DK | - | Open | High | |
| 34 | Order_Info | Determine list of possible combinations between Channel and Sales Reason. | 3/8/06 | Team | DK | - | Open | High | |
Figure 2.15: Adventure Works Cycles Orders dimensional model issues list
Assign someone the role of list keeper in every meeting. This person notes every data- related issue that comes up during the meeting and marks off previous issues that have been resolved. It helps to save time at the end of each meeting to review and validate the new entries and their assignments. The data modeler can be the keeper of the issues list, but weve often seen it fall into the hands of the project manager. This is in large part because keeping the list updated and encouraging progress on resolving issues are usually strengths of a good project manager.
The results of this initial design session, the high-level dimensional model, the attributes list, and the issues list, are the foundation for the logical and physical business process dimensional models. At this point, youve identified the dimension and fact tables, each with a list of its associated attributes or measures. This model, along with the issues list, gives the data modeling team enough guidelines to carry the process into the next level of detail.
We will work through the steps in creating these lists in the context of the Adventure Works Cycles case study in the next section. This brings us to phase (2) in the dimensional modeling process shown back in Figure 2.9.
Developing the Detailed Dimensional Model
Detailed dimensional model development is primarily about filling in all the missing information in the dimensional model and testing it against the business requirements. Shown as phase (2) in Figure 2.9, this is where the team works through the issues list, resolving as many as possible, and identifying alternative solutions for the remaining issues. The goal is to identify all the interesting and useful attributes and determine the locations, definitions, and business rules that specify how these attributes are populated . This process is ultimately about defining the contents of the DW/BI system , table by table and column by column. Because the DW/BI system is an enterprise resource, these definitions must work for the entire enterprise. The data definition task is a business taskthe BI team usually drives the process, but the business folks must determine and approve the standard names and definitions. This is another one of those organizational processes that can be difficult for the technically minded.
The team should meet on a regular basis, perhaps daily or every other day, to discuss the proposed alternatives and make decisions on open issues. Use these meetings to critically explore the progress, review any recommendations, and update the issues list. Focus these meetings on one or two tables at a timetoo many and the meeting starts to get bogged down.
If there are enough competent dimensional modelers, the modeling team should divide and conquer. The model can be split out by table, with its associated attribute list and issues list.
If you arent already using it, try the modeling spreadsheet mentioned in the Preparation section of this chapter and shown in Figure 2.10. It provides a place to capture most of the important descriptive information about each table and attribute. It allows the modeler to quickly move or copy attributes around the model as needed. It is a spreadsheet, after all.
This is the point where the data steward needs to drive consensus on table and attribute naming, descriptions and definitions. This will take some time, but it is an investment that will provide huge returns in terms of users ability to understand and willingness to accept the dimensional model.
The model will go through some major shifts during this phase. Youll identify additional attributes, along with new dimensions and facts. If this is the primary focus of the dimensional modeling team, the model should begin to settle down with a week or two of intensive work.
| Reference | See the following resources for additional information about developing the detailed model:
|
Testing the Model
Once the model is fairly stable, step back and test it against the business requirements. The requirements are an integral part of the model development process, but a separate test step helps you think at a more practical level. Approach the test by asking the question How would I actually get this information out of the model?
The requirements document should have a bundle of test materials, including a candidate list of structured reports, example user reports, and ad hoc or future-oriented questions people would like to investigate. Pull these out and go through them one by one. For each request, decide how it could be answered (we often think up the SQL it would take) and assign it an effort score: low, medium, or high. A low effort query would be a simple SQL SELECT statementno sub-selects or case statements or unionsthat would be easy to construct in any desktop query tool. At the end of the test, most of the questions should fall into the low effort categoryshoot for 75 percent.
Invariably, this testing process leads to several refinements in the model. You may identify missing attributes or hierarchies. Occasionally, youll make major structural changes to the model based on a deeper understanding than you had before you created the detailed model.
Reviewing and Validating the Model
Once youre confident in the models stability, the process moves into the review and validation phase, labeled (3) in Figure 2.9. This phase involves reviewing the model with successive audiences, each with different levels of technical expertise and business understanding. Get feedback from interested people across the organization. At a minimum, plan on talking to three groups. In the IT organization, the source system developers and DBAs can often spot errors in the model very quickly. (You may need to teach these folks about dimensional modeling before they start normalizing your dimensions.) Get feedback from any core business users who were not directly involved in the model development process. After each meeting, incorporate the feedback into the dimensional model.
Finally, review the model with the broader user community. Do this more in the form of a presentation and tie the model back to the business requirements. A series of statements that show how a user might get answers to a range of questions pulled right from the requirements document can be very powerful.
The modeling team will get valuable feedback from the review and validation process. The DW/BI team also gets value from these reviews in the form of a more informed and engaged user community. This feedback should be incorporated into the final model, labeled (4) in Figure 2.9.
| | ||
| | ||
| | ||
EAN: N/A
Pages: 125
- Step 1.1 Install OpenSSH to Replace the Remote Access Protocols with Encrypted Versions
- Step 3.1 Use PuTTY as a Graphical Replacement for telnet and rlogin
- Step 4.4 How to Generate a Key Using PuTTY
- Step 5.2 Troubleshooting Common OpenSSH Errors/Problems
- Step 6.2 Using Port Forwarding Within PuTTY to Read Your E-mail Securely
- Chapter V Consumer Complaint Behavior in the Online Environment
- Chapter VI Web Site Quality and Usability in E-Commerce
- Chapter X Converting Browsers to Buyers: Key Considerations in Designing Business-to-Consumer Web Sites
- Chapter XI User Satisfaction with Web Portals: An Empirical Study
- Chapter XIV Product Catalog and Shopping Cart Effective Design