Canonical Correlation
|
| < Day Day Up > |
|
Canonical correlation analysis is a variation on the concept of multiple regression and correlation analysis. In multiple regression and correlation analysis, you examine the relationship between a single Y variable and a linear combination of a set of X variables. In canonical correlation analysis, you examine the relationship between a linear combination of the set of Y variables and a linear combination of the set of X variables.
For example, suppose that you want to determine the degree of correspondence between a set of job characteristics and measures of employee satisfaction. The sample data set Jobs contains the task characteristics and satisfaction profiles for 14 jobs. The three variables associated with job satisfaction are career track satisfaction (Career), management and supervisor satisfaction (Supervis), and financial satisfaction (Finance). The three variables associated with job characteristics are task variety (Variety), supervisor feedback (Feedback), and autonomy (Autonomy).
In this task, the canonical correlation analysis is performed, labels are specified to identify each set of canonical variables, and a plot of the canonical variables is requested.
Open the Jobs Data Set
The data are provided in the Analyst Sample Library. To access this Analyst sample data set, follow these steps:
-
Select Tools → Sample Data...
-
Select Jobs.
-
Click OK to create the sample data set in your Sasuser directory.
-
Select File → Open By SAS Name...
-
Select Sasuser from the list of Libraries.
-
Select Jobs from the list of members.
-
Click OK to bring the Jobs data set into the data table.
Request the Canonical Correlation Analysis
To perform a canonical correlation analysis, follow these steps:
-
Select Statistics→Multivariate → Canonical Correlation...
-
Select the job satisfaction variables (Career, Supervis, and Finance) as the variables in Set 1.
-
Select the job characteristic variables (Variety, Feedback, and Autonomy) as the variables in Set 2.
Figure 13.9 displays the Canonical Correlation dialog, with each of the two sets of variables defined.
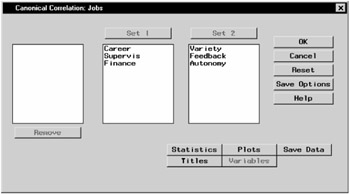
Figure 13.9: Canonical Correlation Dialog
The default analysis includes the canonical correlations, eigenvalues, likelihood ratios, and tests of significance.
Specify Identifying Labels
You can optionally specify labels and prefixes to identify the two groups of calculated canonical variables. To specify labels and prefixes, follow these steps:
-
Click on the Statistics button in the main dialog.
-
Enter a label for each of the two sets of canonical variables.
-
Enter a prefix for each set of canonical variables. The prefix is used to assign names to the canonical variables.
-
Click OK.
Figure 13.10 displays the Canonical Analysis tab with labels and prefixes specified.
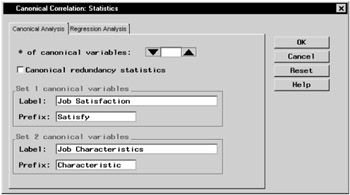
Figure 13.10: Canonical Correlation- Statistics Dialog, Canonical Analysis Tab
Request Canonical Variate Plots
To request plots of the canonical variables, follow these steps:
-
Click on the Plots button in the main dialog.
-
Select Create canonical variable plots.
You can also enter the Canonical variables for which you want plots. For example, to request plots of the first, second, and third canonical variable pairs, you would type the values 1 and 3.
-
Click OK.
Figure 13.11 displays the Plots dialog, in which plots of the first two canonical variables are requested.
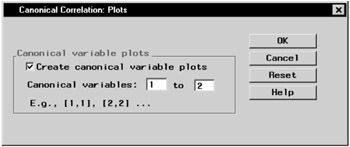
Figure 13.11: Canonical Correlation- Plots Dialog
Click OK in the Canonical Correlation dialog to perform the analysis.
Review the Results
Figure 13.12 displays the canonical correlation, adjusted canonical correlation, approximate standard error, and squared canonical correlation for each pair of canonical variables.
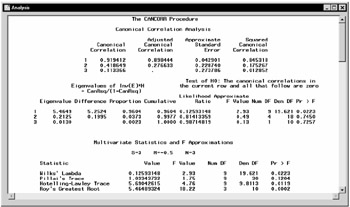
Figure 13.12: Canonical Correlation- Correlations and Eigenvalues
The first canonical correlation (the correlation between the first pair of canonical variables) is 0.9194. This value represents the highest possible correlation between any linear combination of the job satisfaction variables and any linear combination of the job characteristics variables.
Figure 13.12 also displays the likelihood ratios and associated statistics for testing the hypothesis that the canonical correlations in the current row and all that follow are zero. The first approximate F value of 2.93 corresponds to the test that all three canonical correlations are zero. Since the p-value is small (0.0223), you can reject the null hypothesis at the α = 0.05 level. The second approximate F value of 0.49 corresponds to the test that both the second and the third canonical correlations are zero. Since the p-value is large (0.7450), you fail to reject the hypothesis and conclude that only the first canonical correlation is significant at the α = 0.05 level.
Several multivariate statistics and F test approximations are also provided. These statistics test the null hypothesis that all canonical correlations are zero. The small p-values for these tests (< 0.05), except for Pillai's Trace, suggest rejecting the null hypothesis that all canonical correlations are zero.
Even though canonical variables are artificial, they can often be identified in terms of the original variables. To identify the variables, inspect the standardized coefficients of the canonical variables and the correlations between the canonical variables and their original variables. Based on the results displayed in Figure 13.12, only the first canonical correlation is significant. Thus, only the first pair of canonical variables (Satisfy1 and Characteristic1) need to be identified.
The standardized canonical coefficients in Figure 13.13 show that the first canonical variable for the Job Satisfaction group is a weighted sum of the variables Supervis (0.7854) and Career (0.3028), with the emphasis on Supervis. The coefficient for the variable Finance is near 0. Therefore, a person satisfied with his or her supervisor and with a large degree of career satisfaction would score high on the canonical variable Satisfaction1.
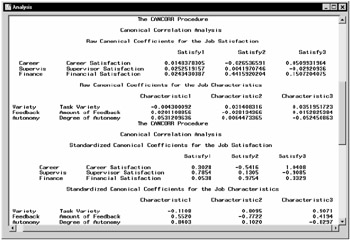
Figure 13.13: Canonical Correlation- Correlation Coefficients
The coefficients for the Job Characteristics variables show that degree of autonomy (Autonomy) and amount of feedback (Feedback) contribute heavily to the Characteristic1 canonical variable (0.8403 and 0.5520, respectively).
Figure 13.14 displays the table of correlations between the canonical variables and the original variables. Although these univariate correlations must be interpreted with caution, since they do not indicate how the original variables contribute jointly to the canonical analysis, they are often useful in the identification of the canonical variables.
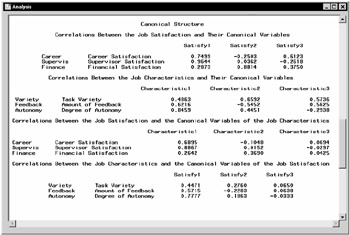
Figure 13.14: Canonical Correlation- Canonical Structure
As displayed in Figure 13.14, the supervisor satisfaction variable, Supervis, is strongly associated with the Satisfy1 canonical variable (r = 0.9644).
Slightly less influential is the variable Career, which has a correlation with the canonical variable of 0.7499. Thus, the canonical variable Satisfy1 seems to represent satisfaction with supervisor and career track.
The correlations for the job characteristics variables show that the canonical variable Characteristic1 seems to represent all three measured variables, with the degree of autonomy variable (Autonomy) being the most influential (0.8459).
Hence, you can interpret these results to mean that job characteristics and job satisfaction are related. Jobs that possess a high degree of autonomy and level of feedback are associated with workers who are more satisfied with their supervisors and their careers. Additionally, the analysis suggests that, although the financial component is a factor in job satisfaction, it is not as important as the other satisfaction-related variables.
The plot of the first canonical variables, Satisfy1 and Characteristic1, is displayed in Figure 13.15. The plot depicts the strength of the relationship between the set of job satisfaction variables and the set of job characteristic variables.
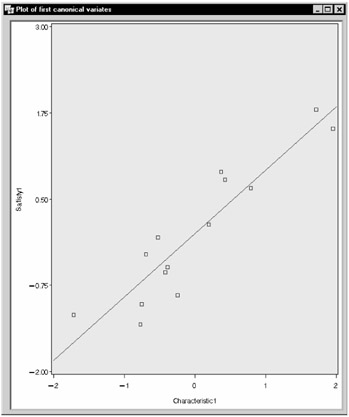
Figure 13.15: Canonical Correlation- Plot of the First Canonical Variables
|
| < Day Day Up > |
|
EAN: 2147483647
Pages: 116
- ERP Systems Impact on Organizations
- The Second Wave ERP Market: An Australian Viewpoint
- Enterprise Application Integration: New Solutions for a Solved Problem or a Challenging Research Field?
- Context Management of ERP Processes in Virtual Communities
- Intrinsic and Contextual Data Quality: The Effect of Media and Personal Involvement