7.3 Digitizing Component Video
| | ||
| | ||
| | ||
7.3 Digitizing Component Video
It is not necessary to digitize analog sync pulses in component systems, since the only useful video data is that sampled during the active line. As the sampling rate is derived from sync, it is only necessary to standardize the size and position of a digital active line and all other parts of the video waveform can be recreated at a later time. The position is specified as a given number of sampling clock periods from the leading edge of sync, and the length is simply a standard number of samples. The digital active line is somewhat longer than the analog active line to allow for some drift in the line position of the analog input and to place edge effects in digital filters outside the screen area. Some of the first and last samples of the digital active line will represent blanking level, thereby avoiding abrupt signal transitions caused by a change from blanking level to active signal. When converting analog signals to digital it is important that the analog unblanked picture should be correctly positioned within the line. In this way the analog line will be symmetrically disposed within the digital active line. If this is the case, when converting the data back to the analog domain, no additional blanking will be necessary, as the blanking at the ends of the original analog line will be recreated from the data. The DAC can pass the whole of the digital active line for conversion and the result will be a correctly timed analog line with blanking edges in the right position.
However, if the original analog timing was incorrect, the unblanked analog line may be too long or off- centre in the digital active line. In this case a DAC may apply digital blanking to the line data prior to conversion. Some equipment gives the user the choice of using blanking in the data or locally applied blanking prior to conversion.
In addition to specifying the location of the samples, it is also necessary to standardize the relationship between the absolute analog voltage of the waveform and the digital code value used to express it so that all machines will interpret the numerical data in the same way. These relationships are in the voltage domain and are independent of the scanning standard used. Thus the same relationships will be found in both SD and HD component formats. As a digital interface is just an alternative way of sending a television picture, the information it contains about that picture will be the same. Thus digital interfaces assume the same standards for gamma and colour primaries as the original analog system.
Figure 7.2 shows how the luminance signal fits into the quantizing range of a digital system. Numbering for 10-bit systems is shown with figures for eight bits in brackets. Black is at a level of 64 10 (16 10 ) and peak white is at 940 10 (235 10 ) so that there is some tolerance of imperfect analog signals and overshoots caused by filter ringing. The sync pulse will clearly go outside the quantizing range, but this is of no consequence as conventional syncs are not transmitted. The visible voltage range fills the quantizing range and this gives the best possible resolution.
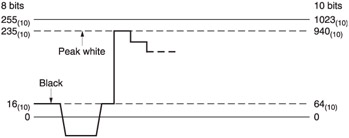
Figure 7.2: The standard luminance signal fits into eight- or ten-bit quantizing structures as shown here.
The colour difference signals use offset binary, where 512 10 (128 10 ) is the equivalent of blanking voltage. The peak analog limits are reached at 64 10 (16 10 ) and 960 10 (240 10 ) respectively, allowing once more some latitude for maladjusted analog inputs and filter ringing.
Note that the code values corresponding to all ones or all zeros (i.e. the two extreme ends of the quantizing range) are not allowed to occur in the active line as they are reserved for synchronizing. ADCs must be followed by circuitry that detects these values and forces the code to the nearest legal value if out-of-range analog inputs are applied. Processing circuits that can generate these values must employ digital clamp circuits to remove the values from the signal. Fortunately this is a trivial operation.
The peak-to-peak amplitude of Y is 880 (220) quantizing intervals, whereas for the colour difference signals it is 900 (225) intervals. There is thus a small gain difference between the signals. This will be cancelled out by the opposing gain difference at any future DAC, but must be borne in mind when digitally converting to other standards.
The sampling rate used in SD was easily obtained as only two scanning standards had to be accommodated. It will be seen that in HD there are further constraints. In principle, the sampling rate of a system need only satisfy the requirements of sampling theory and filter design. Any rate that does so can be used to convey a video signal from one place to another. In practice, however, there are a number of factors that limit the choice of sampling rate considerably.
It should be borne in mind that a video signal represents a series of two-dimensional images. If a video signal is sampled at an arbitrary frequency, samples in successive lines and pictures could be in different places. If, however, the video signal is sampled at a rate which is a multiple of line rate the result will be that samples on successive lines will be in the same place and the picture will be converted to a neat array having vertical columns of samples that are in the same place in all pictures. This allows for the spatial and temporal processing needed in, for example, standards convertors and MPEG coders. A line-locked sampling rate can conveniently be obtained by multiplication of the H-sync frequency in a phase-locked loop. The position of samples along the line is then determined by the leading edge of sync.
Considering SD sampling rates first, whilst the bandwidth required by 525/59.94 is less than that required by 625/50, and a lower sampling rate might have been used, practicality suggested a common sampling rate. The benefit of a standard H-locked sampling rate for component video is that the design of standards convertors is simplified and DVTRs have a constant data rate independent of standard. This was the goal of CCIR (now ITU) Recommendation 601 1 , which combined the 625/50 input of EBU Doc. Tech. 3246 and 3247 with the 525/59.94 input of SMPTE RP 125.
CCIR 601 recommends the use of certain sampling rates which are based on integer multiples of the carefully chosen fundamental frequency of 3.375 MHz. This frequency is normalized to 1 in the document.
In order to sample 625/50 luminance signals without quality loss, the lowest multiple possible is 4 which represents a sampling rate of 13.5 MHz. This frequency line-locks to give 858 sample periods per line in 525/59.94 and 864 sample periods per line in 625/50. The spectra of such sampled luminance are shown in Figure 7.3.
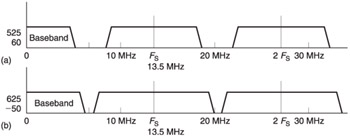
Figure 7.3: Spectra of video sampled at 13.5 MHz. In (a) the baseband 525/60 signal at left becomes the sidebands of the sampling rate and its harmonics. In (b) the same process for the 625/50 signal results in a smaller gap between baseband and sideband because of the wider bandwidth of the 625 system. The same sampling rate for both standards results in a great deal of commonality between 50 Hz and 60 Hz equipment.
In the component analog domain, the colour difference signals typically have one-half the bandwidth of the luminance signal. Thus a sampling rate multiple of 2 is used and results in 6.75 MHz. This sampling rate allows respectively 429 and 432 sample periods per line.
Component video sampled in this way has a 4:2:2 format. Whilst other combinations are possible, 4:2:2 is the format for which the majority of production equipment is constructed and is the only SD component format for which parallel and serial interface standards exist. Figure 7.4 shows the spatial arrangement given by 4:2:2 sampling. Luminance samples appear at half the spacing of colour difference samples, and every other luminance sample is co-sited with a pair of colour difference samples. Co-siting is important because it allows all attributes of one picture point to be conveyed with a three-sample vector quantity. Modification of the three samples allows such techniques as colour correction to be performed. This would be difficult without co-sited information. Co-siting is achieved by clocking the three ADCs simultaneously . In some equipment one ADC is multiplexed between the two colour difference signals. In order to obtain co-sited data it will then be necessary to have an analog delay in one of the signals.
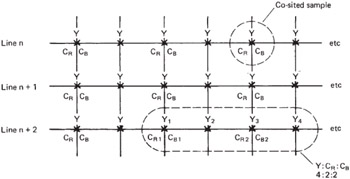
Figure 7.4: In CCIR-601 sampling mode 4:2:2, the line synchronous sampling rate of 13.5 MHz results in samples having the same position in successive lines, so that vertical columns are generated. The sampling rates of the colour difference signals C R , C B are one-half of that of luminance, i.e. 6.75 MHz, so that there are alternate only samples and co-sited samples which describe , C R and C B . In a run of four samples, there will be four samples, two C R samples and two C B samples, hence 4:2:2.
For full bandwidth RGB working, 4:4:4 can be used with a possible 4:4:4:4 used if including a key signal. For lower bandwidths, multiples of 1 and 3 can also be used for colour difference and luminance respectively. 4:1:1 delivers colour bandwidth in excess of that required by the composite formats. 4:1:1 is used in the 525 line version of the DVC quarter-inch digital video format. 3:1:1 meets 525 line bandwidth requirements. The factors of 3 and 1 do not, however, offer a columnar structure and are inappropriate for quality post-production.
In 4:2:2 the colour difference signals are sampled horizontally at half the luminance sampling rate, yet the vertical colour difference sampling rates are the same as for luminance. Where bandwidth is important, it is possible to halve the vertical sampling rate of the colour difference signals as well. Figure 7.5 shows that in 4:2:0 sampling, the colour difference samples only exist on alternate lines so that the same vertical and horizontal resolution is obtained. 4:2:0 is used in the 625 line version of the DVC format and in the MPEG 'Main Level Main Profile' format for multimedia communications and, in particular, DVB.
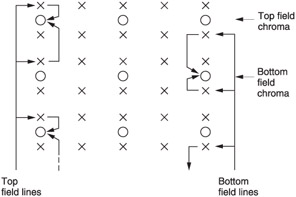
Figure 7.5: In 420 coding the colour difference pixels are downsampled vertically as well as horizontally. Note that the sample sites need to be vertically interpolated so that when two interlaced fields are combined the spacing is even.
Figure 7.6 shows that in 4:2:2 there is one luminance signal sampled at 13.5MHz and two colour difference signals sampled at 6.75MHz. Three separate signals with different clock rates are inconvenient and so multiplexing can be used. If the colour difference signals are multiplexed into one channel, then two 13.5MHz channels will be required. Such an approach is commonly found within digital component processing equipment where the colour difference processing can take place in a single multiplexed channel.
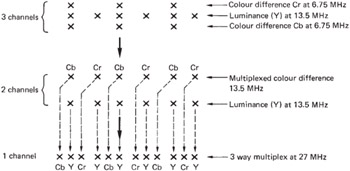
Figure 7.6: The colour difference sampling rate is one-half that of luminance, but there are two colour difference signals, C r and C b , hence the colour difference data rate is equal to the luminance data rate, and a 27 MHz interleaved format is possible in a single channel.
If the colour difference and luminance channels are multiplexed into one, a 27 MHz clock will be required. The word order is standardized to be:
C b , Y, C r , Y , etc.
In order unambiguously to demultiplex the samples, the first sample in the line is defined as C b and a unique sync pattern is required to identify the beginning of the multiplex sequence. HD adopts the same principle but the frequencies are higher.
There are two ways of handling 16:9 aspect ratio video in SD. In the anamorphic approach both the camera and display scan wider but there is no change to the sampling rates employed and therefore the same 27MHz data stream can be employed unchanged. Compared with 4:3, the horizontal spacing of the pixels in 16:9 must be greater as the same number are stretched across a wider picture. This results in a reduction of horizontal resolution, but standard 4:3 production equipment can be used subject to some modifications to the shape of pattern wipes in vision mixers. When viewed on a 4:3 monitor anamorphic signals appear squeezed horizontally.
In the second approach, the pixel spacing is kept the same as in 4:3 and the number of samples per active line must then be increased by 16:12. This requires the data rate to rise to 36 MHz. Thus the luminance sampling rate becomes 18 MHz and the colour difference sampling rate becomes 9MHz. Strictly speaking the format no longer adheres to CCIR-601 because the sampling rates are no longer integer multiples of 3.375 MHz. If, however, 18 MHz is considered to be covered by Rec. 601, then it must be described as 5.333 : 2.666 : 2.666 .
If the sampling rate is chosen to be a common multiple of the US and European line rates, the spacing between the pixels that results will have to be accepted. In computer graphics, pixels are always square, which means the horizontal and vertical spacing is the same. In 601 sampling, the pixels are not square and their aspect ratio differs between the US and European standards. This is because the horizontal sampling rate is the same but the number of lines in the picture is different.
When CCIR 601 was being formulated, the computer and television industries were still substantially separate and the lack of square pixels was not seen as an issue. In 1990 CCIR 709 recommended that HD formats should be based on 1920 pixels per active line, and use sampling rates based on 2.25 MHz (6.75/3): an unnecessarily inflexible approach again making it unlikely that square pixels would result at all frame rates.
Subsequently, the convergence of computer, film and television technology has led to square pixels being adopted in HD formats at all frame rates, a common sampling rate having been abandoned . Another subtle change is in the way of counting lines. In traditional analog video formats, the number of lines was the total number, including blanking, whereas in computers the number of lines has always been the number visible on the screen, i.e. the height of the pixel array. HD standards adopted the same approach. Thus in the 625 line standard, there will be 625 line periods per frame. Whereas in the 1080 line HD standard there are actually 1125 line periods per frame.
It is slowly being understood that improved picture quality comes not from putting more pixels into the image but from eliminating interlace and increasing the frame rate 2 . Thus 1280 — 720 progressively scanned frames are described in SMPTE 296M 3 . Unfortunately there are still those who believe that data describing digital television images somehow differs from computer data. The bizarre adherence to the obsolete principle of interlacing seems increasingly to be based on maintaining an artificial difference between computers and television for marketing purposes rather than on any physics or psycho -optics. The failure of the ATSC and FCC to understand these principles has led to a damaging proliferation of HD television standards, in which the simple and effective approach of digital standard definition has been lost.
| | ||
| | ||
| | ||
EAN: 2147483647
Pages: 120