The DataGrid Control
 | |||||||||||
| Chapter 10 - Viewing .NET Data | |
| bySimon Robinsonet al. | |
| Wrox Press 2002 | |
The DataGrid is a completely new control, written specifically for .NET, and it permits various views of data to be displayed. In its simplest guise, you can display data (as in a DataSet ) by calling the SetDataBinding() method. More complex capabilities are also built into the control, which we'll come to throughout the course of this chapter.
Displaying Tabular Data
The last chapter showed numerous ways of selecting data and getting it into a data table, although the data was displayed in a very basic fashion; we simply used Console.WriteLine() .
The first example here will show how to retrieve some data and display it in a DataGrid control. The following is a screenshot from the application we're about to build. The sourcecode for this application is available in the \01_DisplayTabularData directory:
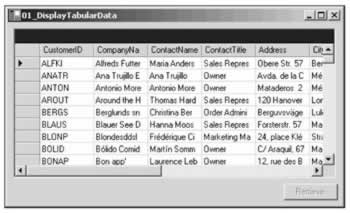
The application (simple as it is), selects every record from the customer table within the Northwind database, and displays these records to the user in the DataGrid . The code is fairly short and we will step through it in its entirety here:
using System; using System.Windows.Forms; using System.Data; using System.Data.SqlClient; public class DisplayTabularData : System.Windows.Forms.Form { private System.Windows.Forms.Button retrieveButton; private System.Windows.Forms.DataGrid dataGrid; public DisplayTabularData() { this.AutoScaleBaseSize = new System.Drawing.Size(5, 13); this.ClientSize = new System.Drawing.Size(464, 253); this.Text = "01_DisplayTabularData";
Next we create the grid control, and set up its properties. The second line: dataGrid.BeginInit(); disables firing of events on the grid, which is useful when making many modifications to the control. If events are not inhibited, each change to the grid could force a redraw on screen. We then set the location and size of the control, define the tab index, and anchor the control to both the top left and bottom right corners of the window, so that its proportions will track those of the main application window.
this.dataGrid = new System.Windows.Forms.DataGrid(); dataGrid.BeginInit(); dataGrid.Location = new System.Drawing.Point(8, 8); dataGrid.Size = new System.Drawing.Size(448, 208); dataGrid.TabIndex = 0; dataGrid.Anchor = AnchorStyles.Bottom AnchorStyles.Top AnchorStyles.Left AnchorStyles.Right; this.Controls.Add(this.dataGrid); dataGrid.EndInit();
Now we create the button. The same basic steps are followed in initializing the button:
this.retrieveButton = new System.Windows.Forms.Button(); retrieveButton.Location = new System.Drawing.Point(384, 224); retrieveButton.Size = new System.Drawing.Size(75, 23); retrieveButton.TabIndex = 1; retrieveButton.Anchor = AnchorStyles.Bottom AnchorStyles.Right; retrieveButton.Text = "Retrieve"; retrieveButton.Click += new System.EventHandler (this.retrieveButton_Click); this.Controls.Add(this.retrieveButton); }
We also have a Click event, which calls the retrieveButton_Click event handler:
protected void retrieveButton_Click(object sender, System.EventArgs e) { retrieveButton.Enabled = false; string source = "server=(local)\NetSDK;" + "uid=QSUser;pwd=QSPassword;" + "database=Northwind";
After selecting the data from the Customers table and filling the data set, I call SetDataBinding to bind the data set to the grid. To this method I pass the data set and the name of the table within the DataSet that I wish to display. A grid can only display the data from one DataTable at a time, even if the DataSet contains multiple tables. Further on in the chapter, I will show an example of displaying data from a DataSet with multiple DataTable s. Of course, the data within the DataSet could naturally come from many actual database tables (or a view over many tables):
string select = "SELECT * FROM Customers" ; SqlConnection conn = new SqlConnection(source); SqlDataAdapter da = new SqlDataAdapter( select , conn); DataSet ds = new DataSet(); da.Fill(ds , "Customers"); dataGrid.SetDataBinding(ds , "Customers"); } static void Main() { Application.Run(new DisplayTabularData()); } }
To compile this example, type the following at a command prompt:
csc /t:winexe /debug+ /r:System.dll /r:System.Data.dll /r:system.windows.forms.dll /recurse:*.cs
The /recurse:*.cs parameter will compile all .cs files in your current directory and all subdirectories - I use it as shorthand, so I don't have to remember all the files in the application, but you do have to ensure that you've only got the expected files in the directory.
Data Sources
The DataGrid is a very flexible way to display data; in addition to calling SetDataBinding() with a DataSet and the name of the table to display, this method can be called with any of the following data sources:
-
An array - The grid can bind to any one dimensional array
-
DataTable
-
DataView
-
DataSet or DataViewManager
-
Components that implement the IListSource interface
-
Components that implement the IList interface
The following sections will give an example of each of these data sources.
Displaying Data from a Array
At first glance this seems to be easy. Create an array, fill it with some data, and call SetDataBinding (array, null) on the DataGrid . Here's some example code:
string[] stuff = new string[] {"One", "Two", "Three"}; dataGrid.SetDataBinding(stuff, null);
As you may have noticed, SetDataBinding accepts two parameters. The first is the data source, which is the array in this instance. The second parameter should be null unless the data source is a DataSet or DataViewManager , in which case it should be the name of the table that you wish to display.
You could replace the code in the previous example's retrieveButton_Click event handler with the array code above. The problem with this code is the resulting display:
As you can see, rather than displaying the strings defined within the array, the grid is actually displaying the length of those strings. The reason for this is that when using an array as the source of data for a DataGrid , the grid looks for the first public property of the object within the array, and displays this value rather than the string you were expecting. The first (and only) public property of a string is its length, so that is what is displayed.

One way to rectify this is to create a wrapper class for strings, such as that shown below:
protected class Item { public Item(string text) { m_text = text; } public string Text { get{return m_text;} } private string m_text; }
When adding an array of this Item class (which could as well be a struct for all the processing that it does), you will receive the expected output. The sourcecode for this example is available in the 02_DataSourceArray directory:

DataTable
There are two main ways to display a DataTable within a DataGrid :
-
If your DataTable is standalone, call SetDataBinding(DataTable, null)
-
If your DataTable is contained within a DataSet , call SetDataBinding(DataSet, " < Table Name > ")
The example screenshot, taken from the code available in \03_DatasourceDataTable , shows some of the columns :
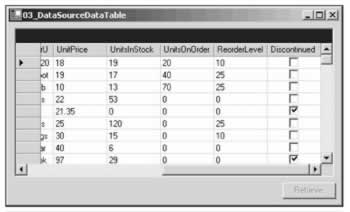
Note the display of the last column; it shows a checkbox instead of the more common edit control. The DataGrid , in the absence of any other information, will read the schema from the data source (which in this case is the Products table), and infer from the column types what control is to be displayed.
The data in the database does not change when you alter fields in the data grid, as the data is only stored locally on your computer - there is no active connection to the database. We'll come on to updating the original data source later, in the Updating the Data Source section.
Don't get too excited, though - the only two types that are currently supported are textboxes and checkboxes - any other sort of mapping has to be done manually.
Displaying Data from a DataView
A DataView provides a means to filter and sort data within a DataTable . When you have selected data from the database, it is common to permit the user to sort that data, such as by clicking on column headings. In addition, you may want to filter the data to show only certain rows, such as all those that have been changed by the user. A DataView allows you to limit the rows shown to the user; however, it does not limit the columns from the DataTable .
| Important | A DataView does not allow you to change which columns are displayed, just which rows. |
An example of how to limit the columns shown is provided later in the chapter, in the DataGridTableStyle and DataGridColumnStyle section.
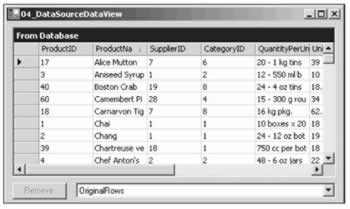
The code to create a DataView based on an existing DataTable is shown below. The example code for this section is available in the \04_DataSourceDataView directory.
DataView dv = new DataView(dataTable); Once created, you can then alter settings on the DataView , which affect the data and operations permitted on that data when the view is displayed within the data grid. Some examples are:
-
Setting AllowEdit = false disables all column edit functionality for rows
-
Setting AllowNew = false will disable the new row functionality
-
Setting AllowDelete = false will disable the delete row capability
-
Setting the RowStateFilter to display only rows of a given state
-
Setting the RowFilter to filter rows
-
Sorting the rows by certain columns
We'll see examples of using the RowStateFilter in the next section - the other options are fairly self-explanatory.
Filtering Rows by Data
Once you have created a DataView , you can alter the data displayed by that view by setting the RowFilter property. This property, typed as a string, is used as a means of filtering based on certain criteria - the value of the string is used as the filter criteria. Its syntax is similar to a WHERE clause in regular SQL, but it is issued against data already selected from the database.
Some examples of filter clauses are shown in the following table:
| Clause | Description |
|---|---|
| UnitsInStock > 50 | Show only those rows where the UnitsInStock column is greater than 50. |
| Client = 'Smith' | Return only those records for a given client. |
| County LIKE 'C*' | Return all records where the County field begins with a C - so for example this would return rows for Cornwall, Cumbria, Cheshire, and Cambridgeshire. You can use " % " as a single character wildcard, whereas the " * " denotes a general wildcard that will match zero or more characters . |
The runtime will do its best to coerce the data types used within the filter expression into the appropriate types for the source columns. As an example, it is perfectly legal to write "UnitsInStock > '50'" in the earlier example, even though the column is an integer. If you do, however, provide a filter string that is invalid, then an EvaluateException will be thrown.
Filtering Rows on State
Each row within a DataView has a defined row state, which will be one of the following values. This state can also be used to filter the rows viewed by the user.
| DataViewRowState | Description |
|---|---|
| Added | All rows that have been newly created. |
| CurrentRows | All rows except those that have been deleted. |
| Deleted | All rows that were originally selected and have been deleted - does not show newly created rows that have been deleted. |
| ModifiedCurrent | Lists all rows that have been modified, and shows the current value of each column. |
| ModifiedOriginal | Lists all rows that have been modified, but shows the original value of the column and not the current value. |
| OriginalRows | All rows which were originally selected from a data source. Does not include new rows. Shows the original values of the columns (that is, not the current values if changes have been made). |
| Unchanged | All rows that have not changed in any way. |
To view the effect of these states on a grid, I've written an example that displays two grids - one being data selected from the database that you can interact with, the other showing rows in one of the above states:
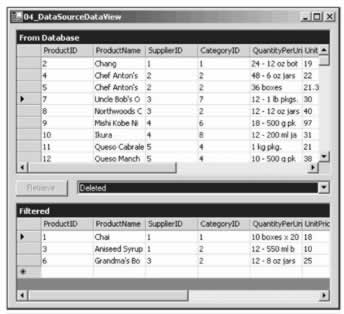
The filter not only applies to the rows that are visible, but also to the state of the columns within those rows. This is evident when choosing the ModifiedOriginal or ModifiedCurrent selections. These states were described in the previous chapter, and are based on the DataRowVersion enumeration. If, for example, you have updated a row in some form, then the row will show up when you choose either ModifiedOriginal or ModifiedCurrent; however, the actual value will either be the Original value selected from the database (if you choose ModifiedOriginal ), or the current value in the DataColumn if you choose ModifiedCurrent .
Sorting Rows
As well as filtering data, it is sometimes necessary to sort the data within a DataView . You can click on a column header within the DataGrid control, and this will sort a column in either ascending or descending order. The only trouble is that the control can only sort by one column, whereas the underlying DataView can sort by many columns:
When a column is sorted, either by clicking on the header (as shown on the ProductName column) or within code, the DataGrid displays an arrow bitmap to indicate which column the sort has been applied to.
To programmatically set the sort order on a column, use the Sort property of the DataView :
dataView.Sort = "ProductName"; dataView.Sort = "ProductName ASC, ProductID DESC";
The first line above will sort the data based on the ProductName column, as shown in the previous image. The second line will sort in the data in ascending order, based on the ProductName column, then in descending order of ProductID .
The DataView supports both ascending and descending sort orders on columns - the default being ascending. If you do choose to sort on more than one column within the DataView , the DataGrid will cease to display any sort arrows.
If you have done any Win32 programming with ListView controls, you'll appreciate the work that the .NET team have done for sorting within the grid. As each column within the grid can be strongly typed, its sort order is not based upon the string representation of the column. Instead, it is based on the actual data.
The upshot is that if you have a date column within the DataGrid , and you try to sort it, the grid will do date comparisons to sort rather than string comparisons.
Displaying Data from a DataSet
The DataGrid comes in to its own when displaying data from a DataSet . As with the preceding examples, the DataGrid can only display a single DataTable at a time. However, as you'll see in this example, it is possible to navigate relationships within the DataSet on screen. The following code can be used to generate such a DataSet based on the Customers and Orders tables within the Northwind database. The code is available in the \05_DataSourceDataSet directory. The example adds in these two DataTable s, and then creates a relationship between these tables called CustomerOrders :
string source = "server=(local)\NetSDK;" + "uid=QSUser;pwd=QSPassword;" + "database=northwind"; string orders = "SELECT * FROM Orders"; string customers = "SELECT * FROM Customers"; SqlConnection conn = new SqlConnection(source); SqlDataAdapter da = new SqlDataAdapter(orders, conn); DataSet ds = new DataSet(); da.Fill(ds, "Orders"); da = new SqlDataAdapter(customers , conn); da.Fill(ds, "Customers"); ds.Relations.Add("CustomerOrders", ds.Tables["Customers"].Columns["CustomerID"], ds.Tables["Orders"].Columns["CustomerID"]);
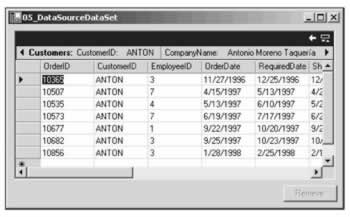
Once created, you can bind the DataSet to the DataGrid simply by calling SetDataBinding() :
dataGrid1.SetDataBinding(ds, "Customers"); This will produce a display something like the following screenshot:

You may immediately notice that unlike the other DataGrid s that we have seen in this chapter, there is a + to the left of each record. This reflects the fact that we created a DataSet with a navigable relationship, between customers and orders. You can have a number of such relationships defined in code.
When you click on the + sign, the list of relationships is shown (or hidden if already visible). Clicking on the name of the relationship will navigate the grid to the linked records, in this case listing all orders placed by the selected customer:
The DataGrid control also includes a couple of new icons in the top right corner. The arrow permits you to navigate back to the parent row, and will change the display to that on the previous page. The header row showing details of the parent record can be shown or hidden by clicking on the other button.
Displaying Data in a DataViewManager
The display of data in a DataViewManager is the same as that for the DataSet just shown. However, when a DataViewManager is created for a DataSet , an individual DataView is created for each DataTable , which then permits you to alter the displayed rows, based on a filter or the row state as shown in the DataView example. Even if you don't expect the need to filter data, I would suggest always wrapping a DataSet in a DataViewManager for display, as it gives you more options when revising your code.
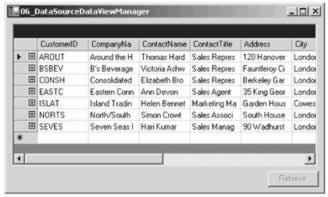
The following code creates a DataViewManager based on the DataSet from the previous example, and then alters the DataView for the Customers table to show only customers from the UK:
DataViewManager dvm = new DataViewManager(ds); dvm.DataViewSettings["Customers"].RowFilter = "Country='UK'"; dataGrid.SetDataBinding(dvm, "Customers");
The output of this code is shown below. The example can be found in the \06_DataSourceDataViewManager directory.
IListSource and IList Interfaces
The DataGrid also supports any object that exposes one of the interfaces IListSource or IList . IListSource only has one method, GetList() , which returns an IList interface. IList on the other hand is somewhat more interesting, and is implemented by a large number of classes in the runtime. Some of the classes that implement this interface are Array , ArrayList, and StringCollection .
When using IList , the same caveat for the object within the collection holds true as for the Array implementation shown earlier - if you use a StringCollection as the data source for the DataGrid , the length of the strings is displayed within the grid, not the text of the item as you would hope.
DataGrid Class Hierarchy
The class hierarchy for the main parts of the DataGrid is shown below:
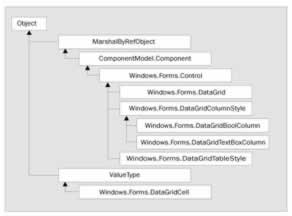
The DataGrid consists of zero or more DataGridTableStyle s. These styles consist of zero or more DataGridColumnStyle s. A given cell in the grid can be accessed by means of the DataGridCell struct.
However, there's more to DataGridTableStyle and DataGridColumnStyle than simply letting the runtime create them for you. The following sections will describe these and the other main classes shown in the above figure. The following sections will discuss these in detail, and show how you can alter many facets of the on-screen display of data using these classes.
DataGridTableStyle and DataGridColumnStyle
A DataGridTableStyle contains the visual representation of a DataTable . The DataGrid contains a collection of these styles, accessible by the TableStyles property. When a DataTable is displayed, a check is made through all DataGridTableStyle objects to find one with its MappingName property equal to the TableName property of the DataTable . On finding a match, that style will be used in the display of the table.
The DataGridTableStyle permits you to define visual parameters for the DataGrid , such as the background and foreground color , the font used in the column header, and various other properties. The DataGridColumnStyle allows you to refine the display options on a column-by-column basis, such as setting the alignment for the data in the column, the text that is displayed for a null value, and the width of the column on screen.
When the DataGrid displays a DataTable with a defined DataGridTableStyle , you can define which columns of data are actually displayed by adding (or not adding) a DataGridColumnStyle . Only columns that have a defined style will be displayed, which can be useful for "hiding" columns such as primary key values that are not normally displayed. You may also define a column style as ReadOnly .
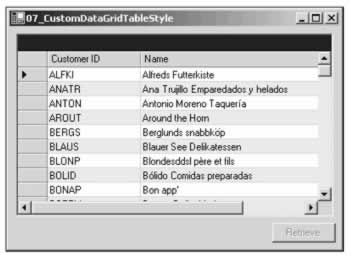
The code below shows an example of creating a DataGridTableStyle . The code creates a DataGridTableStyle object, adds in two DataGridColumnStyle objects, and then displays all of the data within the Customers table. We'll show the code in its entirety, as this will be the basis for several examples in this section. The first part of the code should be familiar from our earlier example:
using System; using System.Windows.Forms; using System.Data; using System.Data.SqlClient; public class CustomDataGridTableStyle : System.Windows.Forms.Form { private System.Windows.Forms.Button retrieveButton; private System.Windows.Forms.DataGrid dataGrid; public CustomDataGridTableStyle() { this.AutoScaleBaseSize = new System.Drawing.Size(5, 13); this.ClientSize = new System.Drawing.Size(464, 253); this.Text = "07_CustomDataGridTableStyle"; this.dataGrid = new System.Windows.Forms.DataGrid(); dataGrid.BeginInit(); dataGrid.Location = new System.Drawing.Point(8, 8); dataGrid.Size = new System.Drawing.Size(448, 208); dataGrid.TabIndex = 0; dataGrid.Anchor = AnchorStyles.Bottom AnchorStyles.Top AnchorStyles.Left AnchorStyles.Right; this.Controls.Add(this.dataGrid); dataGrid.EndInit(); this.retrieveButton = new System.Windows.Forms.Button(); retrieveButton.Location = new System.Drawing.Point(384, 224); retrieveButton.Size = new System.Drawing.Size(75, 23); retrieveButton.TabIndex = 1; retrieveButton.Anchor = AnchorStyles.Bottom AnchorStyles.Right; retrieveButton.Text = "Retrieve"; retrieveButton.Click += new System.EventHandler(this.retrieveButton_Click); this.Controls.Add(this.retrieveButton); } protected void retrieveButton_Click(object sender, System.EventArgs e) { retrieveButton.Enabled = false; These generate the DataSet that will be used, then create the DataGridTableStyle s for use in the example, and finally bind the DataGrid to the DataSet . The CreateDataSet method is nothing particularly new as we will see later; it simply retrieves all rows from the Customers table:
DataSet ds = CreateDataSet(); CreateStyles(dataGrid); dataGrid.SetDataBinding(ds, "Customers"); }
The CreateStyles() method is, however, more interesting. The first few lines create the new DataGridTableStyle object, and set its MappingName property. This property is used when the DataGrid displays a given DataTable . The DataGrid can display rows in alternating colors. The code here also defines the color for every second row, and the output is displayed in the screenshot later in this section:
private void CreateStyles(DataGrid dg) { DataGridTableStyle style = new DataGridTableStyle(); style.MappingName = "Customers"; style.AlternatingBackColor = System.Drawing.Color.Bisque; DataGridTextBoxColumn customerID = new DataGridTextBoxColumn(); customerID.HeaderText = "Customer ID"; customerID.MappingName = "CustomerID"; customerID.Width = 200; DataGridTextBoxColumn name = new DataGridTextBoxColumn(); name.HeaderText = "Name"; name.MappingName = "CompanyName"; name.Width = 300;
When the columns have been defined, they are added to the GridColumnStyles collection of the DataGridTableStyle object, which itself is then added to the TableStyles property of the DataGrid :
style.GridColumnStyles.AddRange (new DataGridColumnStyle[]{customerID , name}); dg.TableStyles.Add(style); } private DataSet CreateDataSet() { string source = "server=(local)\NetSDK;" + "uid=QSUser;pwd=QSPassword;" + "database=northwind"; string customers = "SELECT * FROM Customers"; SqlConnection con = new SqlConnection(source); SqlDataAdapter da = new SqlDataAdapter(customers , con); DataSet ds = new DataSet(); da.Fill(ds, "Customers"); return ds; } static void Main() { Application.Run(new CustomDataGridTableStyle()); } }
After creating the DataGridTableStyle object, we created two objects derived from DataGridColumnStyle - in this instance they are textboxes. Each column has a number of properties defined. The following table lists some of the key properties:
| Property | Description |
|---|---|
| Alignment | One of the HorizontalAlignment enumerated values - Left , Center, or Right . This indicates how data in the column is justified. |
| FontHeight | The size of the font in pixels. This will default to that of the DataGrid if no value is set. This property is protected , so can only be modified if you create your own subclass. |
| HeaderText | The text displayed in the column heading. |
| MappingName | The column in the DataTable represented by the displayed column. |
| NullText | The text displayed within the column if the underlying data value is DBNull . |
| PropertyDescriptor | This will be discussed later in the chapter. |
| ReadOnly | A flag indicating whether the column is read-write or read-only. |
| Width | The width of the column in pixels. |
The display resulting from this code is shown below. The example is available in the \07_CustomDataGridTableStyle directory:
EAN: 2147483647
Pages: 244
- Chapter I e-Search: A Conceptual Framework of Online Consumer Behavior
- Chapter V Consumer Complaint Behavior in the Online Environment
- Chapter VI Web Site Quality and Usability in E-Commerce
- Chapter IX Extrinsic Plus Intrinsic Human Factors Influencing the Web Usage
- Chapter XVI Turning Web Surfers into Loyal Customers: Cognitive Lock-In Through Interface Design and Web Site Usability