Section 11.6. The Strategy Report
11.6. The Strategy ReportIn our experience, this deliverable serves as the catalyst for the most detailed, comprehensive articulation of the information architecture strategy. The process of integrating the previous results, analysis, and ideas into a single written document forces tough decisions, intellectual honesty, and clear communication. Great ideas that don't fit within the broader framework must be discarded in the name of consistency and cohesiveness. Big, vague ideas must be broken down into components and explained so that all involved can understand their intention and implications. For the information architecture team, the strategy report is often the largest, hardest, and most important deliverable. It forces the team members to come together around a unified vision for the information architecture, and requires them to find ways to explain or illustrate that vision so that clients and colleagues (i.e., people who are not information architects) will understand what the heck they're talking about. One of the hardest things about writing the report is organizing it. Here you face yet another chicken-and-egg problem. An information architecture strategy is not linear, but a report forces a linear presentation. "How will they understand this section if they haven't read that later section?" is a common question. There's rarely a perfect solution, but the problem can be dealt with in a couple of ways. First of all, by including high-level visuals in the report, you can paint a nonlinear big picture and follow up with linear textual explanations. Second, remember that a strategy report cannot and should not stand completely alone. You should always have an opportunity to verbally explain your ideas and answer questions. Ideally, you'll have a face-to-face information architecture strategy presentation; at a minimum, you should have a conference call to discuss reactions and answer questions. The only thing harder and more abstract than writing an information architecture strategy report is trying to write about how to write one. To bring this subject to life, let's examine a real strategy report that Argus created for the Weather Channel (http://www.weather.com/) in 1999. 11.6.1. A Sample Strategy ReportThe Weather.com web site is a component of the broader Weather Channel family of services (including cable television, data and phone, radio and newspaper, and the Internet) that has provided timely weather information to the world since 1982. The Weather Channel web site is one of the most popular sites in the world, and features current conditions and forecasts for over 1,700 cities worldwide along with local and regional radars. In 1999, the Weather Channel contracted Argus Associates to conduct research and recommend a strategy for improving the information architecture of Weather.com. Let's take a look at the table of contents of the final strategy report for this engagement (Figure 11-6). Figure 11-6. Table of contents for the Weather.com strategy report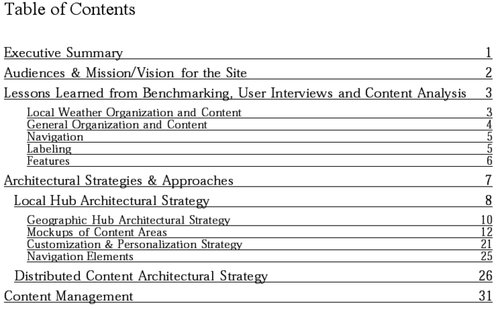 This table of contents should provide a rough sense of the size and scope of the strategy report. While some of our reports (including blueprints and wireframes) have been more than 100 pages, we encourage our teams to strive for fewer than 50. If it gets much longer than that, you run the risk that nobody will have the time or inclination to read it. The major sections of this report are fairly typical. Let's take a look at each one in turn. 11.6.1.1. Executive summaryThe executive summary (Figure 11-7) should provide a high-level outline of the goals and methodology, and present a 50,000-foot view of the major problems and major recommendations. The executive summary sets a tone for the entire document and should be written very carefully. It's helpful to think of this as the one page of the whole report that will be read by the big boss. You need to consider the political message you're sending, and generate enough interest to get people to continue reading. Figure 11-7. Executive summary for Weather.com The executive summary in Figure 11-7 does a nice job of accomplishing its objectives within one page. We were able to take such an upbeat tone because the Weather.com team was already well organized and had a fairly solid information architecture in place. This executive summary places an emphasis on recommendations for improving the information architecture to achieve greater competitive advantage. 11.6.1.2. Audiences, mission, and vision for the siteIt's important to define the audiences and goals of the site to make sure that the report (and the reader) is grounded by the broader context. This is a good place to restate the mission statement for the web site. The following is the mission statement from the Weather.com strategy report: Weather.com will be the best weather web site on the Internet. As the dominant brand leader of weather information on the Internet, Weather.com will provide relevant, up-to-the-minute information about the weather to any user. The primary focus of the site is to provide localized weather data and value-added proprietary and exclusive weather and weather-related content, supported by significantly related non-proprietary content. Weather.com will employ technology that effectively leverages personalization and customization of content, and that allows us to meet user demands during extraordinary weather conditions. This is also a good place to define a vocabulary for discussing the roles of users and the audience segments. Figure 11-8 shows how this was accomplished for the Weather.com report. Figure 11-8. Audiences and roles for Weather.com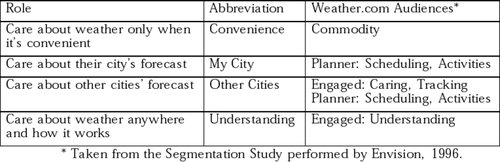 11.6.1.3. Lessons learnedThis section forms the bridge between your research and analysis and your recommendations. By showing that your recommendations are grounded in the results of competitive research (benchmarking), user interviews, and content analysis, you will build confidence and credibility. In the Weather.com report, we organized this section into five subcategories. The following table shows a sample observation from each:
11.6.1.4. Architectural strategies and approachesNow we get to the meat of the reportthe explanation of the recommended architectural strategies and approaches. This is a fairly extensive section, so we can't include it in its entirety, but we can present and briefly explain a few of the visuals used to illustrate the recommendations. This report presents two strategies, local hub and distributed content, which are intended to be used in tandem. The local hub strategy centers on the fact that users are mainly focused on learning about their local weather. The conceptual blueprint in Figure 11-9 presents an information architecture built around this local hub strategy. This blueprint is fairly difficult to understand without the accompanying text and context, some of which is shown in Figure 11-10. At a high level, it provides for geography-specific access (the local hub), and specifies major content areas and tasks that will ultimately be translated into navigation options on the local hub web page. These conceptual blueprints are followed by a series of wireframes that further illustrate the key points. For each of the lettered call-outs in the wireframe, we included a textual explanation. The following table shows two examples.
On the other hand, the distributed content architectural strategy is centered on the fact that there are a wide variety of portals other than Weather.com through which users access weather information. For example, Yahoo! serves as a general portal for many users. Weather information is one component of a wide range of information needs for Yahoo! users. Figure 11-9. A conceptual blueprint for Weather.com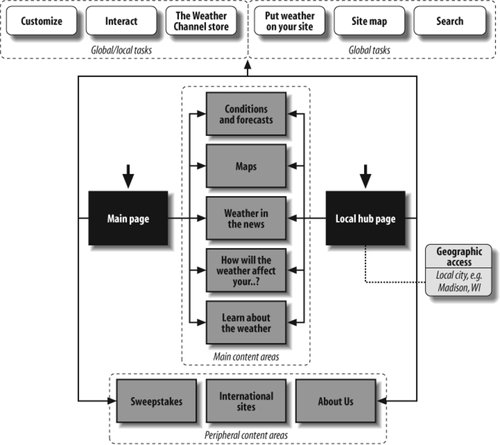 Figure 11-10. The accompanying wireframe for Weather.com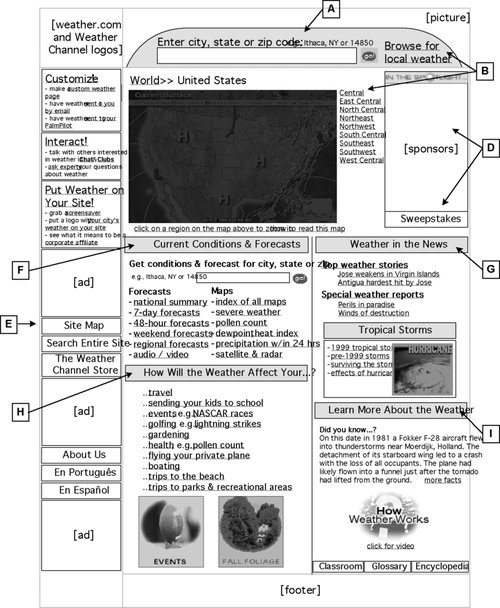 The Weather Channel has partnerships with some of these portals, providing customized access to Weather.com content. The distributed content architectural strategy shown in Figure 11-11 presents a model for how to structure the information architecture for these partnerships. Figure 11-11. A distributed content architecture for Weather.com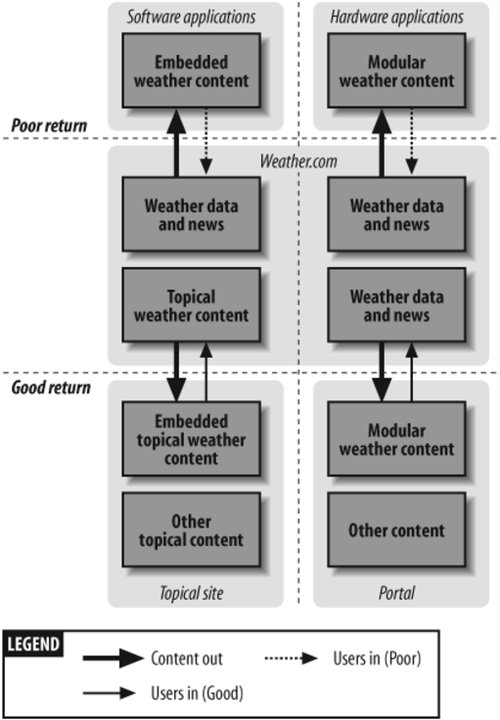 One of the major goals of this architectural strategy is to get users to return to the place that contains all the content: the Weather.com web site. When distributing content, it's not possible to offer users everything they need, so it's important to provide "teasers" to attract users to the site. This architectural diagram places emphasis on the rate of return to the Weather.com site. It makes the point that it's more likely that users will come to Weather.com from topical web sites and general portals than from embedded software applications (e.g., a Java-based Miami heat index) or wireless hardware platforms (e.g., a Palm Pilot or cell phone). 11.6.1.5. Content managementThe final section of this report provides a reality check by discussing how these information architecture recommendations will impact the content management infrastructure. Any discussion of content management is very context-sensitive, depending upon the people, technology, and content in question. In this particular report, we took a high-level pass at explaining the relationship between information architecture and content management. It begins with a brief description of the three components of effective content management, as follows:
We then go on to provide specific recommendations to Weather.com that might lead to more efficient content management. Here are just a few of the recommendations:
|
EAN: 2147483647
Pages: 194