SOS
| Now we can shift our attention to the in-depth look of our managed processes running under WinDBG with SOS. Before we jump in, I just want to mention what SOS is doing under the hood to make its magic. SOS takes the metadata from a .NET binary and maps it onto the live addresses in memory so you can see a live application (or minidump) as you expect to see it. When you start looking at output from various SOS commands, you'll see references to the metadata throughout. It's not a bad idea to keep an eye on the metadata for an assembly when using SOS with ILDASM, the round trip disassembler that comes with the .NET Framework SDK. It's as simple as opening the assembly with ILDASM and pressing Ctrl+M. In the .NET 1.1 days, you needed to run Ildasm.exe with the /ADV switch to see the metadata for an assembly, but for .NET 2.0, the metadata is on by default. Manually walking the metadata tables gives new meaning to the term tedious. The good news is that you don't spend a great deal of time in SOS doing that. I will mention the commands that will let you do the manual metadata walking in due course. Before we can get there, you do need to know how to load SOS. Loading SOS into WinDBGAs I mentioned back in the beginning of this chapter, everyone already has SOS for .NET 2.0 installed on their systems as its part of the actual .NET Framework installation. The whole trick to SOS is ensuring that you load the exact version of SOS to match the version of the .NET Framework loaded into the process. The good news is that there's a new command in WinDBG, .loadby(Load Extension DLL), which makes getting the proper version trivial. Before using .loadby, you'll need to ensure that you have MScorwks.dll loaded in your live process or minidump. Unlike .NET 1.1, which had separate DLLs that implemented the garbage-collected heap for workstations and servers, .NET 2.0 has both heap types in MScorwks.dll. Issue the lm v m mscorwks command to see the full version information for the loaded MScorwks.dll. The following shows the output if MScorwks.dll is loaded. If there's no module listed, MScorwks.dll is not loaded. 0:012> lm v m mscorwks start end module name 00000642 7f330000 00000642 7fd1d000 mscorwks (deferred) Image path: C:\WINDOWS\Microsoft.NET\Framework64\v2.0.50727\mscorwks.dll Image name: mscorwks.dll Timestamp: Fri Sep 23 05:17:48 2005 (4333C83C) CheckSum: 009E1495 ImageSize: 009ED000 File version: 2.0.50727.42 Product version: 2.0.50727.42 File flags: 0 (Mask 3F) File OS: 4 Unknown Win32 File type: 2.0 Dll File date: 00000000.00000000 Translations: 0409.04b0 CompanyName: Microsoft Corporation ProductName: Microsoft® .NET Framework InternalName: mscorwks.dll OriginalFilename: mscorwks.dll ProductVersion: 2.0.50727.42 FileVersion: 2.0.50727.42 (RTM.050727-4200) FileDescription: Microsoft .NET Runtime Common Language Runtime WorkStation LegalCopyright: © Microsoft Corporation. All rights reserved. Comments: Flavor=Retail If MScorwks.dll is loaded, pass two parameters to the .loadby command. The first is the extension DLL itself, SOS, and the second is the module name of the DLL you want WinDBG to use as the path to the extension to load. In other words, the second DLL is there just to provide the path. The full command is: .loadby sos mscorwks. If you don't see any output after the .loadby sos mscorwks command, that means that the SOS extension DLL was loaded just fine. You can double-check that SOS loaded by issuing the .chain (List Debugger Extensions) command. If you see SOS as the first DLL listed after the extension DLL search path, you are in great shape. Those of you paying close attention may be wondering about the requirement to have MScorwks.dll loaded before you can get SOS loaded. This leads to some interesting problems. The first is handling the case in which you are debugging a minidump that uses a different version of the .NET Framework than you have on your machine. The second involves the case in which you want SOS loaded so you can debug your startup code. In the case of the minidump with a different version of the .NET Framework, ideally, you'll have the different versions of the .NET Framework either installed on other machines or possibly stored on a server. If you do, use the traditional .load (Load Extension DLL) command to tell WinDBG to load a particular extension by specifying the complete name and path to the extension DLL as follows: 0:000> .load C:\WINDOWS\Microsoft.NET\Framework64\v2.0.50727\sos.dll If you want to load the correct version of SOS, but .NET is not loaded in the debugging session, you can set a native breakpoint on the part of MScorwks.dll that does the first initialization of .NET. Once that breakpoint triggers, you'll have MScorwks.dll loaded and the bare minimum of .NET initialized so the commands in SOS will work. The trick is to use the bu (Set Unresolved Breakpoint) command. With bu, you're telling WinDBG to set a breakpoint so that every time a module comes into the address space, the debugger will look to see if that module contains the specified breakpoint, and if it does, WinDBG will set an active breakpoint on that location. The command you'll use to set the breakpoint on .NET initialization is: bu mscorwks!EEStartup "gu;.loadby sos mscorwks" After the bu command are two parameters. The first is the method to break on. In this case, it's the EEStartup native method in MScorwks.dll. Obviously, you need the symbols to the .NET Framework in your symbol server in order for this address to work. The second command to bu, delineated by the double quotes, contains the commands we want run when the breakpoint triggers. Inside the quotes are two commands. The first is the gu (Go Up) command, which is similar to the g command I discussed earlier. The gu command sets a breakpoint on the return address of the current function so execution will stop after the current function executes. For our needs, that will stop execution in the function that called EEStartup. If you've been around WinDBG for a while, you might remember the g @$ra command, which is identical. We're taking advantage of the power of WinDBG because the address in MScorwks.dll that makes the call to EEStartup will change with every build. The gu allows us to generalize no matter what version of MScorwks.dll you'll be running in the future. The second command executed at the breakpoint is the familiar command to load SOS.dll. It's safe to do the load as part of the breakpoint because the breakpoint executes only when MScorwks.dll is already loaded in the address space so the .loadby command can use the path where MScorwks.dll resides. The last item I wanted to mention about the breakpoint approach to loading SOS is that some documentation shows a similar command to the one I presented but uses the bp (Set Breakpoint) command. The differences between the bp and bu commands are minimal except for one: bu commands are saved with WinDBG workspace, whereas bp commands are not. I like WinDBG to behave as Visual Studio and save my breakpoints across debugging sessions. Loading SOS into Visual StudioLoading SOS into Visual Studio is supported on x86 platforms only much as mixed-mode debugging is supported only on x86. Although the 32-bit Visual Studio runs fine on x64, it's essentially doing remote debugging to debug the 64-bit version of the runtime. As a 32-bit process, the debugger can't load the 64-bit version of the SOS DLL. The other limitation for loading SOS is that you have to be doing either native-only or mixed-mode debugging in order for SOS to load. I discussed how to set up for mixed-mode debugging in the "Mixed-Mode Debugging" section of Chapter 5, "Advanced Debugger Usage with Visual Studio," so I won't repeat it here. Also, note that when you open a minidump file in Visual Studio, by selecting Open Solution on the File menu, the minidump is treated as a native minidump, so you can load SOS into Visual Studio in order to look at the .NET portions. SOS can be loaded only once you've started debugging, so either single-step into the application or break into the debugger. Once stopped, switch to the Immediate window because that's the only place where SOS can be loaded. In the Immediate window, type the command .load sos. Visual Studio's .load command is equivalent to the .loadby in WinDBG, so it properly loads the version of SOS for the currently loaded framework. If you want to force SOS.dll to load out of a different directory, you can also pass the complete file name to the .load command. If SOS loads correctly, the output will be the file path where SOS was loaded from. As with WinDBG, you'll have to load SOS each time you start debugging. Once it's loaded, you have full access to all the SOS commands just as I'll discuss through the rest of the chapter. If you're more comfortable with the Immediate pane of Visual Studio, you can use it to issue all your SOS commands, but you'll find that all the extra commands available in WinDBG are well worth the effort. You'll find that the more SOS debugging you do, the more you'll use WinDBG. Getting Help and Using CommandsIf you did a search in the WinDBG documentation, you ran into only a single page that discusses SOS and managed debugging. At the time of this writing, the page consists of the briefest overviews of what managed code is and a paragraph on how to load SOS for .NET 1.1. The first command you'll want to run (and run and run and run) after loading SOS is !help. It's the only documentation on SOS, and it's actually not too bad. Running !help will show you the list of documented commands supported by WinDBG. For more information on a specific command, type the particular command after !help, and you'll get more information about that command. There's an option in the SOS help command output called FAQ, and if you pass that to !help, you'll see that it's a list of frequently asked questions. The !help command shows the SOS commands in a mixed-case mode, that is, !ClrStack. Traditionally, WinDBG extension commands are all lowercase. SOS supports both the mixed case as shown by the Help and the all lowercase. Some of the old WinDBG hands out there might remember that other extensions provide their own !help commands. When you issue an extension command, WinDBG looks down the list of loaded extensions as reported by the .chain command. The first matching export command is the one that's run. To tell WinDBG to run a particular command out of a specific extension DLL, use the format: !dll name.command. To get the help out of the default loaded Ext.dll, the command would be !ext.help. It's rare that extensions overload commands, but !help always is overloaded. A moment ago, I mentioned that !help shows you the documented commands. Some of you may be wondering if there are any undocumented commands in your particular version of SOS. WinDBG extensions are native DLLs that expose their commands as standard exported functions, so it's easy to take a peek. If you installed the C++ compiler as part of your Visual Studio installation, the default installation includes Dependency Walker (Depends.exe), which you can use to view exported functions from a native binary. If you haven't installed the tools, you can download Dependency Walker from http://www.dependencywalker.com. After you open SOS.dll, highlight SOS.dll, and the exported functions list of the Dependency Walker display will show all the functions exported from SOS. You can easily look through the exported functions list and compare what's exported to what's listed by the !help command. In the version I'm currently using, there's an exported function called !tst. Executing !tst does the same thing as the !clrstack command we'll talk about in a moment. Of course, at this point I need to issue the official "Hacker Warning." Microsoft may have meant to document the command but just forgot. In that case, it's our gain. However, don't hold me responsible if executing the command reformats your hard disk, ruins the paint on your car, or causes your dog to run away from home. If the command does turn out to do something worthwhile, please let others know about it. Now that I've gotten the most important SOS command, !help, out of the way, it's time to turn to the real commands. I'll discuss the various commands in the general order you'll run them on minidumps you'll get from customers. Program State and Managed ThreadsThe first command you'll run will be !eeversion, which tells you the version of the .NET runtime currently loaded in the process or minidump. You can get the same information from the lm v m mscorwks command, but !eeversion will tell you if the CLR is in workstation mode, in which all CPUs on the system share a garbage-collected thread, or server mode, in which there's one garbage-collected heap for each CPU. When doing live debugging with SOS loaded, and you want to take a quick look at the process memory usage, kernel times, and environment variables, you can use the !procinfo command. Although there are other commands inside WinDBG to show those pieces of information, you have to wade through the output of three separate commands. With !procinfo, you get all that data in one place. If you want to see just one piece of information from !procinfo, pass -mem, -time, or -env as the parameter to the command. If you're doing interop with COM components that are single-threaded apartments, you can use the !comstate command to see information about the apartments running on each thread. The important piece of information is the thread ID of the thread calling into a particular apartment so you can track down potential deadlocks. Although you might be wishing that COM would just go away, it will be with us until the end of time. !threads CommandSeeing the threads that are running managed code is as simple as issuing the !threads command. As it stands today, .NET is implemented with each managed thread corresponding to a native thread. Future versions of .NET may implement threads as fibers or some other threading mechanism. The !threads command is also one of the few commands that will also work when you're looking at a basic memory minidump. Using an application that calls only Trace.WriteLine and is stopped in WinDBG with an sxe out, the thread command looks like the following: 0:000> !threads ThreadCount: 2 UnstartedThread: 0 BackgroundThread: 1 PendingThread: 0 DeadThread: 0 Hosted Runtime: no PreEmptive GC Alloc Lock ID OSID ThreadOBJ State GC Context Domain Count APT Exception 0 1 e88 001b4a40 a020 Enabled 01d39400:01d3a350 00157940 1 MTA 2 2 a94 001b5be0 b220 Enabled 00000000:00000000 00157940 0 MTA (Finalizer) The first part of the output shows statistics about the managed threads in the process. UnstartedThread lists the number of threads created, but the application has not called the Start method yet. The BackgroundThread field indicates the number of threads that have the IsBackground property set to true. You will always see a minimum of one background thread because the finalizer thread is always a background thread. If you know you are setting IsBackground to true, it's a good idea to compare the number you see in this field to what you expect in the source code. The DeadThread field should be zero in all cases. A dead thread, not to be confused with a follower of the band Grateful Dead, is a managed thread object that has not been garbage collected and the backing native thread has ended. You may stop in the debugger or minidump and see one or two dead threads if your timing is right. However, if you have more than a couple of threads listed in the DeadThread field, you have a serious problem. That means you have finalizer threads that have blocked, so the runtime killed them. Because there are references to those thread objects in memory, the garbage collector can never clean them up. After the statistics comes the data for each managed thread. The first column that is not labeled corresponds to the WinDBG native thread ID reported by the ~ command. For any .NET application, there will always be one pure native thread running: the garbage collector thread. If the value in the first column is XXXX, it means one of two things. If there is a number in the UnstartedThread statistics, the XXXX indicates those Thread objects whose Start method hasn't been called. If there are no threads waiting to start, the XXXX indicates the dead threads of blocked finalizers. The ID column is the ID for the managed thread, which is the same value returned by the Thread.ManagedThreadId property. You'll never use the managed thread ID anywhere when using SOS. The OSID column indicates the operating system thread ID. A value of 0 next to an XXX thread because there's no native thread associated with the managed portion. The ThreadOBJ column is the actual Thread object in memory. The State column contains a bit field that describes the state of the thread at a given time. Table 6-2 shows the bit field meanings that come from the Rotor source code. If you're not familiar with Rotor, it's the code name for the Shared Source Common Language Infrastructure project, which Microsoft released to show a European Computer Manufacturers Association (ECMA) implementation of C# and the Common Language Runtime (CLR). You can download the code at http://www.microsoft.com/downloads/details.aspx?FamilyId=8C09FD61-3F26-4555-AE17-3121B4F51D4D&displaylang=en. Because the code for Rotor is very close to the real CLR on your computer, it's an excellent place to look for implementation details.
Not all the values in the State are useful, but overall, the number can tell you some very interesting information about the thread. If you're looking for a nice project, a tool or WinDBG extension that would take the thread state and display all the actual values would be useful. The PreEmptive GC column indicates if the thread is interruptible for a garbage collection. The GC Alloc Context field reports the synchronization object used by the garbage collector to synchronize access. If the values reported are something other than zero, you're running on a multiprocessor machine. The finalizer thread, unstarted threads, and dead threads will always have zero in this field. The Domain column shows the application domain that owns the thread in the process. You can use the !dumpdomain command, which I'll discuss later, to look at the domain itself. The Lock Count column is extremely important because it shows the locks the thread has acquired. In the example I used, thread 0 has a lock because of the call to Trace.WriteLine where we are stopped on because of sxe out. You may not realize that the Trace object serializes execution to call all the TraceListeners in the Listeners collection one at a time. If you are tracking down a deadlock in your code, this is the first column you want to look at for potential problems. The penultimate column, APT, shows the COM apartment-threading model. This is the same data displayed in the !comstate command. The final column lists the exception that the thread is currently processing. The column displays more information in parenthesis to help you identify a thread. As you can guess, the (Finalizer) string indicates the finalizer thread, and the other values are self-explanatory. If you see (GC), that shows that the thread has requested a garbage collection. !ThreadPool CommandIf you are using thread pools in your application, you can use the !threadpool command to take a look at its state. The following shows a program that has 63 threads in the thread pool: 0:018> !threadpool CPU utilization 0% Worker Thread: Total: 63 Running: 32 Idle: 31 MaxLimit: 100 MinLimit: 63 Work Request in Queue: 4 QueueUserWorkItemCallback DelegateInfo@000000001a65c070 QueueUserWorkItemCallback DelegateInfo@000000001a6d69f0 QueueUserWorkItemCallback DelegateInfo@000000001a65df50 QueueUserWorkItemCallback DelegateInfo@000000001a65ed40 -------------------------------------- Number of Timers: 0 -------------------------------------- Completion Port Thread:Total: 0 Free: 0 MaxFree: 8 CurrentLimit: 0 MaxLimit: 1000 MinLimit: 63 The CPU utilization field shows the machine CPU utilization, not the process. The Worker Thread row shows totals for the threads in the pool. In the output, four items on the work queue have yet to be processed. If there are no items to queue or callback timers to complete, you won't see any output there. The final line shows the I/O completion port threads currently running. In ASP.NET applications, you can change the number of I/O completion port threads by setting the maxIoThreads and minIOThreads attributes in the processModel element of Machine.Config. Managed Call StacksAs any programmer will tell you, knowing what's on the stack is all important. Whereas looking at the values of locals and parameters on the stack is trivial with Visual Studio, it's a bit of an adventure with SOS. !ClrStack CommandThe primary command for looking at a managed stack is !clrstack. All it takes is switching to the thread you want to walk and issuing the command. 0:000> !clrstack OS Thread Id: 0x49c (0) ESP EIP 0012f2f8 7c81eb33 [NDirectMethodFrameStandalone: 0012f2f8] Microsoft.Win32.SafeNativeMethods.OutputDebugString(System.String) 0012f308 7a61413b System.Diagnostics.DefaultTraceListener.internalWrite(System.String) 0012f310 7a61408c System.Diagnostics.DefaultTraceListener.Write(System.String, Boolean) 0012f328 7a614172 System.Diagnostics.DefaultTraceListener.WriteLine(System.String) 0012f334 7a61aa95 System.Diagnostics.TraceInternal.WriteLine(System.String) 0012f370 7a618125 System.Diagnostics.Trace.WriteLine(System.String) 0012f374 02e109fb ArgParser..ctor(System.String[], Boolean, System.String[]) 0012f388 02e10998 ArgParser..ctor(System.String[]) 0012f398 02e10921 WordCountArgParser..ctor() 0012f3ac 02e100fd App.Main(System.String[]) 0012f6b8 796cfabb [GCFrame: 0012f6b8] The above output is from an x86 system and is nearly identical to what you would see with an x64 call stack. The top of the stack on an x64 system does not show the call through interop to OutputDebugString, but it will show the following instead indicating the interop function call: DomainBoundILStubClass.IL_STUB(System.String). Whereas, especially on native x86 code, you may not get the complete stack because you're missing symbol files, you will always get the complete managed call stack with !clrstack as long as some native code has not corrupted the stack itself. Seeing the parameter types makes a nice bonus. To look at the parameter names and values, use the -p switch. Locals are displayed with -l, and both can be retrieved at the same time with the -a switch. In general, displaying parameters works, but occasionally, you'll see <no data> where you'd expect to see values. Local variables names are not displayed, but their memory locations and values are. When we get to the "Displaying Object Data" section later in this chapter, you'll see how to get even those items that the !clrstack command does not show. The following shows a portion of a !clrstack -a output: 0012f360 7a618125 System.Diagnostics.Trace.WriteLine(System.String) PARAMETERS: message = <no data> 0012f364 03020a50 ArgParser..ctor(System.String[], Boolean, System.String[]) PARAMETERS: this = 0x00b01e5c switchSymbols = 0x00b01f50 caseSensitiveSwitches = 0x00000000 switchChars = 0x00b01f9c LOCALS: 0x0012f364 = 0x00000002 0x0012f368 = 0x00000000 0012f388 03020998 ArgParser..ctor(System.String[]) PARAMETERS: this = 0x00b01e5c switchSymbols = 0x00b01f50 LOCALS: <CLR reg> = 0x00b01f9c The first item displayed shows the parameter name to the Trace.WriteLine method but does not display the data. The second item, ArgParser..ctor, properly shows the parameter names and values. The value after the this parameter is the object instance in memory and the address you'll need to dump the value. The parameters are shown in the order they are passed to the method. Therefore, the caseSensitiveSwitches is a Boolean, and you can see that its value is false. The local variables are shown at their stack addresses. The first address, 0x0012f364, has the value 0x2, which you can conclude is a value type instead of a memory location. The last item method shown, the one parameter version of ArgParser..ctor, shows a local variable that's in a register (enregistered) and not on the stack. Back in the "Walking the Native Stack" section, I mentioned the nice trick of using the ~*e prefix on a command to execute the command for all threads in the process. I like to use ~*e!clrstack to get all the stacks walked at once so I can see a picture of the application in a few keystrokes. !DumpStack CommandAs we've already seen, there's not a complete way to get a mixed managed and native call stack. However, the !dumpstack command can come close. The command runs through the stack register and reports anything that looks like a return address for both native and managed methods. If you want to see just the managed stack output from !dumpstack, you can pass -ee to limit the output. On x86 platforms, the output is quite verbosethere can be quite a bit of extraneous information on the stack, so you're going to have to carefully pick your way through. But you should be able to see the proper flow of the stack. If you're lucky enough to be running on an x64 platform, the fact that there's only a single calling convention for both native and managed means that the result of !dumpstack is the exact mixed stack. Feel free to use this as justification to your boss to get that dual-processor, dual-core Opteron you've always wanted. The output from !dumpstack on x64 for the call stack I showed with !clrstack is as follows: 0:000> !dumpstack OS Thread Id: 0x98c (0) Child-SP RetAddr Call Site 000000000012e550 0000000078d9fb19 KERNEL32!RaiseException+0x5c 000000000012e620 0000000078d9f743 KERNEL32!OutputDebugStringA+0x76 000000000012e920 0000000075ecce24 KERNEL32!OutputDebugStringW+0x42 000000000012e970 00000000794769e5 mscorwks!DoNDirectCall__PatchGetThreadCall+0x78 000000000012ea10 0000000079476b75 System_ni!DomainBoundILStubClass.IL_STUB(System.String)+0x65 000000000012eae0 0000000079476c11 System_ni!System.Diagnostics.DefaultTraceListener .Write(System.String, Boolean)+0xb5 000000000012eb40 0000000079467089 System_ni!System.Diagnostics.DefaultTraceListener .WriteLine(System.String, Boolean)+0x51 000000000012eb80 000000001a751469 System_ni!System.Diagnostics.TraceInternal .WriteLine(System.String)+0xe9 000000000012ec10 000000001a751327 WordCount!ArgParser..ctor(System.String[], Boolean, System.String[])+0xf9 000000000012ec60 000000001a751236 WordCount!ArgParser..ctor(System.String[])+0xa7 000000000012ecb0 000000001a750535 WordCount!WordCountArgParser..ctor()+0x146 000000000012ed10 0000000075ecf422 WordCount!App.Main(System.String[])+0xc5 000000000012f080 0000000075d9cb5a mscorwks!CallDescrWorker+0x82 000000000012f0d0 0000000075d9afd3 mscorwks!CallDescrWorkerWithHandler+0xca 000000000012f170 0000000075cf09f3 mscorwks!MethodDesc::CallDescr+0x1b3 000000000012f3b0 0000000075e56775 mscorwks!ClassLoader::RunMain+0x287 000000000012f610 0000000075e2ebe8 mscorwks!Assembly::ExecuteMainMethod+0xb9 000000000012f900 0000000075e6a523 mscorwks!SystemDomain::ExecuteMainMethod+0x3f0 000000000012feb0 0000000075e78205 mscorwks!ExecuteEXE+0x47 000000000012ff00 000000007401a726 mscorwks!CorExeMain+0xb1 000000000012ff50 0000000078d5965c mscoree!CorExeMain+0x46 000000000012ff80 0000000000000000 KERNEL32!BaseProcessStart+0x29 !EEStack CommandI hope you are not tired of walking the stacks yet, but there is one more command, !eestack, you can use to see where you are. !eestack is identical to the command ~*e!dumpstack. As you can probably guess, if you pass -ee to !eestack, that parameter will be passed in turn to each !dumpstack call executed on each thread. Probably the main reason you'll be using !eestack is the interesting -short option. If specified, that tells !eestack to walk only threads that are interesting. In SOS's world, interesting threads are those that have acquired a lock, been hijacked in order to allow garbage collection to run, and are currently executing native code. Displaying Object DataAs you've seen with the !clrstack command, SOS will tell you the location of an object in memory. You're going to spend the bulk of your time with SOS looking at those objects so you can see the state of your objects. The good news is that SOS comes with numerous commands that let you look at any object you want. The bad news is that unlike the wonderful Watch window in Visual Studio, in which you can drill deep down into an object with a few clicks, when it comes to SOS, you have to type the dumping commands repeatedly. !DumpStackObjects (!dso) CommandA surprisingly useful command to get a quick look at what objects are used on the stack is !dso. In the following snippet of output, I've stopped on a CLR exception using the command sxe clr as discussed earlier. 0:000> !dso OS Thread Id: 0x878 (0) RSP/REG Object Name 000000000012d988 0000000001da49f0 System.ArgumentNullException 000000000012d9c0 0000000001da49f0 System.ArgumentNullException 000000000012d9e8 0000000001da49f0 System.ArgumentNullException 000000000012da78 0000000001da4b30 System.String 000000000012db98 0000000001da49f0 System.ArgumentNullException 000000000012dba0 0000000001da2b28 System.Windows.Forms.MouseEventArgs 000000000012dbb0 0000000001da49f0 System.ArgumentNullException 000000000012dc60 0000000001da49f0 System.ArgumentNullException 000000000012dc68 0000000001da2b28 System.Windows.Forms.MouseEventArgs 000000000012dc70 0000000001da49d0 System.String 000000000012dca0 0000000001da2b28 System.Windows.Forms.MouseEventArgs 000000000012dcc8 0000000001da2b28 System.Windows.Forms.MouseEventArgs 000000000012dcd0 0000000001da49f0 System.ArgumentNullException 000000000012dd08 0000000001d39630 System.Windows.Forms.Button 000000000012dd10 0000000001da49d0 System.String 000000000012dd20 0000000001d36c20 System.ComponentModel.EventHandlerList As you look down the Object column, you're looking at the in-memory instances of your classes. Because this is dumping values that are parameters and locals all the way down the current thread stack, you're going to see object addresses that are the same, such as the ArgumentNullException, because that object is passed around from method to method. You're probably wondering about the value of !dso because !clrstack will pinpoint the actual parameters and locals in their correct locations. !clrstack shows you the specifically referenced objects, but it doesn't show you all the objects. In the output for the !dso command, I mentioned that the application is stopped in WinDBG on an exception. Look carefully at the first part of the output from the !clrstack command issued at that same location:
Did you notice any objects that you saw in the !dso output that are not in the !clrstack -a output? If you realized there was no ArgumentNullException, you get a gold star. The !clrstack command shows you only the managed stack, but the CLR itself can create objects in its native side that you work with, and you'll see them with !dso. In my example, a !dumpstack command shows that the item up the stack from MainForm.DoSomethingQuick is mscorwks!JIT_Throw, which, as you can tell by the name, is the native method that allocates the throw. As does the !dumpstack command, !dso grinds through the stack pointer for the current thread and can potentially report false positive values. You can pass the -verify option to !dso so it will look at each potential object it finds and double-check the objects in any of its instance fields to ensure that those references are valid. However, in most cases, seeing corrupted objects dumped is good because you can look through the displayed objects for bad data. There are two things that I've found odd about !dso on different platforms: On x86, it will show you the string value of a System.String, but not on x64. That's quite a time-saving option, so I hope that Microsoft will eventually add that to the x64 version of SOS. The other is that I end up using !dso quite a bit because it's faster than !clrstack -a, and when you are looking for a particular type instance, it's very convenient. !DumpObj (!do) CommandOnce you have an object instance address from !clrstack or !dso, you'll use !do to look at that object. Familiarize yourself with !do because you're going to be using it all the time. In the following example, I stopped in a catch block handling a FileNotFoundException. Using !dso, I got the instance address of the FileNotFoundException to dump it out: 0:000> !do 00b46080 Name: System.IO.FileNotFoundException MethodTable: 78c991a4 EEClass: 78c99124 Size: 84(0x54) bytes (C:\WINDOWS\assembly\GAC_32\mscorlib\2.0.0.0__b7a5c561934e089\mscorlib.dll) Fields: MT Field Offset Type VT Attr Value Name 78c74cd4 40000b4 4 System.String 0 instance 00000000 _className 78c7bd50 40000b5 8 ...ection.MethodBase 0 instance 00000000 _exceptionMethod 78c74cd4 40000b6 c System.String 0 instance 00000000 _exceptionMethodString 78c74cd4 40000b7 10 System.String 0 instance 00b462b0 _message 78c71c48 40000b8 14 ...tions.IDictionary 0 instance 00000000 _data 78c7538c 40000b9 18 System.Exception 0 instance 00000000 _innerException 78c74cd4 40000ba 1c System.String 0 instance 00000000 _helpURL 78c746a0 40000bb 20 System.Object 0 instance 00b46580 _stackTrace 78c74cd4 40000bc 24 System.String 0 instance 00000000 _stackTraceString 78c74cd4 40000bd 28 System.String 0 instance 00000000 _remoteStackTraceString 78c78d60 40000be 34 System.Int32 0 instance 0 _remoteStackIndex 78c746a0 40000bf 2c System.Object 0 instance 00000000 _dynamicMethods 78c78d60 40000c0 38 System.Int32 0 instance -2147024894 _HResult 78c74cd4 40000c1 30 System.String 0 instance 00000000 _source 78c78208 40000c2 3c System.IntPtr 0 instance 0 _xptrs 78c78d60 40000c3 40 System.Int32 0 instance -532459699 _xcode 78c74cd4 4001b78 44 System.String 0 instance 00000000 _maybeFullPath 78c74cd4 4001b94 48 System.String 0 instance 00b38cfc _fileName 78c74cd4 4001b95 4c System.String 0 instance 00000000 _fusionLog The header part of the !do starts with the fully qualified name of the object. The MethodTable field is the address for the metadata description for this object. You can think of MethodTable as the behavior of an object, while the instance data is the state. Another analogy for the MethodTable, in C++ terms, is that it's similar to a v-table. After the MethodTable comes the EEClass, which is the data structure that describes a type in terms of jitting and other internal data. In the "Meta Dumping Commands" section later in the chapter, I'll describe the commands you can use to look at these data structures, which you will rarely use. The Size field is important from !do, but a little misleading. The size reported is the amount of memory for the object itself, exclusive of what is referenced by the object. In essence, the size reported is that of the C# sizeof operator or a Microsoft Visual Basic LenB function. However, the actual memory used by the object, which would account for objects the class contains, such as strings, is reported by the !objsize command as 1008 bytes. I'll talk much more about the !objsize command in the "Looking At the GC Heaps" section after this one. After the module where this type is loaded comes all the field data. There is a parameter to !do, -nofields, which will turn off the field display. This is most useful for String types. As you look at the field output and you're wondering where the properties are, know that SOS doesn't display them because properties are syntactic sugar for methods. The Visual Studio debugger actually uses the CLR Debugging API's Eval method to execute the property methods in your object. SOS cannot execute anything on your object; it's just a display mechanism. Each displayed field starts with the MT column, which is the MethodTable for the field type. Although the Type column in the !dumpobj output shows the .NET type name for the field, the column will display only the last 17 characters of the name. To see the full name, you'll pass the value of the MethodTable column to the !dumpmt command, which shows the type meta-data. The Field column lists the metadata value for the individual field, which you can see using ILDASM as I described earlier. The first slightly interesting column is the Offset column. You can probably guess from the name that these are memory offsets from the beginning of the object where the field appears in memory. SOS does not support the option of entering object address.field_name, but if you know the offset of the field name you want to always look at, you can add the offset to the address to look at that individual field. For example, if you wanted to be extremely hard core and look at the _message field, which is at offset 0x10 in the FileNotFoundException, you could issue the command !do poi(00b46080+10). The poi option in the command stands for pointer to integer and is the WinDBG way of doing a (DWORD_PTR)(*(DWORD_PTR*)(00b46080+10) as you would in C++. Don't worry, I just wanted to show you how the offsets worked; there are much easier ways to look at fields! After the Offset column is the Type column. This column is much improved in .NET 2.0's version of SOS compared to previous versions. As you can see, it shows the actual type of the field. Previous instances of SOS showed either the value type name or the word CLASS, which indicated an object. The VT column, which stands for Value Type, is related to the Type column. If the value in the VT column is 1 (one), the field is an instance of a value type structure. That information becomes important in order to dump the fields, as we'll discuss in a moment. The Attr column is the type of storage for the field. In the example shown earlier, all the values were instance, which means they are instance data attributed to the class in memory. The value CLStatic indicates a field that has the ContextStaticAttribute class applied to it so the value is unique per context, which you can define by applying the ContextStaticAttribute to a field. I doubt any of you are using ContextStaticAttribute, but if you are, know that SOS does not support showing the values of those fields. A value of TLstatic indicates that the ThreadStaticAttribute is applied to the field so the field has thread local storage for all threads across all domains. The following is the partial output of a !do command on a TLStatic field: MT Field Offset Type VT Attr Value Name 749e0320 4000005 0 System.String 0 TLstatic threadLocalField >> Thread:Value 808:01d0d260 da0:01d0d260 << Below the field line are the different object instances for the threads in the system. In the example output, two different threads have instantiated this class, and the values after Thread:Value are the Windows native thread ID to the left of the colon and the memory address for the thread instance. If you wanted to look at the instance data for thread 0xDA0, you'd issue the command !do 01d0d260. You can guess that a value of static in the Attr column is a field marked as static in C# (or Shared in Visual Basic). There's another type of static value you'll see in the Attr column: shared. The shared display means that the field has the readonly/ ReadOnly keyword specified. A read-only static means that the value is unique across application domains. Thus, those fields, as does TLStatic, appear differently in the !do output: MT Field Offset Type VT Attr Value Name 749e0320 4000098 20 System.String 0 shared static Empty >> Domain:Value 00157950:74989600 1a632320:74989600 << In the output, two application domains have instances of this field. The first domain instance is at 00157950, and the second is at 1a632320. We'll discuss it more in a little bit, but you can use the !dumpdomain command to look at individual domain instances. The number following the domain is the instance in memory for that shared field, which you'll use the !do command on if you want to look at them. One issue I've found with seeing shared static fields is that SOS seems to display the shared value in the Attr column only if the assembly is in the GAC. If you are looking at an object instance that's not in the GAC, you'll see only static in the Attr column. In order to see the individual instances for each domain, you have to look for the type in the heap, dump each value in turn, and look for the different instance data for each domain. I'll discuss how to find and dump memory in the "Looking at the GC Heaps" section later in this chapter. The last column, Name, is the field name as you probably guessed, but the second-to-last column, Value, is the most interesting. If the field is a value type instance such as an Int32, you'll see the actual value of the field. In the FileNotFoundException I dumped out many pages ago, the _HResult field has a value of 2,147,024,894. Whereas the rest of WinDBG displays everything in hexadecimal by default, SOS shows all value types as decimal. If you are good at number base conversions in your head, you'd see that value is 0x80070002. If you have a photographic memory, you may remember that this Windows error code translates into "The system cannot find the file specified" and certainly fits with a FileNotFoundException. Because I certainly don't have any of those characteristics, I used the WinDBG extension command, !error, which converts a number into the error string with the command !error -0n2147024894. The 0n is necessary because the number is decimal, and as I mentioned back in the "Attaching to and Detaching from Processes in the Command Window" section, 0n is the ANSI numeric code for decimal. If the field is a reference type object, the number displayed in the Value column is the in-memory instance referenced by the field. Do you have any guess as to how you'll look at that value? It's with another call to !do, of course. Welcome to the fun world of viewing data in SOS. Previous versions of SOS had a wonderful -r option to !do that allowed you to set the recursion level so you could dump out multiple levels with minimal typing. If you're looking for a great project that will win you many plaudits in the development community, a WinDBG extension called !RecursiveDumpObject would be greatly appreciated. !DumpVC CommandIn your poking at instances with !do, you're going to run into a couple things that !do doesn't handle. The first I've already hinted at when I mentioned the VT column in the !do output. In the following dump, the VT column is set to one, which means that the field is a value type structure: 0:000> !do 01d01ab0 Name: ArraysAndValues.Program+DataCoordinate MethodTable: 1a5f1040 EEClass: 1a7235a0 Size: 32(0x20) bytes (C:\dev\Program\bin\Debug\ArraysAndValues.exe) Fields: MT Field Offset Type VT Attr Value Name 1a5f0fc0 4000004 8 ...rogram+Coordinate 1 instance 01d01ab8 coords The command !do 01d01ab8 spits out that the object is invalid. To see value types, you need to use the !dumpvc command. vc stands for value class. The !dumpvc command needs a little more information beyond the value instance in order to function. It also needs the MethodTable address before the instance address. The following shows the correct execution to dump the DataCoordinate instance. In the Type field, you see the + sign in the string . . .rogram+Coordinate. That indicates that Coordinate is a nested structure or class in ArraysAndValues.Program. 0:000> !dumpvc 1a5f0fc0 01d01ab8 Name: ArraysAndValues.Program+Coordinate MethodTable 1a5f0fc0 EEClass: 1a723648 Size: 32(0x20) bytes (C:\dev\Program\bin\Debug\ArraysAndValues.exe) Fields: MT Field Offset Type VT Attr Value Name 749ec9a0 4000001 0 System.Int32 0 instance 101 x 749ec9a0 4000002 4 System.Int32 0 instance 505 y 749ec9a0 4000003 8 System.Int32 0 instance 98 z !DumpArray CommandIf you're looking at a Generic.Dictionary instance, the private field, entries, contains the actual values in the Dictionary. Dumping an entries field instance shows the following: 0:000> !do 00b01e7c Name: System.Collections.Generic.Dictionary`2+Entry[[System.String, mscorlib],[System.String, mscorlib]][] MethodTable: 78cab650 EEClass: 78cab708 Size: 124(0x7c) bytes Array: Rank 1, Number of elements 7, Type VALUETYPE Element Type: System.Collections.Generic.Dictionary`2+Entry[[System.String, mscorlib],[System.String, mscorlib]] Fields: None The output tells us that this is an array and the type is of Dictionary.Entry<String, String> and there are seven elements in the array. That's nice, but it doesn't show us the elements. When confronted with an array, the !dumparray command saves us from manually having to look at memory to piece together what's in it: 0:000> !dumparray 00b01e7c Name: System.Collections.Generic.Dictionary`2+Entry[[System.String, mscorlib],[System.String, mscorlib]][] MethodTable: 78cab650 EEClass: 78cab708 Size: 124(0x7c) bytes Array: Rank 1, Number of elements 7, Type VALUETYPE Element Methodtable: 78cab788 [0] 00b01e84 [1] 00b01e94 [2] 00b01ea4 [3] 00b01eb4 [4] 00b01ec4 [5] 00b01ed4 [6] 00b01ee4 There are three very nice options to the !dumparray command. If you want to display the values of the array entries, specify -detail before the object address that will use the !do or !dumpvc commands as appropriate to show the elements. As with !do, !dumparray supports the -nofields switch to skip object field display. Also very useful are the -start and -length options, which take the index to start dumping at and the number of elements to dump, respectively. One word of caution is that the -start and -length options must be before -detail on the !dumparray command line or the values are ignored. The following shows dumping the detailed information from the third element in the array:
Looking at the GC HeapsAfter what seems like a million pages, we are finally up to the key reason for all the fun with WinDBG and SOS: getting information about what's where in the different GC heaps. For those of you who have used the version of SOS that comes with WinDBG for .NET 1.0 or 1.1 debugging, the bad news is that some of the commands have lost functionality in the .NET 2.0 version. You can still get at the same information, but you'll have to do more quick analysis and typing than before. Before you dive headfirst into SOS and the garbage-collected heap, I'm assuming that you have a good understanding of all the generations, finalization, and how .NET manages the heap. The best discussion is in Chapter 20 in Jeffrey Richter's CLR via C#, Second Edition (Microsoft Press, 2005). If you don't have Jeffrey's book, which you should, you can also read his articles "Garbage Collection: Automatic Memory Management in the Microsoft .NET Framework" and "Garbage Collection Part 2: Automatic Memory Management in the Microsoft .NET Framework" in the November and December 2000 issues respectively of MSDN Magazine (http://msdn.microsoft.com/msdnmag/issues/1100/gci/ and http://msdn.microsoft.com/msdnmag/issues/1200/gci2/). !FinalizeQueueThe first of the GC Heap functions I want to look at, !finalizequeue, helps you keep an eye on the objects that implement one of the most misused items in .NET: finalizers. The basic rule of finalizer usage is "don't, except to wrap only a native resource." Adding a finalizer to your class means that on a GC sweep, if there are no references to the object with a finalizer, the object is moved to the freachable queue and will be cleaned up on the next GC sweep. In essence, an object that has a finalizer and is not disposed of manually by the programmer is promoted to the next GC level automatically. Finalization is a normal part of .NET life, so it's normally not a problem. However, if you're misusing finalizable objects, say continually creating them in a tight loop without manually calling their Dispose or Close method when you're finished with them, you're putting pressure on the garbage collector. With all of .NET, every time a garbage collection triggers, all your .NET threads are suspended so you are getting less work done. Another problem you can encounter with finalizers is if your code is hanging the finalization thread. Keeping an eye on the objects in the finalize queue is extremely important. There's a lot of nice information produced by !finalizequeue. The key values are how many finalizable objects there are in each GC generation and how many objects are ready to be finalized. You also get a nice listing of all the finalizable types sorted in size order in all the garbage-collected generations. The following shows the output with some of the types removed for clarity: 0:007> !finalizequeue SyncBlocks to be cleaned up: 0 MTA Interfaces to be released: 0 STA Interfaces to be released: 0 ---------------------------------- generation 0 has 129 finalizable objects (002038b0->00203ab4) generation 1 has 50 finalizable objects (002037e8->002038b0) generation 2 has 0 finalizable objects (002037e8->002037e8) Ready for finalization 0 objects (00203ab4->00203ab4) Statistics: MT Count TotalSize Class Name 7b4946e0 1 16 System.Windows.Forms.Control+FontHandleWrapper 78c96338 1 16 System.LocalDataStoreSlot 7b48d344 1 20 System.Windows.Forms.ApplicationContext 7aeb317c 1 20 System.Drawing.FontFamily . . . 7aeb32a0 11 396 System.Drawing.Graphics 7b493be8 18 504 System.Windows.Forms.Internal.WindowsGraphics 7b494c68 15 600 System.Windows.Forms.PaintEventArgs 7b4f1504 15 1080 System.Windows.Forms.MenuItem Total 179 objects If you want to look at the particular objects in a generation that are finalizable or ready for finalization, you can use the WinDBG dd (Display DWORD) or dq (Display QWORD) commands for x86 or x64 respectively. In the example, there are 50 objects with finalizers in the Gen 1 heap, and the array containing those objects is (002037e8->002038b0). Because the output above is for x86, I'll use the command dd 002038b0 l 0n50. The lower case "l," which indicates the number of elements to dump, and since the !finalizequeue reports 50 items, I pass 0n50 to indicate the decimal number that I want. Remember, WinDBG assumes that all numbers are hexadecimal so specifying the 0n has WinDBG dump the length you expect. 0:007> dd 002037e8 l 0n50 002037e8 00b111e8 00af2118 00b11228 00b11380 . . . The first column displayed is the address, and the next four double words list the address in memory where instances of these objects are stored. Based on the last section, your Pavlovian response to seeing an object instance is to run !do on the address. !EEHeap CommandEven though the idea of .NET is to let developers stop worrying about memory, the number one concern of .NET developers is their memory usage. If you have a process whose memory usage is spiking, you want to know at a glance if it's the .NET side of your application or some of the native code you're using. Fortunately, the !eeheap command makes finding your .NET usage trivial. If you run !eeheap without any command-line options, you'll see the private heaps for each domain, the JIT compiler, modules, and the garbage-collected heaps. For developers working on the internals of .NET inside Microsoft, all of that information is valuable. The rest of us care only about the garbage-collected heap information. Fortunately, you can pass the -gc option to !eeheap to limit the output. 0:001> !eeheap -gc Number of GC Heaps: 1 generation 0 starts at 0x00b5c3f0 generation 1 starts at 0x00b1f87c generation 2 starts at 0x00af1000 ephemeral segment allocation context: (0x00bcdf24, 0x00bce3fc) segment begin allocated size 001b7b48 7a80b84c 7a82d1cc 0x00021980(137600) 001b7488 7b4729cc 7b4889c4 0x00015ff8(90104) 0018cc10 78c50df4 78c70520 0x0001f72c(128812) 00af0000 00af1000 00bce3fc 0x000dd3fc(906236) Large object heap starts at 0x01af1000 segment begin allocated size 01af0000 01af1000 01af6db0 0x00005db0(23984) Total Size 0x13a250(1286736) ------------------------------ GC Heap Size 0x13a250(1286736) There's a huge amount of information in that compact output. The most important is the very last line, which is the total size of all garbage-collected heaps in the process. In the example I've shown, there's only a single heap because the process is running with the workstation-optimized heap. If your process is running using the server heap, which you can enable by setting <gcServer enabled="true" /> in the <runtime> element of App.Config or Machine.Config, you'll see a heap listed for each processor on the machine. The GC Heap Size field will show the totals for all the heaps in the process. For each generational heap in the system, the !eeheap output shows you where generations 0, 1, and 2 all start in memory. A heap itself is broken up into various segments of memory that contain the actual objects themselves. As you'll see when we get to dumping the heap with !dumpheap, those addresses become critical to seeing very important information. After the generational heap segments comes the location of this heap's large object heap. When you allocate objects large than 85,000 bytes, instead of putting them in the regular garbage-collected heaps, they are put in the large object heap. That way you don't pay the cost of moving those large chunks of memory on memory coalescing. Although adjacent free blocks in this heap are coalesced, the runtime does not pack memory in the large object heap because it is in the generational heaps. Not packing the large object heap means that you can have situations in which your application is ending with an OutOfMemoryException, even though it looks as if you have plenty of memory left in the process address space. If given the right conditions for your large allocations, you can end up fragmenting the large object heap. In those cases, the OutOfMemoryException means that there's not a big enough free block in the large object heap. As with the generational heaps, the !dumpheap command lets you look at what's in the large object heap. !DumpHeap CommandWhile you might spend more time typing the !do command to look at objects, you'll spend much more time staring at the output of !dumpheap than any other command in SOS. As you can guess from the name, !dumpheap is all heap inspection. Unfortunately, the command has taken a step backwards from previous versions of .NET, and as you'll see, it takes much more work to get different pieces of information. You'll almost never want to run !dumpheap without a command-line option. If run by itself, !dumpheap will walk the entire garbage-collected heap dumping out the method table, the address, and size of each object. The final part of the output is the summary statistics showing the method table, count, total memory size, and name of each type. If you're looking at a minidump of a decent-sized ASP.NET application, !dumpheap might run long enough for you to go out for that cup of coffee and stay for a second or third cup. If you do accidentally issue a !dumpheap command or any other long-running command in WinDBG, pressing Ctrl+Break in WinDBG is supposed to stop the command as I explained earlier on. Unfortunately, the extension command architecture in WinDBG says that it's up to the command writer to occasionally ask if the user has asked for the command to abort. Although it might take awhile, !dumpheap will eventually respond to the Ctrl+Break key sequence. When first looking at a .NET heap, you'll want to use the -stat option with !dumpheap so you can see just the statistics about the heap. That will not dump each object, but you'll get the big picture of the minidump or live debugging session. Initially, you'll want to keep an eye on your classes and the types they contain when looking at the statistics. Don't be surprised that the largest objects reported by -stat are String instances or Object arrays. You're looking at the whole heap, so you are also looking at things created by the FCL or CLR in the heap. To get a look at just the strings on the heap, you can pass the -strings option to !dumpheap. This option is great because it shows the first 63 characters of each string so you can easily see what strings you're dealing with. The count column is undocumented, but it seems to show the number of string objects that are string interned. String interning is when multiple String objects point to the same actual value in memory, which helps save memory. 0:007> !dumpheap strings total 10521 objects Statistics: Count TotalSize String Value 1 32 "||" 1 32 "|2|" . . . 1 5544 "?? value : The object must be serialized into a byte array" 2 6288 "<PermissionSet versio" 1 9648 "<NamedPermissionSets><PermissionSet Total 10521 objects If you were ambitious enough to write a WinDBG extension that processed objects in the garbage-collected heap, the -short option to !dumpheap will save you a lot of parsing. All -short does is dump the address of the objects on the heapit dumps no other data. If you're in a job in which you're paid by the hour, what you'll want to do is dump out the entire heap and manually dump each address to find the individual large objects. The rest of us will want to use the -min switch to !dumpheap, which allows you to ask for the objects that meet a minimum size. In the following dump, I've asked for the objects of over 6,000 bytes. If you're interested only in the statistics, you can also add the -stat switch. 0:010> !dumpheap -min 6000 Address MT Size 78c54bdc 78c74cd4 9640 00af39c4 78c9b180 8208 01af3250 78c9b180 6960 total 3 objects Statistics: MT Count TotalSize Class Name 78c74cd4 1 9640 System.String 78c9b180 2 15168 System.Object[] Total 3 objects There's also a -max switch where you can tell !dumpheap to dump all objects up to a specific size. In reality, you won't be using -max by itself because you'll be wading through a ton of output. You can combine -min and -max to look at all objects that are between specific sizes. Although it would be trivial to dump the three objects in the last example, many times you'll get many objects no matter how you try to narrow the output with the -min and -max switches. The first column in the !dumpheap output shows the nearly ubiquitous method table for the object. The -mt switch takes the method table for an object so you can look just for specific values. Even more important, you can combine the -mt switch with the -min and -max switches to display just the key objects you're interested in seeing. 0:011> !dumpheap -min 6000 -mt 78c74cd4 Address MT Size 78c54bdc 78c74cd4 9640 total 1 objects Statistics: MT Count TotalSize Class Name 78c74cd4 1 9640 System.String Total 1 objects If all we had was the -mt option, that would be nice, but you have to admit that manually hunting down a type's method table can be tedious. Fortunately, the -type switch makes !dumpheap drastically easier to use. The -type switch takes a partial string that appears in the fully qualified type name of the objects you are interested in finding in the heap. If the name of one of your classes is ScatterGraph, you'd add - type ScatterGraph to see just those classes. The comparison is a case-sensitive String.Contains, so there are no wildcard lookups. However, because it's just a string comparison, you can take advantage of tricks such as - type [] to look for all the arrays in the process. The last two !dumpheap options are the starting and ending addresses of a particular segment of the heap to dump. A perfect use for these options is to look at the large object heap. As I mentioned in the !eeheap discussion, the last part of the display shows the beginning and ending addresses of each segment in the heap. In the following partial output, the only segment of the large object heap begins at 0x01af1000 and ends at 0x01af6db0: 0:11> !eeheap gc . . . Large object heap starts at 0x01af1000 segment begin allocated size 01af0000 01af1000 01af6db0 0x00005db0(23984) . . . But wait! I've just explained that only objects larger than 85,000 bytes are stored in the large objects heap, and you see that the size of the segment is even less than that. In this example, because the program has not explicitly allocated any large objects on the heap, we need to use the !dumpheap 01af1000 01af6db0 command to see by ourselves all the weird objects stored in this large object heap. 0:011> !dumpheap 01af1000 01af6db0 Address MT Size 01af1000 001514f8 16 Free 01af1010 78c9b180 4096 01af2010 001514f8 16 Free 01af2020 78c9b180 4096 01af3020 001514f8 16 Free 01af3030 78c9b180 528 01af3240 001514f8 16 Free 01af3250 78c9b180 6960 01af4d80 001514f8 16 Free 01af4d90 78c9b180 4096 01af5d90 001514f8 16 Free 01af5da0 78c9b180 4096 01af6da0 001514f8 16 Free total 13 objects Statistics: MT Count TotalSize Class Name 001514f8 7 112 Free 78c9b180 6 23872 System.Object[] Total 13 objects The first part of the large object heap always looks like the output above because the CLR needs to ensure that some key objects, such as the OutOfMemoryException, exist prior to usage. If a CLR allocation fails and the CLR has to then allocate garbage-collected space for the actual exception, some interesting and nasty things could happen. The most likely scenario if this were true is that the OutOfMemoryException allocation would fail, triggering another out-of-memory exception. At that point, depending on the implementation, the application would go into an infinite loop or simply disappear from memory. Neither scenario is very developer (or user) friendly. The other reason to put these must-have objects in the large object heap is that to allocate them in the normal garbage-collected heaps would mean they would start out in generation 0 but be promoted over time to generation 2. This would cause more work for the CLR and negatively affect the overall performance of your application. If you were paying attention during the discussion of !eeheap, you may be wondering why you see those small 16-byte free blocks when the smallest object that you are supposed to see in the large object heap is at least 85,000 bytes in size. Obviously, there's nothing you can poke in there that's ever going to fill those holes. Again, the start of the large object heap is a special area where the CLR tries to optimize. You'll notice that nearly all the object sizes are 4K, which is conveniently the page size for x86 and x64 versions of Windows. Your first large object appears after the last free block set up by the CLR. Since we're talking about free blocks, I wanted to mention that when looking at the normal garbage-collected heaps, you may see a few when you dump the full garbage-collected heap depending where you stop in the debugger. If you have numerous free blocks because of memory problems, especially pinned memory, which we'll talk about in the "!GCHandles Command" section later in this chapter, running !dumpheap will report the problem after the statistics section. In the example I've just shown, it was easy to see the complete large object heap because it was in a single segment. Depending on how many giant memory blobs you're allocating you will see situations, especially on computers running x64-based Windows versions, in which the large object heap will be spread across multiple segments as the following !eeheap -gc command shows. Since you can't specify multiple ranges to !dumpheap, you'll have to dump segments of the large object heap separately to see everything that's there. 0:005> !eeheap gc Number of GC Heaps: 1 generation 0 starts at 0x0000000001db9558 generation 1 starts at 0x0000000001da2068 . . . Large object heap starts at 0x0000000011d01000 segment begin allocated size 0000000011d00000 0000000011d01000 0000000019c3e310 0x0000000007f3d310(133419792) 000000001bae0000 000000001bae1000 00000000232e13a8 0x00000000078003a8(125830056) 0000000024870000 0000000024871000 000000002c071180 0x0000000007800180(125829504) 000000002c870000 000000002c871000 000000002d771030 0x0000000000f00030(15728688) Total Size 0x17ff3a08(402602504) ------------------------------ GC Heap Size 0x17ff3a08(402602504) It's relatively easy to look at the large object heap, but that's not the number-one question that any developer that's looking at a minidump with SOS is going to ask. The real question is what's in my Gen 2 heap. The garbage-collected heap is great, but if you hold on to objects too long, they make their way up to the part of the heap containing generation 2 objects, and your application starts chewing up more memory than necessary. As anyone who's looked at the # Gen x Collections performance counter (where x is 0, 1, or 2) from the .NET CLR Memory object knows, there are many order-of-magnitude generation 0 collections compared to generation 2 collections. If you have objects up in generation 2 that are ready to be collected because there are no more references in the application, they might be sitting there taking up space for quite a while before the CLR gets around to cleaning them up. It's vital that you have a solid idea of what's in your generation 2 memory so you can start looking at these memory-consumption problems. My biggest complaint about the .NET 2.0 SOS is that we lost a killer feature compared to previous versions. It used to be a simple matter of using the -gen switch to !dumpheap to ask it to display the objects that belongs into a particular generation in the heap. Now, we have to grind through memory manually. We should all be filing bugs against the CLR team to bring the -gen switch back, because as you'll see, to do the analysis manually is extremely tedious and error prone. To show you how to get at the generation 2 objects, I'll need to describe how the garbage collector lays out the generations in memory. Fortunately, our good friend, the !eeheap command, still shows us the key information: 0:011> !eeheap gc Number of GC Heaps: 1 generation 0 starts at 0x00b3e664 generation 1 starts at 0x00b20034 generation 2 starts at 0x00af1000 ephemeral segment allocation context: (0x00b83f94, 0x00b84670) segment begin allocated size 001b7b48 7a80b84c 7a82d1cc 0x00021980(137600) 001b7488 7b4729cc 7b4889c4 0x00015ff8(90104) 0018cc30 78c50df4 78c70520 0x0001f72c(128812) 00af0000 00af1000 00b84670 0x00093670(603760) Large object heap starts at 0x01af1000 segment begin allocated size 01af0000 01af1000 01af6db0 0x00005db0(23984) Total Size 0xf04c4(984260) ------------------------------ GC Heap Size 0xf04c4(984260) It's easy to see where the actual generations start in memory simply by looking at the first part of the !eeheap output. As you'll see in a moment, that's where you'll start dumping memory to look at objects in the particular heaps. However, when you look down in the ephemeral segment section, things look a little odder. In the example output, there are four separate segments utilized, though there can be any number of ephemeral segments. A segment is simply a chunk of memory. In a perfect world, the entire garbage-collected heap would be one contiguous piece of memory from generation 0 through to the large object heap. The reality is that other assemblies and allocated memory from native code get in the way. Consequently, the .NET runtime allocates the garbage-collected heap in segments and strings them together to make up the whole. The address ranges under the begin and allocated columns for each segment show each segment size. It's also interesting that the address ranges specified by the segments are diverse. The first three segments start at 0x7a80b84c, 0x7b4729cc, and 0x78c50df4, but the fourth starts at 0x00af1000. Only the last one seems to make sense because that's the starting address of generation 2. Before dissecting the generational heap at 0x00af1000, let's explore the content of the first three heaps by using !dumpheap. Since we have address ranges for the pieces of the heap, we can pass those ranges to !dumpheap to see what's in each of them. The first three heaps all show the same basic information, a single object type followed by a slew of strings: 0:011> !dumpheap -stat 78c50df4 78c70520 total 2020 objects Statistics: MT Count TotalSize Class Name 78c746a0 1 12 System.Object 78c74cd4 2019 128800 System.String Total 2020 objects There's obviously something special about these three segments in the heaps. To list the objects larger than 400 bytes stored into the heaps, I ran the command !dumpheap -min 400 78c50df4 78c70520 so I could dump a few of the strings to see what's in them. As I continued to look at a representative sampling of the strings on the heap, it shows that the strings on the heap are all the hard-coded strings used by the runtime itself. A perfect example is the full name of the System.Drawing assembly: System.Drawing.Imaging.Metafile, System.Drawing, Culture=neutral, PublicKeyToken= b03f5f7f11d50a3a That leaves the last segment as the interesting one. If you have a great spatial mind, you can probably picture exactly what the heap looks like, but the rest of us challenged folks can view Figure 6-8 to see what the heap looks like in memory. Figure 6-8. Last segment heap memory layout (not to scale)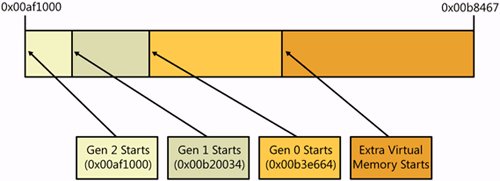 The fact that the last segment of the heap starts at the same address as the generation 2 part of the heap makes it easy to find because it ends at the start of generation 1. Thus to see what objects are in the generation 2, the command is !dumpheap -stat 0x00af1000 0x00b20034 using the values we've used all along. Using the values from the last heap segment to dump the content of the generation 2 does not show you all the objects in generation 2. All those string values needed by the CLR in the other segments reported by !eeheap are included in the generation 2 dump. However, for practical purposes, the part of the heap that you'll dump from the last segment for generation 2 contains all your objects in generation 2. The content of generation 1 is easy to see also because it starts at 0x00b20034 and runs up to the start of the generation 0 at 0x00b3e664. Unfortunately, there's no way to tell where the generation 0 part ends, but dumping out the address range from the start of the generation 0 to the end of the heap will show everything that's in there. The problem is that the object in the extra virtual memory area could be reported also but it's already freed memory. Fortunately, you'd look at generation 0 relatively rarely. What we've been looking at up to this point is a case in which you're running with the workstation heap, which has one heap for the whole process. If you're using the server implementation of heap management, which is anyone doing ASP.NET, and you're running on a multiple-CPU computer, your life just got much more interesting. Because there's one heap per CPU, your generation 2 heap is scattered across all the individual CPU heaps. The following partial output is from a four-CPU system, and you can get an idea of the work you'll have to do to get the content of generation 2: 0:011> !eeheap -gc Number of GC Heaps: 4 ------------------------------ Heap 0 (00000000001bc290) generation 0 starts at 0x0000000080018688 generation 1 starts at 0x0000000080018670 generation 2 starts at 0x000000007fff0068 ephemeral segment allocation context: none segment begin allocated size 000000000919b9f0 0000000079777868 00000000797ad410 0x0000000000035ba8(220072) 00000000091904c0 000000007adf52b8 000000007ae1f4d0 0x000000000002a218(172568) 000000000915a200 00000000749890a8 00000000749caf18 0x0000000000041e70(269936) 000000007fff0000 000000007fff0068 00000000800686a0 0x0000000000078638(493112) Large object heap starts at 0x000000017fff0068 segment begin allocated size 000000017fff0000 000000017fff0068 000000017fffd758 0x000000000000d6f0(55024) Heap Size 0x127958(1210712) ------------------------------ Heap 1 (00000000001bda50) generation 0 starts at 0x00000000bfff4ca0 generation 1 starts at 0x00000000bfff4ba0 generation 2 starts at 0x00000000bfff0068 ephemeral segment allocation context: none segment begin allocated size 00000000bfff0000 00000000bfff0068 00000000c004ecb8 0x000000000005ec50(388176) Large object heap starts at 0x000000018fff0068 segment begin allocated size 000000018fff0000 000000018fff0068 000000018fff0080 0x0000000000000018(24) Heap Size 0x5ec68(388200) ------------------------------ . . . ------------------------------ GC Heap Size 0x2d7930(2980144) For each heap in the system, you can use !dumpheap to look at each of the ranges, and you'll have to manually piece together the overall generation 2 heap. It's certainly doable; it's just very tedious. This is the one time you'll be sad about having that 16-CPU monster server. !GCRoot CommandAfter you've gotten a good idea as to what lies where in the various heaps, you'll want to look at individual objects to see what other objects are holding on to references to the key object. The term rooted is a synonym for referencing. If object A has a field of class B, the instance of B is said to be rooted to A, and A is rooted to the garbage-collected heap because you have a reference to the instance of A. That means that because A and B are rooted, neither object can be garbage collected. If you nulled the variable that held on to A, both A and B are available for garbage collection. The !gcroot command takes as its parameter the object address you want to check. The command first looks through all the objects in the garbage-collected heap to see if anything has a reference to that object. Second, it looks through handle references in the GCHandle table. When I get to the !GCHandles command, we'll discuss the GCHandle table in detail. Finally, it looks through the pointers on each of the stacks. One word of caution with the !gcroot command is that it can report false positives on the stack checking. For example, if you have an old address for an object, !gcroot can report what looks like valid data. If you suspect the output from !gcroot does not make sense because of potential stack issues, pass the !gcroot parameter -nostacks before the object address to see if that clears up the output. Otherwise, use !clrstack and !dumpheap to verify that the object truly exists. If an item on the stack references the object, you'll see output showing you the reference with the chain from the highest level down to the object itself. You'll also see the references to some of the intermediate values. I find it best to search for the object address in the output to skip over the partial chains by using Ctrl+F to bring up the Find dialog box in the Command window. 0:009> !gcroot 00b1f690 Note: Roots found on stacks may be false positives. Run "!help gcroot" for more info. ebx:Root:00b01c28(System.Windows.Forms.Application+ThreadContext) ->00b00b48(AnimatedAlgorithm.AnimatedAlgorithmForm) ->00b0e6c4(Bugslayer.SortDisplayControl.SorterControl) ->00b119dc(System.Collections.Hashtable) ->00b11b48(System.Collections.Hashtable+bucket[]) ->00b11a3c(NSort.BubbleSorter) ->00b1f6b4(Bugslayer.SortDisplayGraph.GraphSwapper) ->00b1f690(Bugslayer.SortDisplayGraph.SwapStateArgs) Scan Thread 0 OSTHread f5c Scan Thread 2 OSTHread 934 The output of !gcroot will end with the handle table references for domains in the process. If the display does not contain any references to handles, the object will be eligible for collection when the stack references go away. If the output shows the handle references, like the following output, the object has references that transcend stacks. The handle type displayed indicates the type of rooted memory. Table 6-3 shows the different codes and descriptions of the types of handles you'll see in the output.
0:009> !gcroot 00af1144 Note: Roots found on stacks may be false positives. Run "!help gcroot" for more info. Scan Thread 0 OSTHread f5 Scan Thread 2 OSTHread 934 Scan Thread 9 OSTHread ef0 DOMAIN(00147EE0):HANDLE(Strong):8d11e0:Root: 00af1144(System.Threading.ThreadAbortException) ->00b11a3c(NSort.BubbleSorter) !ObjSize CommandWhen I talked about the size reported by the !dumpheap command, the size displayed is the size of the object itself and not the total size of everything the particular object contains. To see all the memory held by an object, !objsize is your tool of choice. In the following output, the size of the main form itself is only 384 bytes, but the size of everything the form holds is 19,768 bytes: 0:011> !dumpheap -type Animated Address MT Size 00b00b48 02ca37bc 384 total 1 objects Statistics: MT Count TotalSize Class Name 02ca37bc 1 384 AnimatedAlgorithm.AnimatedAlgorithmForm Total 1 objects 0:011> !objsize 00b00b48 sizeof(00b00b48) = 19768 ( 0x4d38) bytes (AnimatedAlgorithm.AnimatedAlgorithmForm) What makes !objsize interesting is that if you execute the command without any parameter, you'll see the complete output of all the rooted objects in the process space. It's an incredibly convenient way to see the entire heap in one output. !GCHandles CommandMany developers are surprised to find out that you can leak .NET memory. In reality, it's not .NET leaking the memory. When you pass .NET memory to the native side of your application, the garbage collector has to keep track of the memory being passed through interop, thus holding a reference to the memory, like an internal root. If the native code fails to notify the .NET code that it's done with the memory, the reference to the managed memory means it will never be collected. Thus, you've got a memory leak in .NET. When .NET memory makes the journey over to the native side of your application, the internal reference to the memory is stored in a GCHandle structure from the System.Runtime.InteropServices namespace. The GCHandle structure is simply a wrapper around an IntPtr that holds the memory address. As you expect, the GCHandle structures are stored in a table, and if you could look through that table, you could see the types of interop memory you are using in your application. What would be even better is if there were a way to look through the addresses stored in each GCHandle structure to see if the memory referenced is still in use. What I've just described is exactly what the !gchandles command is all about. It walks that GCHandles table and tells you exactly what types of handles you have outstanding in addition to the current objects in the GCHandles tables. The default is show all the GCHandles for the entire process. If you're doing multiple domain development, you can pass the -perdomain handle to see the handles occurring from each domain. 0:011> !gchandles GC Handle Statistics: Strong Handles: 68 Pinned Handles: 7 Async Pinned Handles: 0 Ref Count Handles: 0 Weak Long Handles: 22 Weak Short Handles: 43 Other Handles: 0 Statistics: MT Count TotalSize Class Name 78c8e2c4 1 12 System.Security.Permissions.ReflectionPermission 78c77b9c 1 12 System.Security.Permissions.SecurityPermission 78c746a0 1 12 System.Object . . . 7b4f1504 15 1080 System.Windows.Forms.MenuItem 78c7ac68 34 1224 System.Security.PermissionSet 78c9b180 6 23872 System.Object[] Total 140 objects The first part of the !gchandles output is the most important because it shows you exactly what types of handles are outstanding. As you saw back in Table 6-3, different types of memory handles can put radically different pressure on the garbage collector. The most important handle type to notice is the pinned handles. Pinned handles are memory locations locked into physical locations in the garbage-collected heap. Because those locations are locked, the garbage collector must move around those locations when coalescing freed memory. This slows down the garbage collector tremendously, so it's extremely important to keep an eye on those pinned handles. !GCHandleLeaks CommandSeeing the dump of the GCHandles table is nice, but what's even nicer is seeing if any of the handle values stored in the table are missing in action. This is especially true if you're leaking pinned or strong handles. As you can see from the title of this section, the !gchandleleaks command takes care of that for you. To show you how a handle leak could occur, the following code snippet shows code that calls a native method that requires a pinned array in memory. At the bottom of the code, I don't call GCHandle.Free, and thus leak the array wrapped by the GCHandle variable. Granted, this is a contrived code, but I wanted to show you what a leaked GCHandle reference looks like in as short a sample as possible. // Allocate the managed array. int [] buffer = new int [ 1000 ]; // Pin the buffer in memory in preparation for passing it to native // code. GCHandle gch = GCHandle.Alloc ( buffer , GCHandleType.Pinned ); // Get the pinned buffer. IntPtr ptrToBuffer = Marshal. UnsafeAddrOfPinnedArrayElement ( buffer , 0 ); // Do the native enumeration. NativeMethods.FillAttachedDevices ( 1000 , (IntPtr)ptrToBuffer ); // Here I forget to remove the root that references the pinned buffer // with a call to gch.Free Before I get into the command itself, it's worth discussing how you could manually do the equivalent with just the existing WinDBG commands and if we had a command that would output the GCHandles table. Because each handle stored in the GCHandles table is a memory address, we could use the address with the WinDBG S (Search Memory) command to search all the memory in the process for that address. If the search does not find the address value, the odds are that the memory has been leaked. Instead of us doing all that manual typing until our fingers wear off to little nubs, the !gchandleleaks command does all the heavy lifting for us. As the output of !gchandleleaks warns you, the command's output can possibly be incorrect. The address you're looking for could possibly match junk or data in the address space, so the actual leaked reference wrapped by GCHandle won't be reported. Additionally, in the rare case when the native code is masking or changing the memory address values passed in by managed code, you can have false reports of leaked handles. The good news is that those two caveats are quite rare, so if you're seeing leaks reported by !gchandleleaks, you're almost certainly seeing real problems in your application. The first part of the !gchandleleaks output is the dump of the actual GCHandles table itself. Don't be alarmed if the number of handles reported by !gchandles and !gchandleleaks are different. The !gchandles command lists all types of handles, and the !gchandleleaks command reports only strong and pinned handle types. After the strong and pinned handle dump, the command starts showing you all the locations in memory where it found various handle values. Fortunately, !gchandleleaks properly listens for Ctrl+Break keystrokes to abort the command. If you do abort the command, ignore the leaked handle output because the command mistakenly reports all unfound handles as leaks. The last part of the !gchandles command is where all the action resides. That's the list of GCHandle structures referencing memory that wasn't found in the full memory scan: Didn't find 43 handles: 0000000001ac1678 0000000001ac1680 0000000001ac1688 0000000001ac1690 . . . . Each of the numbers listed is a leaked GCHandle structure. Because the GCHandle is a value type, you can be hard core and use the !name2ee command to look up the method table of the GCHandle structure. The easiest way to use the !name2ee command is to use the WinDBG syntax for module and address. You'll pass * as the module, the ubiquitous exclamation point (!), and the fully qualified class name: 0:000> !name2ee *!System.Runtime.InteropServices.GCHandle Module: 0000000074968000 (mscorlib.dll) Token: 0x00000000020004f8 MethodTable: 0000000074a322c8 EEClass: 0000000074b38cb8 Name: System.Runtime.InteropServices.GCHandle . . .With the method table in hand, the previously discussed !dumpvc will show you the data for the value type: 0:000> !dumpvc 0000000074a322c8 0000000001ac1678 Name: System.Runtime.InteropServices.GCHandle MethodTable 0000000074a322c8 EEClass: 0000000074b38cb8 Size: 24(0x18) bytes (C:\WINDOWS\assembly\GAC_64\mscorlib\2.0.0.0__b775c561934e089\mscorlib.dll) Fields: MT Field Offset Type VT Attr Value Name 749ece80 400195f 0 System.IntPtr 0 instance 285543080 m_handle . . .With the value of the m_handle field is the address of the object. Keep in mind that the !dumpvc and !dumpobj commands display their data in decimal form. Therefore, to dump the object held by the GCHandle structure, I need to prefix the value with 0n to indicate that it's a decimal number: 0:000> !do 0n285543080 Name: System.String MethodTable: 00000000749e0320 EEClass: 0000000074adf000 Size: 90(0x5a) bytes . . . If your eyes are starting to roll back in your head thinking about how tedious it will be to look at leaked GCHandle structures, you're not alone. Put on your native C++ thinking cap for a moment. Because the GCHandle structure just contains a single instance field, the object memory, we can reach directly into the GCHandle structure to see the wrapped object. The D (Display Memory) command lets us dump a memory address and display the data in any format known to humankind. Because my examples in this section were done on an x64 machine, I'll use DQ to display the data in quad words. On a 32-bit machine, you'd use DD to display in double word form. Because each value reported as leaked by !gchandleleaks is a single GCHandle structure, I'll use l 1 to display only the one object. 0:000> dq 0000000001ac1678 l 1 00000000 01ac1678 00000000 11050aa8 The first address that appears is the address I dumped, and the second is the value at that location. With the second address, I can pass it to !do to display the data. If you've leaked more than two handles, even this quicker way of looking at the objects is going to take you hours to get through looking at the actual objects. Way back in the "!DumpObj (!do) Command" section, I showed the hard way of looking at an individual field in an object by using the poi expression, which stands for pointer to integer. Because the GCHandle structure simply wraps the address, you can achieve the same thing by passing the address of the GCHandle structure in the poi wrapper to dereference the .NET object. 0:000> !do poi(0000000001ac1678) Name: System.String MethodTable: 00000000749e0320 EEClass: 0000000074adf000 Size: 90(0x5a) bytes Although I went through a bit of discussion tangential to the !gchandleleaks command, I thought it was a good chance to poke around at a few other commands and techniques that you'll need to know. The key point to remember when it comes to memory leaks in .NET is that if you are seeing the Private Bytes performance counter rising at the same rate as the # Bytes in All Heaps performance counter, you're most likely looking at managed memory being leaked by the native side of your application. !VerifyHeap CommandAlthough .NET 2.0 has added quite a bit of magic pixie dust to help detect heap corruptions when passing managed data to native code, there's still plenty of opportunity for the ugly head of a native code wild write to a pointer to ruin your day. If you're doing a good deal of interop and you suspect a problem in the managed heap, use !verifyheap to ensure that all the objects are in good shape. The !verifyheap command looks at each object on the heap and validates that its fields point to valid objects. If there are no problems on the heap, you'll see no output. If there are problems, you'll see output like the following: 0:007> !verifyheap -verify will only produce output if there are errors in the heap object 000000001105a7c0: bad member baadd00ddeadbeef at 000000001105a7c8 Object baadd00ddeadbeef has no generation object 000000001105a7c0: missing card_table entry for 000000001105a7c8 curr_object : 000000001105a7c0 Last good object: 000000001105a790 ---------------- The mention of -verify in the output got me a little curious. It seemed to me that any SOS operations dealing with the heap should be part of !dumpheap, so I passed the -verify option to !dumpheap and got the exact same output. Exceptions and BreakpointsNow that I've beaten the heap to death, let's turn to some commands that you'll use during live debugging. Although it will be rare that you'll be doing live debugging of production systems, it's nice to know these commands are available if you need them. What's even better is that these commands are drastically easier to use than what we had to do in .NET 1.1 to stop on exceptions or breakpoints. !StopOnException (!soe) and !PrintException (!pe) CommandsBack in the "Exceptions and Events" section, I discussed using sxe clr to stop on any .NET exception. Although that might be good enough for some general poking around, for faster debugging, you'll probably want more control over exactly what exception you stop on. Happily, the !soe command makes stopping on a specific exception trivial. When using !soe, you have to at least specify if the exception you want to stop on is a first-chance or second-chance exception. To specify that you'll want to stop on first-chance exceptions, you'll specify the wildly misnamed -create option before the fully qualified name of the exception. For second-chance exceptions, you'll specify -create2. After specifying the option and the fully qualified exception name, you'll need to specify a debugger pseudo register value. The documentation for !soe states that you can omit specifying the pseudo register, but I've found that !soe doesn't work correctly without the pseudo register specified. I've already mentioned two pseudo registers in this chapter, $csp, the call stack pointer, and $ra, the return address. WinDBG has many other pseudo registers that allow you to get specific information, such as $tid (Thread ID) without resorting to machine-dependent hacking. In addition to the special values, WinDBG offers twenty user-defined pseudo registers, $t0 to $t19, in which you can store any values you'd like. The r command allows you to store values into the pseudo registers. The following shows use of the !soe command to stop whenever an ArgumentNullException is thrown and use of pseudo register $t1 internally: 0:004> !soe -create System.ArgumentNullException 1 Breakpoint set My first reaction when I saw the text Breakpoint set was to execute a bl (Breakpoint List) command to view the breakpoint !soe set. If you do the same, you'll see that there's no actual breakpoint in the list. That had me wondering because if the !soe command wasn't setting a breakpoint, the only other way to cause a debuggee to stop in the debugger is through an event or exception. Running the sx command showed exactly how !soe did its magic: 0:000> sx ct - Create thread ignore . . . clr - CLR exception - break - not handled Command: "!soe System.ArgumentNullException 1; .if(@$t1==0) {g} .else {.echo 'System.ArgumentNullException hit'}" . . .The !soe magic turns out to be quite elegant. When you issue the !soe command, it executes the following command: sxe -c "!soe System.ArgumentNullException 1; .if(@$t1==0) {g} .else {.echo 'System.ArgumentNullException hit'}" clrEvery time a .NET exception occurs, the specified command executes. First, !soe looks to see if the exception is of the specified type. If so, it will set the user-defined pseudo register to 1. The .if and .else tokens are part of the Debugger Command Programs functionality in which you can write rudimentary programs. See the WinDBG documentation for more information on how to use them. If you're thinking that there might be some limitations with the !soe command because it takes over the .NET exception event with a single conditional, you're right. If you want to stop on multiple exceptions that are derived from a common base class, you can use the !soe command, which handles that with the -derived option. For example, if you wanted to stop on any exceptions derived from System.TypeLoadException, which is the base class for both System.DllNotFound-Exception and System.EntryPointNotFoundException, you'd type the command: !soe -derived -create System.TypeLoadException 2 For stopping on multiple exceptions that are not related through inheritance, you need to spend quality time with the sxe command. Fortunately, as you can see from the example I showed earlier, it's mainly an exercise in getting the conditional command worked out. The following command has two !soe commands monitoring exceptions and reporting the results into pseudo registers $t5 and $t6. The two extra @ signs at the beginning of the .if conditional force WinDBG to use the C++ expression evaluator for the condition. The default expression evaluator is the MASM (Microsoft Assembler), so I need to do this to force the correct evaluation. Note that I broke the following command for readability. When you type it into the WinDBG Command window, you'd type it on one line. sxe -c "!soe System.IO.FileNotFoundException 5; !soe System.NotImplementedException 6; .if @@((@$t5==0) && (@$t6==0)) {g} .else {.echo 'My exception hit!' }" clrIf you've stopped on an exception or are debugging a minidump, you can turn to the !pe command to take a look at the detail of the exception. Run by itself, !pe shows the last exception in the current thread, just as the !threads command does. If you have the address of an exception object, you can pass that to !pe. In order to see inner exceptions also, use the -nested option. The most important piece of information that !pe shows you is the call stack. Because the call stack inside an exception is a byte array, without the !pe command, there's no way of figuring out where the exception originated. This new functionality is a huge boost to quickly finding problems. 0:000> !pe Exception object: 01d04030 Exception type: System.NullReferenceException Message: Object reference not set to an instance of an object. InnerException: <none> StackTrace (generated): SP IP Function 0012EF50 1A7503EE DieAway.Program.Fum(System.Text.StringBuilder) 0012EFB0 1A75034B DieAway.Program.Fo(System.Text.StringBuilder) 0012EFE0 1A7502DB DieAway.Program.Fi(System.Text.StringBuilder) 0012F010 1A75026B DieAway.Program.Fee(System.Text.StringBuilder) 0012F040 1A7501FC DieAway.Program.Main(System.String[]) StackTraceString: <none> HResult: 80004003 !BPMD CommandCompared to prior versions of SOS, the .NET 2.0 version offers drastically easier support for setting breakpoints. Now there's a single command, !bpmd, that does all the work and doesn't require you to worry about whether the method is jitted or not. The command relies on the method descriptor of the particular method, but you don't have to worry about hunting it down; the !bpmd command even takes care of that for you if you know the module name that contains the method and the name of the method itself. 0:006> !bpmd nsort.dll NSort.QuickSorter.Sort Found 2 methods... MethodDesc = 00000000025eada0 MethodDesc = 00000000025eadb0 Adding pending breakpoints... 0:006> !bpmd nsort.dll NSort.HeapSort.Sort Found 1 methods... MethodDesc = 00000000025ea830 Method is jitted, placing breakpoint at code addr 0000000002b5cc60 Both of the commands executed above set breakpoints; the difference to the output depends on if the method is jitted or not. If the method(s) are not jitted, you'll see output like the first part where !bpmd will be monitoring when jitting occurs, and when the particular method is jitted, the !bpmd command will set a ba (Break on Acccess) command on the first instruction of the method. If the method is already jitted, the ba breakpoint will be directly set on the method's jitted location. The !bpmd command is somewhat of a sledgehammer approach. In the output above, you see that setting a breakpoint on my NSort.QuickSort.Sort method results in two methods found. The !bpmd command simply does a string lookup, and if there are overloads, it sets breakpoints on all overloaded methods. As does the !soe command, !bpmd works its magic through the debugger eventsthe CLR Notification Exception in particular. As I mentioned earlier, the CLR Notification exceptions are undocumented and don't work when used directly, but !bpmd must have the special secret to make them work. 0:006> sx . . . clrn - CLR notification exception - break handled Command: "!bpmd -notification;g" . . . Running the application and executing a method that's not jitted will result in output like the following: (f3c.bc0): CLR notification exception - code e0444143 (first chance) JITTED NSort!NSort.QuickSorter.Sort(System.Collections.IList) Setting breakpoint: bp 02B5A9E0 This is where the !bpmd command is making the ba breakpoints on the method's jitted location so that you'll stop whenever the method is executed. You can verify that the breakpoints are set by using the bl command: 0:009> bl 0 e 00000000 02b5a9e0 0001 (0001) 0:**** 1 e 00000000 02b5aab0 0001 (0001) 0:**** 2 e 00000000 02b5cc60 0001 (0001) 0:**** Knowing the module and qualified method name make !bpmd a snap to use, but most of the time developers are lucky to have a vague notion of the name. One of these days there will be a pill to give us all photographic memories. Until them, I'll show you the easy trick for finding the method you want to break on. To start, run the !dumpheap command to get the method tables of the particular class you want. A method table, along with the class data structure, are what describe an object in memory. Once you have the method table, it's easy to look up the method descriptor for the method. Let's look at a case in which I want to set a breakpoint on another of the sorting algorithms I've been using in this section: 0:009> !dumpheap -stat -type NSort total 43 objects Statistics: MT Count TotalSize Class Name 00000000025eb500 1 32 NSort.ShellSort 00000000025eb240 1 32 NSort.ShakerSort 00000000025eb100 1 32 NSort.SelectionSort 00000000025eafc0 1 32 NSort.QuickSortWithBubbleSort 00000000025eae40 1 32 NSort.QuickSorter 00000000025eacc0 1 32 NSort.OddEvenTransportSorter 00000000025eab80 1 32 NSort.InsertionSort 00000000025eaa40 1 32 NSort.InPlaceMergeSort 00000000025ea8c0 1 32 NSort.HeapSort 00000000025ea740 1 32 NSort.FastQuickSorter 00000000025ea5c0 1 32 NSort.DoubleStorageMergeSort 00000000025ea480 1 32 NSort.ComboSort11 00000000025ea340 1 32 NSort.BubbleSorter 00000000025ea200 1 32 NSort.BiDirectionalBubbleSort 00000000025eb3c0 1 48 NSort.ShearSorter 00000000025ec000 13 312 NSort.DefaultSwap 00000000025ebd80 15 360 NSort.ComparableComparer Total 43 objects Taking advantage of the !dumpheap -stat and -type options quickly gets me the method tables for all classes that have NSort in the name. Armed with a method table, I can use the SOS metadata walking command !dumpmt to display the information about the particular method table. In order to get the method descriptors, which are the metadata information about an individual method, I'll make sure to pass the -md option to !dumpmt because they are not shown by default: 0:009> !dumpmt -md 00000000025eaa40 EEClass: 000000000261e378 Module: 00000000026c6a60 Name: NSort.InPlaceMergeSort mdToken: 0200000d (C:\dev\3Book\Disk\Chapter Examples\Chapter 6\Debug\NSort.DLL) BaseSize: 0x20 ComponentSize: 0x0 Number of IFaces in IFaceMap: 1 Slots in VTable: 8 -------------------------------------- MethodDesc Table Entry MethodDesc JIT Name 00000000744a03c0 0000000074c24300 PreJIT System.Object.ToString() 0000000074574460 0000000074c24310 PreJIT System.Object. Equals(System.Object) 000000007438cec0 0000000074c24340 PreJIT System.Object.GetHashCode() 0000000074234130 0000000074c24350 PreJIT System.Object.Finalize() 0000000002b53d30 00000000025ea9b0 NONE NSort.InPlaceMergeSort. Sort(System.Collections.IList) 0000000002b56a00 00000000025ea990 JIT NSort.InPlaceMergeSort..ctor() 0000000002b53d28 00000000025ea9a0 NONE NSort.InPlaceMergeSort. .ctor(System.Collections.IComparer, NSort.ISwap) 0000000002b53d38 00000000025ea9c0 NONE NSort.InPlaceMergeSort.Sort (System.Collections.IList, Int32, Int32) The key column in the output above is the MethodDesc. If you know the method descriptor, you can use the -md option to the !bpmd command to bypass the module and qualified name completely. In the following example, I'm setting the breakpoint, but the method has not been jitted yet. If the method had been jitted, the !bpmd command would report that it was setting the actual breakpoints. 0:006> !bpmd md 00000000025ea9b0 Adding pending breakpoints... DeadlocksOverall, the .NET Framework makes handling synchronization issues very easy with the Thread.Monitor class as sync blocks. Of course, there's no protection against you screwing up your synchronization and deadlocking your application completely. If the Framework had foolproof synchronization, you certainly wouldn't be reading this book nor would we all have jobs. !SyncBlk CommandThe critical section of the managed world is a SyncBlock. Any time you're using the lock/ SyncLock keyword or Monitor.Enter, you're using a SyncBlock. If you suspect that you're deadlocked on a SyncBlock, you simply need to run the !syncblk command to see which ones are being held. 0:021> !syncblk Index SyncBlock MonitorHeld Recursion Owning Thread Info SyncBlock Owner 23 001b8bec 3 1 001f8298 d88 9 00b33eb0 System.Object 24 001b8c1c 21 1 001fb130 330 15 00b33fbc System.Byte[] ----------------------------- Total 34 CCW 0 RCW 0 ComClassFactory 0 Free 0 The data displayed by the !synblk command is a little convoluted, so let me discuss exactly what's in each field. The Index field is the particular SyncBlock index field for the object indicating the particular SyncBlock from the SyncBlock cache in use. You can see all the values in the SyncBlock cache by adding the -all parameter to !syncblk. If you want to look at a particular index, you can pass that integer value as a parameter to !syncblk also. The SyncBlock field is the address of the actual SyncBlock in the SyncBlock cache. Because a SyncBlock is not a .NET object, you can't use !do to dump it. If you're really curious, you can use dd or dq to look at the address, and you'll be looking at the next three fields, so it's not so exciting. The MonitorHeld field is undocumented. The Recursion field indicates how many times the thread has acquired the particular SyncBlock. Keeping an eye on this field can help you when doing the code inspection to match up acquisitions and releases. The Owning Thread Info field shows three different pieces of information. The first is the thread object itself and is the same value shown in the ThreadOBJ field in the !threads command. The hexadecimal second number is the Windows thread ID, and the last number is the WinDBG thread number. The final column is the most important because it shows the object address and type being used for synchronization. As with any time you have an object address, you can pass the address to !do to look at it. The key to remember is that this is not the object that the thread is deadlocked on but the object that is owned by the thread. The thread is deadlocked because it's trying to acquire a different object. It's great that the !syncblk command can show you which threads are currently holding SyncBlocks, but you're going to have to do a little exploration to figure out exactly which objects are being held by each thread. The digging isn't too hard and ties together various SOS commands. My program has run and seems to have encountered a deadlockthe application isn't responding. After attaching WinDBG and loading SOS, the first command to run is !syncblk to take a look to see if there are any potential blockages: 0:021> !syncblk Index SyncBlock MonitorHeld Recursion Owning Thread Info SyncBlock Owner 33 001b75a4 21 1 001f3dc0 204 10 012b7810 System.Byte[] 34 001b75d4 3 1 001dfee0 9c4 9 012b7704 System.Object ----------------------------- . . . Threads 9 and 10 are both holding locks, so I'll switch over to thread 9 with ~9s and issue !clrstack to see where the managed code is sitting: 0:009> !clrstack OS Thread Id: 0x9c4 (9) ESP EIP 03f7f6c0 7c90eb94 [GCFrame: 03f7f6c0] 03f7f7f8 7c90eb94 [HelperMethodFrame: 03f7f7f8] System.Threading.Monitor.Enter(System.Object) 03f7f84c 00d91538 ThreadsDemo.MonitorBad.WriterFunc() 03f7f8b4 793d7a7b System.Threading.ThreadHelper. ThreadStart_Context(System.Object) 03f7f8bc 793683dd System.Threading.ExecutionContext. Run(System.Threading.ExecutionContext, System.Threading.ContextCallback, System.Object) 03f7f8d4 793d7b5c System.Threading.ThreadHelper.ThreadStart() 03f7faf8 79e88f63 [GCFrame: 03f7faf8] The x86 !clrstack command shows that the last managed method called is Monitor.Enter, so the odds are good that this thread is waiting for a SyncBlock. However, the thread could have just made the call to Monitor.Enter and may not have processed the actual blocking code, so to verify that I'm in a lock, the native stack walk command, kP, will show that there are WaitForMultipleObject-type native methods on the top of the stack. Further up the stack, you see MScorwks.dll methods that have lock and wait in their names, so it's easy to see what's going on: 0:009> kP ChildEBP RetAddr 03f7f430 7c90e9ab ntdll!KiFastSystemCallRet 03f7f434 7c8094e2 ntdll!ZwWaitForMultipleObjects+0xc 03f7f4d0 79f8ead4 KERNEL32!WaitForMultipleObjectsEx+0x12c 03f7f538 79f17522 mscorwks!WaitForMultipleObjectsEx_SO_TOLERANT+0x6f 03f7f558 79f17493 mscorwks!Thread::DoAppropriateAptStateWait+0x3c 03f7f5dc 79f1732f mscorwks!Thread::DoAppropriateWaitWorker+0x144 03f7f62c 79f8ea4d mscorwks!Thread::DoAppropriateWait+0x40 03f7f688 79e77f50 mscorwks!CLREvent::WaitEx+0xf7 03f7f698 7a0fd9c3 mscorwks!CLREvent::Wait+0x17 03f7f724 7a0fdbbf mscorwks!AwareLock::EnterEpilog+0x94 03f7f740 7a0fdd2a mscorwks!AwareLock::Enter+0x61 03f7f7a4 7a094352 mscorwks!AwareLock::Contention+0x16c 03f7f844 00d91538 mscorwks!JITutil_MonContention+0xa3 WARNING: Frame IP not in any known module. Following frames may be wrong. 03f7f8ac 793d7a7b 0xd91538 . . . I do like the name WaitForMultipleObjectsEx_SO_TOLERANT. The !syncblk output told us that thread 9 is waiting on a System.Object. From the managed stack, the MonitorBad.WriterFunc method is the one that's currently acquired a particular System.Object. That doesn't tell us the exact object the thread has deadlocked on. With a simple example like this one, you can probably deduce through simple code inspection the deadlock reason; it's much more difficult if you have many threads and synchronization objects in use. What we need to now look for is the exact object address being passed to Monitor.Enter so we can see what this thread is attempting to acquire. If you try the !clrstack command with the -a option, as I described earlier, you'll see that you won't get the object address that way. To see the objects on the stack, run the !dso command. The good news is that because the thread is blocked in the call to Monitor.Enter, the last object on the managed stack will be the actual parameter passed. 0:009> !dso OS Thread Id: 0x9c4 (9) ESP/REG Object Name ecx 012bc940 System.Globalization.GregorianCalendar 03f7f6f8 012b7810 System.Byte[] 03f7f790 012b7810 System.Byte[] 03f7f7bc 012b83c0 System.Threading.ContextCallback 03f7f84c 012b7810 System.Byte[] 03f7f850 012b7704 System.Object 03f7f854 012b76e4 ThreadsDemo.MonitorBad 03f7f88c 012b7e10 System.Threading.ThreadHelper 03f7f898 012b7e10 System.Threading.ThreadHelperAs you can see, the System.Byte[] at 0x012b7810 is at the top of the stack, so that's the object passed to Monitor.Enter. By running the !syncblk command again, you can see that that's the object held by thread 10: 0:009> !syncblk Index SyncBlock MonitorHeld Recursion Owning Thread Info SyncBlock Owner 33 001b75a4 21 1 001f3dc0 204 10 012b7810 System.Byte[] 34 001b75d4 3 1 001dfee0 9c4 9 012b7704 System.Object ----------------------------- . . .We've established that thread 9 is waiting for the SyncBlock for the System.Byte[] that thread 10 owns, so we know what one side of the deadlock is. If I repeated the same steps for thread 10, we'd see that thread 9 owns the SyncBlock thread 10 is waiting for. If you haven't guessed, I contrived this example by having thread 9 acquire the SyncBlocks in A and B order, whereas thread 10 acquires them in B and A order. If the SyncBlock deadlock is occurring from objects in the same class, it's easy enough to see that the managed call stacks on each thread will have different methods from the class making the call to Monitor.Enter. A code inspection at that point will probably show you the problem. If the deadlocks are happening because of different classes, you may want to look up the particular field names to make it easier for the code inspection. In that case, you'll need to find the object of the class holding the field, which is what the !gcroot command is for. To see what class is referencing the object at 0x012b7810, I'll issue the following command: 0:009> !gcroot -nostacks 012b7810 DOMAIN(0014BD98):HANDLE(WeakLn):8e1028:Root:012b7cb4( System.Windows.Forms.NativeMethods+WndProc)-> 012b7a3c(System.Windows.Forms.Timer+TimerNativeWindow)-> 01281b88(System.Windows.Forms.Timer)-> 0128a408(System.EventHandler)-> 0128079c(ThreadsDemo.MainForm)-> 012b76e4(ThreadsDemo.MonitorBad)-> 012b7810(System.Byte[]) As you can see, the object at address 0x012b7810 is held by the class instance ThreadsDemo.MonitorBad at 012b76e4. Our good friend, the !do command, will dump out that instance and give us the field name for System.Byte[]. 0:009> !do 012b76e4 Name: ThreadsDemo.MonitorBad MethodTable: 00907974 EEClass: 00da1878 Size: 32(0x20) bytes (C:\Dev\Presentations\MSFT\DotNet\Demos-2005\Debug\ThreadsDemo.exe) Fields: MT Field Offset Type VT Attr Value Name 7910f73c 4000012 4 System.Random 0 instance 012b7710 rng 79124418 4000013 8 System.Byte[] 0 instance 012b7810 buffer 790fb238 4000014 c ....Threading.Thread 0 instance 012b7ddc writer 79124228 4000015 10 System.Object[] 0 instance 012b7880 readers 0090704c 4000016 14 ...adsDemo.Signaller 0 instance 012b76b8 sig 790f9c18 4000017 18 System.Object 0 instance 012b7704 synchObjTo look for SyncBlock deadlocks on an x64 machine is nearly as simple, but there's a small twist. In some cases, the x64 !clrstack command won't always show you the Monitor.Enter call at the top of the stack as it does in the x86 !clrstack version. The following shows the same deadlocked thread I demonstrated, but on an x64 machine: 0:004> !clrstack OS Thread Id: 0x84c (4) Child-SP RetAddr Call Site 00000000042bf3e0 00000642782e595e ThreadsDemo.MonitorBad.WriterFunc() 00000000042bf4c0 00000642782e91af System.Threading.ExecutionContext.Run( System.Threading.ExecutionContext, System.Threading.ContextCallback, System.Object) 00000000042bf510 000006427f6688d2 System.Threading.ThreadHelper. ThreadStart() To double-check that the thread is blocked, use the kP command to see if the top of the stack contains calls to the native Wait* functions. 0:004> kP Child-SP RetAddr Call Site 00000000 042bec28 00000000 77d6cfbb ntdll!ZwWaitForMultipleObjects+0xa 00000000 042bec30 00000642 7f587fb1 KERNEL32!WaitForMultipleObjectsEx+0x1cf 00000000 042bed50 00000642 7f584e61 mscorwks! WaitForMultipleObjectsEx_SO_TOLERANT+0xc1 00000000 042bedf0 00000642 7f46b449 mscorwks! Thread::DoAppropriateAptStateWait+0x41 00000000 042bee50 00000642 7f56beb4 mscorwks! Thread::DoAppropriateWaitWorker+0x195 00000000 042bef50 00000642 7f496ab7 mscorwks!Thread::DoAppropriateWait+0x5c 00000000 042befc0 00000642 7f5977dd mscorwks!CLREvent::WaitEx+0xbf 00000000 042bf070 00000642 7f5d02ce mscorwks!AwareLock::EnterEpilog+0xc9 00000000 042bf140 00000642 7f548857 mscorwks!AwareLock::Enter+0x72 00000000 042bf170 00000642 7f5b7d35 mscorwks!AwareLock::Contention+0x1e7 00000000 042bf230 00000642 80154765 mscorwks!JITutil_MonContention+0xf1 00000000 042bf3e0 00000642 782e595e 0x642 80154765 00000000 042bf4c0 00000642 782e91af mscorlib_ni+0x2e595e 00000000 042bf510 00000642 7f6688d2 mscorlib_ni+0x2e91af . . . I'm please to see that WaitForMultipleObjectsEx_SO_TOLERANT is cross platform. Since I'm talking about deadlocks, I should show you the quick tricks to finding deadlocks on Windows handle-based objects, such as mutexes and events. Windows Kernel Handle DeadlocksAs you've seen, poking at SyncBlock deadlocks isn't too bad at all. Fortunately, looking for deadlocks on window handles is not that much more difficult. If you believe you're looking at a handle-based deadlock, the first thing you'll want to run is !eestack -ee. You might remember from the "Managed Call Stacks" section that it is the single command that will walk all the managed stacks in your application. After the output is done, search for any threads containing WaitHandle.Wait* at the top of the stack. Those threads are the ones that are blocked while attempting to acquire a handle-based Windows kernel resource. If you have only two or three threads waiting for an object, you can switch to each of those threads and use !dso command to look at the objects on the stack for the particular threads. For those many threaded reader/writer situations, you can run ~*e!dso to execute !dso on all the threads in the application. You're looking for the first item listed to be a SafeHandles.SafeWaitHandle object because that contains the Windows kernel handle you're blocking on. Looking up the list of objects will show the particular WaitHandle-derived object your code is accessing. If you followed the advice I gave back in the !handle section of always naming your handle values, you can take either the SafeHandle-derived or WaitHandle-derived object and dump it with !do. Either one will show the handle field, which is the native Windows kernel handle that's blocked. As shown next, you can pass the handle value to !handle to see exactly which handle it is. Note the 0n on the handle value passed to !handle. That's there because the !do shows the values as decimal, and the default radix is hexadecimal, so I have to be specific. 0:021> !do 00b40d58 Name: Microsoft.Win32.SafeHandles.SafeWaitHandle MethodTable: 78c8725c EEClass: 78c871f8 Size: 20(0x14) bytes (C:\WINDOWS\assembly\GAC_32\mscorlib\2.0.0.0__b77a5c56194e089\mscorlib.dll) Fields: MT Field Offset Type VT Attr Value Name 78c78208 40005b2 4 System.IntPtr 0 instance 1208 handle 78c78d60 40005b3 8 System.Int32 0 instance 44 _state 78c81164 40005b4 c System.Boolean 0 instance 1 _ownsHandle 78c81164 40005b5 d System.Boolean 0 instance 1 _fullyInitialized 0:021> !handle 0n1208 f Handle 4b8 Type Mutant Attributes 0 GrantedAccess 0x1f0001: Delete,ReadControl,WriteDac,WriteOwner,Synch QueryState HandleCount 2 PointerCount 14 Name \BaseNamedObjects\Mutex Numero Dos Object Specific Information Mutex is Owned Other SOS CommandsIn this section, I want to cover a few of the other commands that you'll find useful in some situations. As I discussed at the beginning of the SOS section, you'll want to keep an eye on the exports for SOS.dll to see if other interesting commands show up. Some will probably be documented in various Microsoft employee blogs, but finding them on your own is always a great first step. !DumpIL CommandFor those of you having a party with the System.Reflection.Emit and doing dynamic intermediate language (IL) on the fly, seeing what exactly is happening in your generated code is sometimes impossible. Although you can grind through the byte codes, manually decoding each one with the ECMA specification document, you probably have better things to do with your time. Of course, if you're paid by the hour, that's an excellent exercise to make quite a bit of money. To see the IL at a glance, you need just to pass either the address of the DynamicMethod object or the method descriptor of the object. !dumpil was added by the SOS team for viewing dynamic IL, but it also works perfectly well on any method descriptor. The following example shows a dynamic method that calls Console.WriteLine and returns the value of the second parameter passed in: 0:000> !dumpheap -type DynamicMethod Address MT Size 012843e0 79183fa8 52 012846ac 791841b0 32 total 2 objects Statistics: MT Count TotalSize Class Name 791841b0 1 32 System.Reflection.Emit. DynamicMethod+RTDynamicMethod 79183fa8 1 52 System.Reflection.Emit.DynamicMethod Total 2 objects 0:000> !dumpil 012843e0 This is dynamic IL. Exception info is not reported at this time. If a token is unresolved, run "!do <addr>" on the addr given in parenthesis. You can also look at the token table yourself, by running "!DumpArray 012864a0". IL_0000: ldarg.0 IL_0001: call a000002 (01286520) IL_0006: ldarg.1 IL_0007: ret 0:000> !do 01286520 Name: System.Reflection.Emit.VarArgMethod MethodTable: 79183f58 EEClass: 79221bfc Size: 16(0x10) bytes (C:\WINDOWS\assembly\GAC_32\mscorlib\. . .\mscorlib.dll) Fields: MT Field Offset Type VT Attr Value Name 79101a20 40024f2 4 ...ection.MethodInfo 0 instance 01284c60 m_method 79119b10 40024f3 8 ...t.SignatureHelper 0 instance 012864d4 m_signature !SaveModule CommandThe !dumpil command is great for looking at the IL itself, but sometimes you need a little more. One of my favorite commands in SOS is the !savemodule command. From the name, you can guess that it has something to do with saving and modules. In other words, the !savemodule command will write the complete assembly out from debugger. What's even better is that !savemodule works with live debugging in addition to minidumps. The command takes two parameters: the base address of the module, and the file name to save to. The extra special part of !savemodule is that it works for both .NET binaries and native binaries. In the following example, I'm showing the two modules I'm going to save. The first is a .NET module, and the second is the all important Kernel32.dll. After the lm commands, I'm executing the !savemodules for each one: 0:000> lm a 11000000 start end module name 11000000 11010000 AnimatedAlgorithm C (private pdb symbols) C:\Dev\Debug\AnimatedAlgorithm.pdb 0:000> lm a 7c800000 start end module name 7c800000 7c8f4000 KERNEL32 (private pdb symbols) c:\Symbols\ \kernel32.pdb\BCE87...542\kernel32.pdb 0:000> !savemodule11000000 foo.exe 3 sections in file section 0 - VA=2000, VASize=8aa4, FileAddr=1000, FileSize=9000 section 1 - VA=c000, VASize=3c8, FileAddr=a000, FileSize=1000 section 2 - VA=e000, VASize=c, FileAddr=b000, FileSize=1000 0:000> !savemodule7c800000 x.dll 4 sections in file section 0 - VA=1000, VASize=81fb5, FileAddr=400, FileSize=82000 section 1 - VA=83000, VASize=43a0, FileAddr=82400, FileSize=2400 section 2 - VA=88000, VASize=65ee8, FileAddr=84800, FileSize=66000 section 3 - VA=ee000, VASize=5bdc, FileAddr=ea800, FileSize=5c00 Although that output is surely thrilling, the real excitement begins when you look at the files on disk, which are written to the directory where you started WinDBG from. The file size for my AnimatedAlgorithm.exe is 49,152 bytes, and the Foo.exe I saved with the !savemodule command is the exact same size. Of course, my immediate thought the first time I ever executed the !savemodule command was to run the saved module. Unfortunately, on Win64 systems, the error is "foo.exe is not a valid Win32 application", and on Win32 systems, the error is "The application failed to initialize properly (0xc000007b). Click on OK to terminate the application." The same errors occur if you try to load the native saved binary as well. At this point, you're probably wondering what all the excitement is about the !savemodule command. Although you can't run the .NET saved module, you can load it into Lutz Roeder's amazing .NET Reflector, which I discussed earlier in the book. Since .NET Reflector has the amazing decompiler, you can look at the decompilation of that module. This is a huge boon to debugging if you have a minidump from a client site that's using a different version of a third-party component that you tested against and you don't have that component's source code. It also can save your job if you've shipped a binary and you've lost the source code to that version. Although there aren't any decompilers for native code, you can disassemble native modules written by the !savemodules command. If you installed the C++ parts of Visual Studio, you have a decent disassembler built right into Link.exe. The undocumented command line is link -dump -disasm <module>. If you don't want to see the code bytes in the disassembly, run the command line link -dump -disasm:nobytes <module>. The Link.exe disassembler will also take advantage of your Symbol Server, so you'll at least see where the functions start in the large sea of instructions. If you really want to get serious about the native disassembly, download Russ Osterland's excellent PEBrowse Professional Windows Disassembler at http://www.smidgeonsoft.com/. Make sure to check out Russ's excellent PEBrowse Interactive Debugger and other utilities, which work with both native and managed applications. Metadata Dumping CommandsWhen I discussed using the -md option to !bpmd, I used one of the metadata dumping commands, !dumpmt, to figure out the method descriptor required to use -md. That's one of the few metadata dumping commands you'll use. Another command to quickly get a method descriptor is !ip2md, which takes an executable address and reports the method descriptor that's executing. In nearly all cases, you'll be looking at addresses reported by !clrstack. There are numerous other commands you can use to wind your way through all the metadata in the process address space. From commands such as !dumpdomain to show you which modules belong to which app domain, to !dumpmodule to dump everything in a module, to !dumpclass to display the EEClass information, you can spend days using SOS to look at metadata. The good news is that you rarely have to look at the metadata information. In all the debugging I've done with SOS, my concern has been the heap, the whole heap, and nothing but the heap. However, if you truly want to understand .NET from the ground up, you will spend some time gyrating through the metadata in memory. There's a great article on using the SOS metadata commands by Hanu Kommalapati and Tom Christian in MSDN Magazine, with the wonderful title: "JIT and Run: Drill Into .NET Framework Internals to See How the CLR Creates Runtime Objects" (http://msdn.microsoft.com/msdnmag/issues/05/05/JITCompiler/default.aspx). That article will show you exactly what's happening under the hood of .NET and how to use the metadata dumping commands in SOS. I'll refer you there for more information on the metadata dumping commands. |
EAN: 2147483647
Pages: 99