Trace, Trace, Trace, and Trace
| Assertions might be the best proactive programming trick you can learn, but trace statements, if used correctly with assertions, will truly allow you to debug your application without the debugger. For some of you old programmers out there, trace statements are essentially printf-style debugging. You should never underestimate the power of printf-style debugging because that's how most applications were debugged before interactive debuggers were invented. Tracing in the .NET world is intriguing because when Microsoft first mentioned .NET publicly, the key benefits were not for developers but rather for network administrators and IT workers responsible for deploying the applications developers write. One of the critical new benefits Microsoft listed was the ability of IT workers to easily turn on tracing to help find problems in applications! I was quite stunned when I read that because it showed Microsoft responding to the pain our end users experience when dealing with buggy software. The trick to tracing is analyzing how much information you need for solving problems on machines that don't have the development environment installed. If you log too much, you get large files that are a real pain to slog through. If you log too little, you can't solve your problem. The balancing act requires having just enough logged to avoid a last-minute, 5,000-mile plane trip to a customer who just duplicated that one nasty buga plane trip in which you have to sit in the middle seat between a crying baby and a sick person. In general, good logging balance means that you need two levels of tracing: one level to give you the basic flow through the software so that you can see what's being called when and another level to add key data to the file so that you can look for data-streamdependent problems. Unfortunately, each application is different, so I can't give you an exact number of trace statements or other data marks that would be sufficient for your log. One of the better approaches I've seen is giving some of the newer folks on the team a sample log and asking whether they can get enough of a clue from it to start tracking down the problem. If they give up in disgust after an hour or two, you probably don't have enough information. If after an hour or two they can get a general idea of where the application was at the time of the corruption or crash, you've got a good sign that your log contains the right amount of information. The problem of having too much tracing output, while not as common as having too little, is bad also. When there's too much tracing, you have two problems. The first is that the tracing does slow down your application. On one consulting job we worked on, the tracing overhead on a production box made it impossible to turn on tracing for peak usage times. Too much tracing also makes it much harder to find the problems because you're wading through tens of pages to find that one special nugget of information you need. When you use your trace logs to do the debugging and you find yourself skipping lots of output, you need to question seriously if that data is necessary and if it's not, remove those traces. As I mentioned in Chapter 2, you must have a team-wide logging system. Part of that logging system design has to consider the format of the tracing, especially so that debug build tracing is easier to deal with. Without that format, tracing effectiveness quickly vanishes because no one will want to wade through a ton of text that constantly repeats worthless data. The good news for .NET applications is that Microsoft did quite a bit of work to make controlling the output easier. Before I jump into the different platform-specific issues, I want to mention one extremely cool tool you always need to have on your development machines: DebugView. My former neighbor Mark Russinovich wrote DebugView and many other outstanding tools that you can download from Sysinternals (www.sysinternals.com/utilities/debugview.html). The price is right (free!), and Mark's tools solve some very difficult problems, so you should subscribe to the Sysinternals RSS feed to be notified immediately where there are new tools or versions available. While you're there, you should also subscribe to Mark's blog if you want to read some of the best writing on hard-core system-level debugging in the world. DebugView monitors any calls to the user mode OutputDebugString or the kernel mode DbgPrint, so you can see any debug output when your application isn't running under a debugger. What makes DebugView even more useful is that it can burrow its way across machines, so you can monitor from a single machine all the machines that are part of a distributed system. Basic TracingAs I mentioned earlier, Microsoft made some marketing noise about tracing in .NET applications. In general, they did a good job creating a clean architecture that better controls tracing in real-world development. I already mentioned the Trace object during the assertion discussion, which is designed to use for your own tracing. Like the Debug object, the Trace object uses the concept of TraceListeners to handle the output. In your development, you'll want your assertion code to do the same thing. The Trace object's method calls are active only if TRACE is defined. The default for both debug and release build projects created by Visual Studio is to have TRACE defined, so the methods are probably already active. The Trace object has four overloaded methods to output trace information: Write, WriteIf, WriteLine, and WriteLineIf. You can probably guess the difference between Write and WriteLine, but understanding the *If methods is a little more challenging: they allow for conditional tracing. If the first parameter to the *If method evaluates to true, the trace happens; evaluating to false means it doesn't. That's quite convenient, but it possibly could lead to some big performance problems if you're not careful. For example, if you write code like that shown in the first portion of the next snippet, you will incur the overhead of the string concatenation every time the line executes because the determination for doing the actual tracing occurs inside the Trace.WriteLineIf call. You're much better off following the second method in the next snippet, in which you use an if statement to make the call to Trace.WriteLine only when you need to, minimizing how often you must incur the string concatenation overhead. // Paying the overhead every time Trace.WriteLineIf ( bShowTrace , "Parameters: x=" + x + "y =" + y ) ; // Causing the concatenation only when necessary if ( true == bShowTrace ) { Trace.WriteLine ("Parameters: x=" + x + " y =" + y ) ; }I think the .NET designers did us all a favor when they added the TraceSwitch class. With the *If methods for the Trace object allowing for conditional compilation, it took only a small step to define a class that provided for multiple levels of tracing and a consistent way to set them. The most important part of TraceSwitch is the name it's given in the first parameter of the constructor. (The second parameter is a descriptive name.) The name enables you to control the switch from outside the application, which I'll talk about in a moment. TraceSwitch objects wrap a tracing level. The levels are shown in Table 3-1. To check whether TraceSwitch matches a particular level, you use a set of properties, such as TraceError, that returns true if the switch condition is met. Combined with the *If methods, using TraceSwitch objects is quite straightforward. public static void Main ( ) { TraceSwitch TheSwitch = new TraceSwitch ( "SwitchyTheSwitch", "Example Switch" ); TheSwitch.Level = TraceLevel.Info ; Trace.WriteLineIf ( TheSwitch.TraceError , "Error tracing is on!" ) ; Trace.WriteLineIf ( TheSwitch.TraceWarning , "Warning tracing is on!" ) ; Trace.WriteLineIf ( TheSwitch.TraceInfo , "Info tracing is on!" ) ; Trace.WriteLineIf ( TheSwitch.TraceVerbose , "VerboseSwitching is on!" ) ; }
The real magic of TraceSwitch objects is that they allow you to easily set them from outside the application in the ubiquitous .Config file. The switches element under the system.diagnostics element is where you specify the add elements to add and set the name and level. A complete configuration file for an application follows this paragraph. Ideally, you have a separate TraceSwitch object for each assembly in your application. Keep in mind that the TraceSwitch settings can also be applied to the global Machine.Config. <?xml version="1.0" encoding="UTF-8" ?> <configuration> <system.diagnostics> <switches> <add name="Wintellect.ScheduleJob" value="4" /> <add name="Wintellect.DataAccess" value="0" /> </switches> </system.diagnostics> </configuration> The number-one sentiment about tracing is that it's very cool to set a TraceSwitch externally in the .config file, but getting the TraceSwitch to reread the .config file while the app is running is a big concern. In the .NET Framework 1.x, you have to do all the work yourself manually. But in the .NET Framework 2.0, the Trace object has a static method, Refresh, that will force a reread of the configuration files and update any trace switches as appropriate. Instead of everyone writing their own file change watcher, I wrote a little class called Wintellect. Diagnostics.ConfigTraceSwitchWatcher, which you can instantiate in your apps to get the TraceSwitch updates easily. The class sets a FileSystemWatcher on the directory that contains your application .config file, and when it changes, ConfigTraceSwitchWatcher will automatically call the Trace.Refresh method to automatically update all TraceSwitches. The only interesting part of the implementation was ensuring the correct name of the App.Config when running under the special debugging helper, *.vshost.exe, for Windows Forms and Console applications. Back in the Assert, Assert, Assert, and Assert sections, I discussed two of the TraceListeners included with the Framework Class Library (FCL): TextWriterTraceListener and EventLogTraceListener. Whereas those two have the problem that they don't show the stack traces for assertions, they will show everything from one of the Trace.Write* calls. In .NET 2.0, Microsoft has added several other TraceListener-derived classes that you may find useful. The FileLogTraceListener class from the Microsoft.VisualBasic.Logging namespace is a great new listener because it automatically handles log file rollover on a per-date or per-week basis. Additionally, the class has options to limit disk space usage and to specify the file output directory. If you've been doing any .NET server development, you've probably already written your own version of the FileLogTraceListener class. It's nice to see this functionality incorporated into the FCL. I've already mentioned a couple of the others: ConsoleTraceListener, DelimitedListTraceListener, and XmlWriterTraceListener. All three of those are derived from TextWriterTraceListener, and you can tell by the names what they do with their output. However, I need to explain some of the issues with the XmlWriterTraceListener. The following code snippet shows manually creating and writing to an XmlWriterTraceListener, and Listing 3-3 shows the example output.
As you read the Listing 3-3 XML output, you can see the first problem is that there's a ton of stuff written on each trace statement. When I get to the TraceSource discussions later in the chapter, I'll explain why the XmlWriterTraceListener is doing the heavy writing. Suffice it to say, you won't be doing massive detailed tracing with the XmlWriterTraceListener, but it's perfect for general tracing in your application. The subsequent, and bigger, issues with the output might be difficult to see in the book, but if you opened this file with the XML editor in Visual Studio 2005, the second E2ETraceEvent node has a squiggly red line under it indicating the error: "XML document cannot contain multiple root level elements." As a wise developer once told me: there are two types of XML, well formed and garbage. Some have argued that the XmlWriterTraceListener does not output valid XML for performance reasons. That may be the case, but if I'm turning on super-heavy tracing, I'm probably not going to want to spew that much data for a single trace anyway. Whatever the reason, it's what we have to deal with. Any discussion of basic tracing wouldn't be complete if I didn't mention the open source log4net project you can find at http://logging.apache.org/log4net/. It's a derivation of the Java log4j project and offers many ways of controlling exactly what type of tracing output your heart desires. In our consulting business we've run into many projects using log4net that have excellent results. Tracing in ASP.NET Applications and XML Web ServicesIn the .NET 1.1 days, ASP.NET tracing used a completely different system than everything else in .NET. The old way is still supported for backwards compatibility, so I do want to discuss it. However, at the end of this section, I'll describe how to easily merge both tracing systems into one so that everything's consistent across your Web interface in addition to your business logic pieces. The System.Web.UI.Page class has its own Trace property that returns an instance of type System.Web.TraceContext based on the HttpContext of the page. The two key methods for TraceContext are Write and Warn. Both handle tracing output, but the Warn method writes the output in red. Each method has three overloads, and both take the same parameters: the usual message and category with message overload, but also one that takes the category, message, and System.Exception. That last overload writes out the exception message and callstack. To avoid extra overhead processing when tracing isn't enabled, check whether the IsEnabled property is true. The easiest way to turn on tracing is to set the Trace attribute to true inside the @Page directive at the top of your .aspx files. <%@ Page Trace="true" %> That magic little directive turns on a ton of tracing information that appears directly at the bottom of the page, which is convenient, but it will be seen by both you and the users. In fact, there's so much tracing information that I really wish it were divided into several levels. Although seeing the Cookies and Headers Collections in addition to the Server Variables is nice, most of the time you don't need them. All sections are self-explanatory, but I want to point out the Trace Information section because any calls you make to TraceContext appear here. Even if you don't call TraceContext.Warn/Write, you'll still see output in the Trace Information section because ASP.NET reports when several of its methods have been called. This section is also where the red text appears when you call TraceContext.Warn. Setting the Trace attribute at the top of each page in your application is tedious, so the ASP.NET designers put a section in Web.Config that allows you to control tracing. This tracing section, named, appropriately enough, trace element, is shown here: <?xml version="1.0" encoding="utf-8" ?> <configuration> <system.web> <trace enabled="false" requestLimit="10" mostRecent="true" pageOutput="false" traceMode="SortByTime" localOnly="true" /> </system.web> </configuration> The enabled attribute dictates whether tracing is turned on for this application. The requestLimit attribute indicates how many trace requests to cache in memory on a per-application basis. (In just a moment, I'll discuss how to view these cached traces.) The new-to-.NET 2.0 mostRecent attribute, tells ASP.NET to keep the most recent requestLimit traces. If mostRecent is false, your tracing will match the .NET 1.1 way, which was to stop tracing after the requestLimit count was met. The pageOutput element tells ASP.NET where to show the trace output. If pageOutput is set to true, the output appears on the page just as it would if you set the Trace attribute in the Page directive. You probably won't want to change the traceMode element so that the Trace Information section in the trace is sorted by time. If you do want to see the sort-by category, you can set traceMode to SortByCategory. The final attribute, localOnly, tells ASP.NET whether the output should be visible only on the local machine or visible to any client applications. To see cached traces when pageOutput is false, append the HTTP handler, Trace.axd, to the application directory, which will show a page that allows you to choose the stored trace you'd like to see. For example, if your directory is http://www.wintellect.com/schedules, to see the stored traces, the path would be http://www.wintellect.com/schedules/trace.axd. As you can see, if you're not careful with tracing, your end users will be looking at them, which is always a little scary since developers are notorious for trace statements that could be career limiting if the output fell into the wrong hands. Luckily, setting localOnly to true keeps the trace viewing only on the local server, even when accessing the trace log through the Trace.axd HTTP handler. To view your application trace logs, you'll simply have to use the greatest piece of software known to humankind, Terminal Services, so that you can access the server directly from your office and don't even have to get up from your desk. You'll want to update the customErrors section of Web.Config so that you have a defaultRedirect page, preventing your end users from seeing the ASP.NET "Server Error in 'AppName' Application" error if they try to access Trace.axd from a remote machine. You'll also want to log that someone tried to access Trace.axd, especially because an attempted access is probably an indication of a hacker. You've probably guessed the limitation of the old ASP.NET means of tracing. Your user interface tracing goes to one location, and all your class libraries are sending theirs through Trace.WriteLine, so they go to a different location. In the previous edition of this book, I had to write a TraceListener that would take care of mapping the System.Diagnostic.Trace object to the ASP.NET page so you could see them. Fortunately, with .NET 2.0, Microsoft now provides that code inside the FCL in the form of the WebPageTraceListener. The only problem is that ASP.NET does not automatically add it to the Trace.Listeners collection. You will need to include the following lines in all your Web.Config files to ensure that you have all your tracing going through TraceContext so you can see it: <system.diagnostics> <trace autoflush="true" indentsize="4"> <listeners> <add name="webListener" type="System.Web.WebPageTraceListener, System.Web, Version=2.0.0.0, Culture=neutral, PublicKeyToken=b03f5f7f11d50a3a"/> </listeners> </trace> </system.diagnostics> Advanced TracingThe tracing system consisting of the Trace object is quite good and will generally suffice for all small- and medium-sized applications as is. However, the Trace object is not perfect and can lead to some issues. The main problem is that there's only one Trace object global to the application domain. As you move into larger industrial-strength applications, the global, one-size-fits-all nature of the Trace object becomes a hindrance because all threads in the application domain must go through the bottleneck of the single tracing object. In heavily multithreaded applications, your goal is to use as much of the time-slice given to your thread as possible. If you are artificially giving up your time slice because of synchronization, you're slowing down your application. The second problem with a single Trace object is that everyone sharing the same object can quickly overload you with data. Although you can use TraceSwitch options to control output, you can become overwhelmed when you have to turn on tracing for multiple pieces of a large application. You'll be sorting through lots of potential output you don't really want to see in many cases. Another problem with the existing Trace object in larger applications is that the output is limited to just the string passed to Trace.Write*. In real-world apps, many times, such as when tracing into error handling code, you want to add lots of additional output, such as the call stack, process information, thread information, and so on. While you could programmatically add that data into every place where you think you might need it in your trace output, it would be much better if you could dynamically change the data output in the configuration file. To rectify these problems, Microsoft added several new features to the FCL. The biggest is the TraceSource class, which is a Trace object you can instantiate. The idea is that you'll instantiate a TraceSource for each of your major subsystems so you can avoid blocking across them. Microsoft also extended the existing TraceListener class with all sorts of new output options. To take advantage of the new output options, they've added a SourceSwitch, which is like a TraceSwitch on steroids. Finally, they've also added a TraceFilter class to allow better filtering of output. Because code and pictures are worth a thousand words, the best way for me to show how the new enhancements work is to show some code and a picture of how things work. Listing 3-4 is a simple program that shows using a TraceSource along with the other options now available for large application tracing control. Read over the code because it wasn't until I wrote the code that I started seeing the amazing power of the new tracing functionality.
After I'd written that code, I ran across a wonderful blog entry from Mike Rousos (http://blogs.msdn.com/bclteam/archive/2005/03/15/396431.aspx), a member of the Base Class Library Team, talking about the TraceSource. The blog had a graphic that showed where the various classes fit together. For those of you who are graphical thinkers, I took Mike's idea and expanded it so you could see how a trace flows through the new tracing system. Figure 3-7 shows three different TraceSource instances in use by an app. When a Trace* method is called, it checks the Switch-derived class in the TraceSource.Switch property to see if the condition on the Trace* method matches. If the condition doesn't match, nothing is traced. Notice that a Switch class can be shared between TraceSource instances (see B and C in the diagram). If the Switch-derived condition is met, the TraceSource loops through its Listeners collection calling the appropriate TraceListener.Trace* method. (In the .NET Framework 2.0 documentation, you'll see that the TraceListener class has numerous new properties and methods.) Figure 3-7. Data flow of TraceSource to output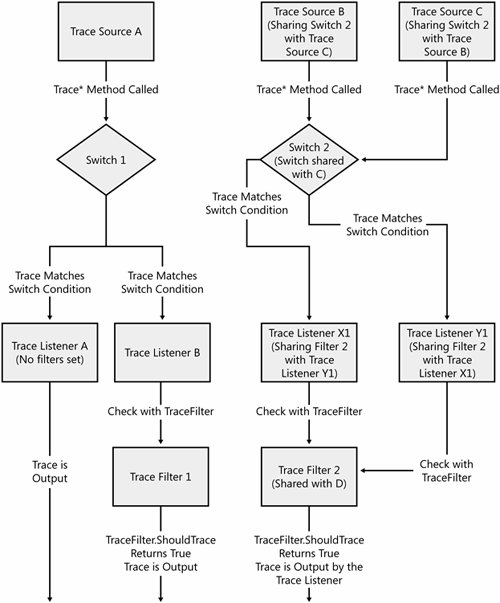 If the individual TraceListener class has a TraceFilter instance in the TraceListener.Filter property, before any output is sent, the TraceListener checks to see if TraceFilter.ShouldTrace returns true. If it does not, no output is sent. If ShouldTrace returns true, the output is sent to that TraceListener's internal writing method. In Figure 3-7, TraceSource instance B has a single TraceListener instance called X1 set in its TraceListeners collection, and TraceSource C has a single TraceListener called Y1. However, the TraceSource objects are sharing a Switch 2, so any initial matching on the TraceSource.Trace* methods for B or C will be filtered identically. In the case of the two TraceListeners, they both share a filter, Filter 2, so any filtering will apply to both. At the top of Listing 3-4, the ShowAllTraceMethods calls each of the methods in a TraceSource instance dedicated to tracing. The first method, TraceInformation, is for the simplest tracing, and after I talk about the other methods, you probably won't want to use it for your tracing because it has no flexibility for controlling output externally. The main method you'll want to use is TraceEvent because it allows you to assign a TraceEventType enumeration to indicate the level of tracing. The second parameter is the numeric identifier for the trace. With that parameter, you either uniquely identify tracing or assign a specific value to a class to help identify tracing output at a glance. There are three overloads to TraceEvent, but the big news is that one takes variable-length parameters so you can pass a formatting string and get your data displayed nicely in the trace. The TraceData method also accepts the trace identifier, but its main purpose is to allow you to pass either an object array or multiple parameters so the trace output shows them separated by commas. If you are dealing with data objects whose ToString method does the heavy lifting, the TraceData call can be your dependable friend. In general, you'll nearly always use TraceEvent. The final method, TraceTransfer, was designed to work hand in glove with the XmlWriterTraceListener. If you look back at the output of XmlWriterTraceListener in Listing 3-3, you might have noticed a Correlation element with an ActivityID attribute that looks like a GUID. TraceTransfer sets the internal GUID that the XmlWriterTraceListener will use until the next time a call to TraceTransfer sets a new GUID. You can assign a GUID to major activities in your application, such as login handling, so you can quickly scan the XmlWriterTraceListener output looking for logical operations in your tracing. I'm willing to bet that only the largest applications will use TraceTransfer and the ActivityID. That's because the first parameter of both the TraceEvent and TraceData methods is a TraceEventType, and it's worth mentioning how much this has grown in the .NET Framework 2.0. In the .NET Framework 1.x, you were limited to Error, Warning, Info, and Verbose with a TraceSwitch. Table 3-2 shows all the values of the TraceEventType enum and what they are for. As you can see, Start, Stop, Resume, and Transfer are all called activity types. Since one of the primary uses of tracing is to determine which operations occurred and the order in which they occurred, these new tracing events make that extremely easy. To see just the activity tracing, you can set the TraceSource.Switch.Level to SourceLevels.ActivityTracing.
While programmatically manipulating TraceSource instances is possible, as shown back in Listing 3-4, the real action is in manipulating the tracing from the application's configuration file. Listing 3-5 shows the App.Config file of a program that has two TraceSource instances, HappySource and GiddySource. (Remember, anything you can put in App.Config you can put in Web.Config.) The sources element is where you configure the individual TraceSource instances in a source element for each instance you want to configure. The two required attributes to the source element are the self-explanatory name and switchName. By associating a Switch instance with the TraceSource, you can control the output for the TraceSource instance. Keep in mind that Switch instances can be shared across multiple TraceSource instances. Underneath the source element, you can specify any TraceListeners you want to associate with that TraceSource. You can add and remove any items from the TraceSource.Listeners property and dynamically create new TraceListeners directly from the configuration file, just as you can in the .NET Framework 1.x. What's most interesting in Listing 3-5 is the sharedListeners element with which you can create TraceListener instances that are shareable across all TraceSource instances in the application. As you can see in the listing, you will still need to add the shared instance to the individual TraceSources. In the XmlWriterTraceListener added in Listing 3-5, I also show how to apply a TraceFilter to a TraceListener. The new traceOutputOptions attribute allows you to specify the TraceOptions you want applied to the TraceListener. Whereas I added that filter to the TraceListener being shared across all TraceSource instances, you can also add those TraceFilters to TraceListeners that you add to an individual TraceSource instance. The last piece of Listing 3-5 is the switches element, with which you configure individual Switch instances. The only difference in the switches element in the .NET Framework 2.0 from the .NET Framework 1.x is that the value attribute can now take string values that are passed to the switch constructor to set the value instead of numbers like the original TraceSwitch class. As you can see, the amount of control that you have over your tracing in the configuration with the .NET Framework 2.0 is simply amazing. The icing on the cake is the new ability in the .NET Framework 2.0 to tell you the exact line in the configuration file that's not correct, so those of us who have spent hours pulling our hair out looking for problems in our configuration file can now start growing some of it back.
|
EAN: 2147483647
Pages: 99