Assert, Assert, Assert, and Assert
| I hope most of you already know what an assertion is, because it's the most important proactive programming tool in your debugging arsenal. For those who are unfamiliar with the term, here's a brief definition: an assertion declares that a certain condition must be true at a specific point in a program. The assertion is said to fail if the condition is false. You use assertions in addition to normal error checking. Traditionally, assertions are functions or macros that execute only in debug builds and bring up a message box or log into a file telling you what condition failed. I extend the definition of assertions to include conditionally compiled code that checks conditions and assumptions that are too complex for a general assertion function or macro to handle. Assertions are a key component of proactive programming because they help developers and test engineers determine not just that bugs are present but also why the errors are happening. Even if you've heard of assertions and drop them in your code occasionally, you might not be familiar enough with them to use them effectively. Development engineers can never be too rich or too thinor use too many assertions. The rule of thumb I've always followed to judge whether I've used enough assertions is simple: I have enough assertions when my junior coworkers complain that they get multiple assertion failure reports whenever they call into my code with invalid information or assumptions. If used sufficiently, assertions will tell you most of the information you need to diagnose a problem at the first sign of trouble. Without assertions, you'll spend considerable time in the debugger working backward from the crash searching for where things started to go wrong. A good assertion will tell you where and why a condition was invalid. A good assertion will also let you get into the debugger after a condition fails so that you can see the complete state of the program at the point of failure. A bad assertion tells you something's wrong, but not what, why, or where. A side benefit of using plenty of assertions is that they serve as outstanding additional documentation in your code. What assertions capture is your intent. I'm sure you go well out of your way to keep your design documents perfectly up to date, but I'm just as sure that a few random projects let their design documents slip through the cracks. By having good assertions throughout your code, the maintenance developer can see exactly what value ranges you expected for a parameter or what you anticipated would fail in a normal course of operation versus a major failure condition. Assertions will never replace proper comments, but by using them to capture the elusive "here's what I meant, which is not what the documents say," you can save a great deal of time later in the project. Before we go any further, I want to rebut what some of you are thinking right now: "I don't need to read this chapter on assertions; if I have a problem in my code, I'll just throw an exception." The problem is that once you throw that exception, you've lost the state! Look at the result of an unhandled exception such as the following (note that I wrapped some of the lines for readability): Unhandled Exception: System.ComponentModel.Win32Exception: Only part of a ReadProcessMemory or WriteProcessMemory request was completed at System.Diagnostics.NtProcessManager.GetModuleInfos(Int32 processId, Boolean firstModuleOnly) at System.Diagnostics.Process.get_Modules() at DiagnosticHelper.StackWriter.IsDotNetInProcess() in c:\Bar\StackWriter.cs:line 343 at DiagnosticHelper.StackWriter.Execute() in c:\Bar\StackWriter.cs:line 58 at DiagnosticHelper.Program.Main(String[] args) in c:\Bar\Program.cs:line 79 While you can detect a memory reading problem in the Process.get_Modules method, can you tell me exactly which module loaded was causing the problem? Is the value of firstModuleOnly true or false? What were the local variables in the Execute method? The problem with Microsoft .NET is that you get very little of the information you need to diagnose problems in an exception. The call stack tells you where it started, but it says nothing about your local variables and parameters even in the function that caused the state to be bad. Without an assertion, you are going to spend far more time debugging than with one. The key with assertions is that good assertion code, such as that in .NET, allows you to get the debugger attached before the state is lost. With the debugger, you'll be able to see all the data you can't see in an exception, so you now have the information to solve the problem faster. You'll still throw the exception as part of your normal error handling, but by adding the assertion, you'll spend less time on the problem and have more time for more interesting tasks. Some of you may be thinking that you can still do without assertions because if you set the debugger to stop instantly when an exception is thrown, you'll achieve the same effect. That's true, but you'd have to start your application from the debugger every time you run it. Although that may be the only way you run the application, I can assure you that testers, your coworkers, or even your manager are not starting those debug builds from the debugger. The assertions are always there ready to trigger the instant anything is amiss so you can decide how you want to proceed from the problem. How and What to AssertMy stock answer when asked what to assert is to assert everything. I would love to say that for every line of code you should have an assertion, but it's an unrealistic albeit admirable goal. You should assert any condition because it might be the one you need to solve a nasty bug in the future. Don't worry that putting in too many assertions will hamper your program's performanceassertions are active only in debug builds, and the bug-finding opportunities created outweigh any performance hit. Assertions should never change any variables or states of a program. Treat all data you check in assertions as read-only. Because assertions are active only in debug builds, if you do change data by using an assertion, you'll have different behavior between debug and release builds, and tracking down the differences will be extremely difficult. In this section, I want to concentrate on how to use assertions and what to assert. I'll do this by showing code examples. For .NET, all your assertions start with Debug.Assert methods from the System.Diagnostic namespace. There are three overloaded Assert methods. All three take a Boolean value as their first or only parameter, and if the value is false, the assertion is triggered. As shown in the following examples in which I used Debug.Assert, one of the methods takes a second parameter of type string, which is shown as a message in the output. The final overloaded Assert method takes a third parameter of type string, which provides even more information when the assertion triggers. In my experience, the two-parameter approach is the easiest to use because I simply copy the condition checked in the first parameter and paste it in as a string. Of course, now that the assertion requiring the conditional expression is in quotes, make it part of your code reviews to verify that the string value always matches the real condition. As I mentioned in the Custom Code Analysis Rules section in Chapter 2, using the one parameter Debug.Assert is not good because the assertion output does not tell you why you're asserting. That's why I wrote the Code Analysis rule to report an error if you're using it. The following code shows all three Assert methods in action: Debug.Assert ( i > 3 ) ; Debug.Assert ( i > 3 , "i > 3" ) ; Debug.Assert ( i > 3 , "i > 3" , "This means I got a bad parameter") ;
How to AssertThe first rule when using assertions is to check one item at a time. If you check multiple conditions with just one assertion, you have no way of knowing which condition caused the failure. In the following example, I show the same function with two assertion checks. Although the assertion in the first function will catch a bad parameter, the assertion won't tell you which condition failed or even which of the three parameters is the offending one. Your first assertion goal is to check each condition atomically. // The wrong way to write an assertion. Which parameter was bad? string FillData ( char[] array , int offset , int length ) { Debug.Assert ( ( null != array ) && ( offset > 0 ) && ( ( length > 0 && ( length < 100 ) ) ) ) ; ... } // The proper way. Each parameter is checked individually so that you // can see which one failed. string FillData ( char[] array , int offset , int length ) { Debug.Assert ( null != array , "null != array") ; Debug.Assert ( offset > 0 , "offset > 0") ; Debug.Assert ( ( length > 0 ) && ( length < 100 ) , " ( length > 0 ) && ( length < 100 )" ) ; ... }In looking at the fixed FillData example above, you may think that I'm breaking my own rules by checking that the length parameter is between 0 and 100. Because I'm checking against a constrained range, that check is atomic enough. There's no need to break apart the expression into two separate Debug.Assert calls. When you assert a condition, you need to strive to check the condition completely. For example, if your .NET method takes a string as a parameter and you expect the string to have something in it, checking against null checks only part of the error condition. // An example of checking only a part of the error condition bool LookupCustomerName ( string customerName ) { Debug.Assert ( null != customerName , "null != customerName") ; ... }You can check the full condition by also checking to see whether the string is empty. // An example of completely checking the error condition bool LookupCustomerName ( string customerName ) { Debug.Assert ( false == string.IsNullOrEmpty ( customerName ), "false == string.IsNullOrEmpty ( customerName )" ); ...Another step I always take is to ensure that I'm asserting against specific values so I'm asserting correctly. The following example shows first how to check for a value incorrectly and then how to check for it correctly: // Example of a poorly written assertion. What happens if count is negative? Function UpdateListEntries ( ByVal count As Integer) As Integer Debug.Assert ( count <> 0 , "count <> 0" ) ... End Function // A proper assertion that explicitly checks against what the value // is supposed to be Function UpdateListEntries ( ByVal count As Integer) As Integer Debug.Assert ( count > 0 , "count > 0" ) ... End Function The incorrect sample essentially checks only whether count isn't 0, which is just half of the information that needs to be asserted. By explicitly checking the acceptable values, you guarantee that your assertion is self-documenting, and you also ensure that your assertion catches corrupted data. What to AssertNow that you're armed with an idea of how to assert, we can turn to exactly what you need to be asserting throughout your code. If you haven't guessed from the examples I've presented so far, let me clarify that the first mandatory items to assert are the parameters coming into the method or property setter. Asserting parameters is especially critical with module interfaces and class methods that others on your team call. Because those gateway functions are the entry points into your code, you want to make sure that each parameter and assumption is valid. As I pointed out in the debugging war story earlier in this chapter, "A Career-Limiting Move," assertions always work hand in hand with normal error handling. As you move inside your module, the parameters of the module's private methods might not require as much checking, depending mainly on where the parameters originated. Much of the decision about which parameters to validate comes down to a judgment call. It doesn't hurt to assert every parameter of every method, but if a parameter comes from outside the module, and if you fully asserted it once, you might not need to again. By asserting each parameter on every function, however, you might catch some errors inside your module. I sit right in the middle of the two extremes. Deciding how many parameter assertions are right for you just takes some experience. As you get a feel for where you typically encounter problems in your code, you'll figure out where and when you need to assert parameters internal to your module. One safeguard I've learned to use is to add parameter assertions whenever a bad parameter blows up my code. That way, the mistake won't get repeated, because the assertion will catch it. Another area that's mandatory for assertions is API and COM return values because the return values tell you whether the API succeeded or failed. One of the biggest problems I see in debugging other developers' code is that they simply call API functions without ever checking the return value. I have seen so many cases in which I've looked for a bug only to find out that some method early on in the code failed but no one bothered to check its return value. Of course, by the time you discover the culprit, the bug is manifested, so the program dies or corrupts data some 20 minutes later. By asserting API return values appropriately, you at least know about a problem when it happens. Of course, you will still perform regular error handling on those API return values. Keep in mind that I'm not advocating asserting on every single possible failure. Some failures are expected in code, and you should handle them appropriately. Having an assertion fire each time a lookup in the database fails will likely drive everyone to disabling assertions in the project. Be smart about it, and assert on return values when it's something serious. Handling good data throughout your program should never cause an assertion to trigger. Another area in which you'll have assertions is when you verify the state of the object. For example, if you have a private method that assumes that the object hasn't been disposed, you'd have an assertion to ensure that the method call happens with the correct state. The big idea behind proactive programming is that you leave nothing to chance and never leave an assumption unquestioned. Finally, I recommend that you use assertions when you need to check an assumption. For example, if the specifications for a class require 3 MB of disk space, you should assert this assumption with conditional inside the class to ensure that the callers are upholding their end of the deal. Here's another example: if your code is supposed to access a database, you should have a check to see whether the required tables actually exist in the database. That way you'll know immediately what's wrong instead of wondering why you're getting weird return values from other methods in the class. In both of the preceding examples, as with most assumption assertions, you can't check the assumptions in a general assertion method. In these situations, the conditional compilation technique that I indicated in the last paragraph should be part of your assertion toolkit. Because the code executed in the conditional compilation works on live data, you must take extra precautions to ensure that you don't change the state of the program. To avoid the serious problems that can be created by introducing code that has side effects, I prefer to implement these types of assertions in separate methods, if possible. By doing so, you avoid changing any local variables inside the original method. Additionally, the conditionally compiled assertion methods can come in handy in the Watch window, as you'll see in Chapter 5, "Advanced Debugger Usage with Visual Studio," when we talk about the Microsoft Visual Studio 2005 debugger. Listing 3-1 shows a conditionally compiled method that checks whether a table exists so that you'll get the assertion before you start any significant access. Note that this test method assumes that you've already validated the connection string and can fully access the database. AssertTableExists ensures that the table exists so that you can validate this assumption instead of looking at an odd failure message from deep inside your code.
Assertions in .NETBefore I get into the gritty details of .NET assertions, I want to mention one key mistake I've seen in almost all .NET code written, especially in many of the samples from which developers are lifting code to build their applications. Everyone forgets that it's entirely possible to have an object parameter passed as null (or Nothing in Visual Basic). Even when developers are using assertions, the code looks like the following: void DoSomeWork ( string name ) { Debug.Assert ( name.Length > 0 ) ; ...Instead of triggering the assertion, if name is null, calling the Length property causes a System.NullReferenceException exception in your application, effectively crashing it. This is a horrible case in which the assertion is causing a nasty side effect, thus breaking the cardinal rule of assertions. Of course, it logically follows that if developers aren't checking for null objects in their assertions, they aren't checking for them in their normal parameter checking. Do yourself a huge favor and start checking objects for null. The fact that .NET applications don't have to worry about pointers and memory pointers and manual memory management means that at least 60 percent of the assertions we were used to handling in the C++ days just went away. On the assertion front, the .NET team added as part of the System.Diagnostic namespace two objects, Debug and Trace, which are active only if you defined DEBUG or TRACE, respectively, when compiling your application. Both of these conditional compilation symbols can be specified as part of the Build tab in the project property pages dialog box. Visual Studiocreated projects always define TRACE for both debug and release builds, so if you're doing manual projects, make sure to add it to your build options. As you've seen, the Assert is the method that handles assertions in .NET. Interestingly enough, both Debug and Trace have identical methods, including an Assert method. I find it a little confusing to have two possible assertions that are conditionally compiled differently. Consequently, because assertions should be active only in debug builds, I use only Debug.Assert for assertions. Doing so prevents surprise phone calls from end users asking about a weird dialog box or message telling them that something went bad. I strongly suggest that you do the same so that you contribute to some consistency in the world of assertions. If you use the Code Analysis rules provided with the book's source code, I have a rule that will tell you that you are using Trace.Assert so you can remove it from your code. The .NET Debug class is intriguing because you can see the output in multiple ways. The output for the Debug classand the Trace class for that mattergoes through another class, named a TraceListener. Classes derived from TraceListener can be added to the Debug class's Listeners collection property. The beauty of the TraceListener approach is that each time an assertion fails, the Debug class runs through the Listeners collection and calls each TraceListener object in turn. This convenient functionality means that even when new and improved ways of reporting assertions surface, you won't have to make major code changes to benefit from them. Even better, in the next section, I'll show you how you can add new TraceListener objects without changing your code at all, which makes for ultimate extensibility! The initial TraceListener in the Listeners collection, appropriately named DefaultTraceListener, sends the output to two different places, the most visible of which is the assertion message box shown in Figure 3-1. As you can see in the figure, the bulk of the message box is taken up with the stack walk and parameter types in addition to the source and line for each item. The top lines of the message box report the string values you passed to Debug.Assert. In the case of Figure 3-1, I just passed "Debug.Assert assertion" as the second parameter to Debug.Assert. Figure 3-1. The DefaultTraceListener message box
The result of clicking each button is described in the title bar for the message box. The only interesting button is Retry. If you're running under a debugger, you simply drop into the debugger at the line directly after the assertion. If you're not running under a debugger, clicking Retry triggers a special exception and then launches the Just In Time debugger selector to allow you to select the registered debugger you'd like to use to debug the assertion. In addition to the message box output, Debug.Assert also sends all the output through OutputDebugString, the Windows API tracing function, so the attached debugger will get the output. The output has a nearly identical format, shown in the following code. Since the DefaultTraceListener does the OutputDebugString output, you can always use Mark Russinovich's excellent DebugView (www.sysinternals.com/utilities/debugview.html) to view the output even when you're not running under a debugger. I'll discuss this in more detail later in the chapter. ---- DEBUG ASSERTION FAILED ---- ---- Assert Short Message ---- Debug.Assert assertion ---- Assert Long Message ---- at HappyAppy.Fum() D:\AssertExample\Class1.cs(11) at HappyAppy.Fo(StringBuilder sb) D:\AssertExample\Class1.cs(16) at HappyAppy.Fi(IntPtr p) D:\AssertExample\Class1.cs(20) at HappyAppy.Fee(String Blah) D:\AssertExample\Class1.cs(25) at HappyAppy.Baz(Double d) D:\AssertExample\Class1.cs(30) at HappyAppy.Bar(Object o) D:\AssertExample\Class1.cs(35) at HappyAppy.Foo(Int32 i) D:\AssertExample\Class1.cs(42) at HappyAppy.Main() D:\AssertExample\Class1.cs(48) Armed with the information supplied by Debug.Assert, you should never again have to wonder how you got into the assertion condition! The .NET Framework also supplies numerous other TraceListener-derived classes. To write the output to a text file, use the TextWriterTraceListener class. To write the output to the event log, use the EventLogTraceListener class. The other TraceListener-derived classes, DelimitedListTraceListener, ConsoleTraceListener, and XmlWriterTraceListener are used more in pure tracing, so I'll discuss them in the "Trace, Trace, Trace, and Trace" section later in the chapter. Unfortunately, the TextWriterTraceListener and EventLogTraceListener classes are essentially worthless because they log only the message fields to your assertions and not the stack trace at all. The good news is that implementing your own TraceListener objects is fairly trivial, so as part of Wintellect.Diagnostics.dll, I went ahead and wrote the correct versions for TextWriterTraceListener and EventLogTraceListener for you: FixedTextWriterTraceListener and FixedEventLogTraceListener, respectively. Neither FixedTextWriterTraceListener nor FixedEventLogTraceListener are very exciting classes. FixedTextWriterTraceListener is derived directly from TextWriterTraceListener, so all it does is override the Fail method, which is what Debug.Assert calls to do the output. Keep in mind that when using FixedTextWriterTraceListener or TextWriterTraceListener, the associated text file for the output isn't flushed unless you set the trace element autoflush attribute to true in the application configuration file, explicitly call Close on the stream or file, or set Debug.AutoFlush to true so that each write causes a flush to disk. Alternatively, you can also set these values to true in the configuration files, which I'll show in a moment. For some bizarre reason, the EventLogTraceListener class is sealed, so I couldn't derive directly from it and had to derive from the abstract TraceListener class directly. However, I did retrieve the stack trace by using the standard StackTrace class that's been around since .NET 1.0. One nice feature in .NET 2.0 is that you no longer have to manually work through reflection to find the source and line of each method on the stack. If you want the full stack with source and line, use one of the StackTrace constructors that take a Boolean value and pass true. Since I'm talking about the source and line, I should mention that the .NET StackTrace class source lookup will look only at .pdb files in the same directory as the binary. It will not look in your Symbol Server. Controlling the TraceListener Property with Configuration FilesFor the most part, DefaultTraceListener should serve most of your needs. However, having a message box that pops up every once in a while can wreak havoc on any automated test scripts you might have. Also if you use a third-party component in a Win32 service, which was not tested running under a service but has calls to Debug.Assert in it, the debug build of that component could cause message box popups using DefaultTraceListener, which would hang your service. In both of these cases, you want to be able to shut off the message box generated by DefaultTraceListener. You could add code to remove the DefaultTraceListener instance from the Debug.Listeners property, but it is also possible to remove it even without touching the code. Any .NET executable can have an external XML configuration file associated with it. This file resides in the same directory as the binary file and is the name of the executable with ".Config" appended to the end. For example, the configuration file for Example.exe is Example.exe.Config. You can easily add a configuration file to your project in Visual Studio by adding a new XML file named App.Config. That file will automatically be copied to the output directory and named to match the binary. For Microsoft ASP.NET applications, the configuration file is always named Web.Config. In the XML configuration file, the assert element under system.diagnostics has two attributes. If you set the first attribute, assertuienabled, to false, .NET doesn't display message boxes, and the output still goes through OutputDebugString. The second attribute, logfilename, allows you to specify a file you want any assertion output written to. Interestingly, when you specify a file in the logfilename attribute, any trace statements will also appear in the file. A minimal configuration file is shown in the next code snippet, and you can see how easy it is to shut off the assertion message boxes. Don't forget that the master configuration file Machine.Config, which is stored in the %SystemRoot%\Microsoft.NET\Framework64\FrameworkVersion\Config directory, has the same settings as the EXE configuration file, so you can optionally turn off message boxes on the whole machine by using the same settings, as follows: <?xml version="1.0" encoding="UTF-8" ?> <configuration> <system.diagnostics> <assert assertuienabled="false" logfilename="tracelog.txt" /> </system.diagnostics> </configuration> As I mentioned earlier, you can add and remove listeners without touching the code, and as you probably guessed, the configuration file has something to do with it. This file looks straightforward in the documentation, but the documentation at the time I am writing this book is not correct. After a little experimentation, I figured out all the tricks necessary to control your listeners correctly without changing the code. All the action happens under the trace element of the configuration. The trace element happens to have one very important optional attribute you should always set to true in your configuration-files: autoflush. By setting autoflush to true, you force the output buffer to be flushed each time a write operation occurs. If you don't set autoflush, you'll have to add calls to your code to get the output saved onto the disk. Note that autoflush is false by default, and this could be the reason why you don't get any trace after your application crashes: the last output was not saved on disk before the crash occurs. Underneath trace is the listeners element, containing the list of the TraceListener-derived objects that will be added to or removed from the Debug.Listeners property at run time. Removing a TraceListener object is very simple. Specify the remove element, and set the name attribute to the string name of the desired TraceListener class. If you define your own TraceListener-derived class, don't forget to either override the get accessor of its Name property or, in the constructor, call the base constructor with your own specific name; this is how your class will be identified within configuration files. The complete configuration file necessary to remove DefaultTrace-Listener is as follows: <?xml version="1.0" encoding="UTF-8" ?> <configuration> <system.diagnostics> <trace autoflush="true" indentsize="0"> <listeners> <remove name="Default" /> </listeners> </trace> </system.diagnostics> </configuration> The add element has two required attributes. The name attribute is a string that specifies the name of the TraceListener object set into the TraceListener.Name property when the instance is created. The second attribute, type, specifies the .NET type you want to load and associate with the given name. The one optional attribute, initializeData, is the string passed to the constructor of the TraceListener object. The documentation shows only adding a type that is in the global assembly cache (GAC) and implies that that's where all assemblies must be in order to load, which is not the case. To add a TraceListener object that's in the GAC, the type element can consist of two different forms. The usual is the fully qualified type name, which specifies the type, assembly, version, culture, and public key token. You'll want to use this form in most cases to specify the exact type you want to load. An undocumented feature will allow you to specify just the type name, and .NET will load the first type found in the GAC. In the case of the Microsoft-supplied TraceListener classes, this works fine. If you want to add your custom TraceListener class that doesn't reside in the GAC, your options become a little more involved. The easy case is when your TraceListener resides in the same directory where the EXE for your process loads from. In that case, to add the derived TraceListener object, you specify the full type name, a comma, and the name of the assembly. You can enter the fully qualified type name, but because you can have only a single named DLL in the directory at one time, the extra typing is overkill. The following shows how to add Fixed-TextWriterTraceListener from Wintellect.Diagnostics.dll: <?xml version="1.0" encoding="UTF-8" ?> <configuration> <system.diagnostics> <trace autoflush="true" indentsize="0"> <listeners> <add name="AGoodListener" type= "Wintellect.Diagnostics.FixedTextWriterTraceListener,Wintellect.Diagnostics" initializeData="HappyGoLucky.log"/> </listeners> </trace> </system.diagnostics> </configuration> In adding TraceListeners from configuration files, there has been a change concerning where .NET creates the output files for TraceListeners. In .NET 2.0, the output file is relative to the App.Config/Web.Config. For the example above, the HappyGoLucky.log file will be written to the same directory as App.Config. In .NET 1.x, the output file was always created relative to the application. In the case of the ASP.NET worker process, this was usually a major problem because the worker process is down deep in %SystemRoot%\system32\INETSRV directory, where your application probably does not have write permissions. If you'd like to keep the assembly containing your TraceListener type in a different directory, you have two choices. Using the probing element in the App.Config/Web.Config, you can set the privatePath attribute to the private assembly search path to a directory below the application directory. The following example configuration file shows adding FixedTextWriterTraceListener and telling the runtime to look both in the directories Happy and Joyful for the assembly. I've found that it works best to use the fully qualified type name of the assembly when utilizing the probing element. <?xml version="1.0" encoding="utf-8" ?> <configuration> <runtime> <assemblyBinding xmlns="urn:schemas-microsoft-com:asm.v1"> <probing privatePath="Happy;Joyful"/> </assemblyBinding> </runtime> <system.diagnostics> <trace autoflush="true" indentsize="0"> <listeners> <add name="CoolListener" type="Wintellect.Diagnostics.FixedTextWriterTraceListener, Wintellect.Diagnostics, Version=2.0.0.0, Culture=neutral, PublicKeyToken=f54122dc856f9575" initializeData="MyConfigEventLog"/> </listeners> </trace> </system.diagnostics> </configuration> The final way of specifying the assembly to load is the most flexible because the TraceListener can be anywhere, but it requires a little more typing. The trick is to tell .NET where to look by using the <dependentAssembly> elements in the configuration to have the assembly loader look for a specific assembly in a different location. In the following example, I'll specify the three assemblies needed to load FixedTextWriterTraceListener. The assemblyIdentity elements specify the exact name, culture, and public key token for the assembly, and the codeBase element indicates the version and points to a directory where the assembly will be loaded from. Interestingly, the href attribute in codeBase takes a Uniform Resource Identifier (URI), so you could also specify a Web site with an http:// location. <configuration> <runtime> <assemblyBinding xmlns="urn:schemas-microsoft-com:asm.v1"> <dependentAssembly> <assemblyIdentity name="Wintellect.Diagnostics" culture="neutral" publicKeyToken="f54122dc856f9575"/> <codeBase version="2.0.0.0" href="file://c:/Listeners/Wintellect.Diagnostics.dll"/> </dependentAssembly> <dependentAssembly> <assemblyIdentity name="Wintellect.Utility" culture="neutral" publicKeyToken="f54122dc856f9575"/> <codeBase version="1.0.0.0" href="file://c:/Listeners/Wintellect.Utility.DLL"/> </dependentAssembly> <dependentAssembly> <assemblyIdentity name="Caudal.Windows.Forms" culture="neutral" publicKeyToken="f54122dc856f9575"/> <codeBase version="1.0.0.0" href="file://c:/Listeners/Caudal.Windows.Forms.dll"/> </dependentAssembly> </assemblyBinding> </runtime> <system.diagnostics> <trace autoflush="true" indentsize="0"> <listeners> <add name="CoolListener" type="Wintellect.Diagnostics.FixedTextWriterTraceListener, Wintellect.Diagnostics, Version=2.0.0.0, Culture=neutral, PublicKeyToken=f54122dc856f9575" initializeData="MyOutputFile.txt"/> </listeners> </trace> </system.diagnostics> </configuration> Assertions in ASP.NETUp to this point, if you're doing primarily ASP.NET development, you're thinking that what I've talked about applies only to Windows Forms or console applications. In the mean old .NET 1.1 days, you would have been right. There was zero support for Debug.Assert in ASP.NET, but at least the message box didn't pop up on some hidden desktop and wipe out the ASP.NET worker process. Without assertions, you might as well not program! In the previous edition of this book, I had a bunch of code that developed assertion handling for ASP.NET, but I'm not including it in this version. The great news with .NET 2.0 is the Web Development Server ultimately makes ASP.NET applications nothing more than regular user mode programs that just happen to run through the browser. If you have an assertion in your code, you get to see the exact same message box shown in Figure 3-1. I personally am thrilled that we now have a single way to assert across all types of .NET development. When your application is running under Internet Information Services (IIS) instead of the Web Development Server, your calls to Debug.Assert behave slightly differently. You'll still see the message box from DefaultTraceListener if you are logged into the physical server or are connected with Remote Desktop Program (Mstsc.exe) with /console specified at the command prompt. As you would expect, clicking the Ignore button ignores the assertion, and your application continues what it was doing. Clicking the Abort button unceremoniously terminates the ASP.NET worker process just as it does for any console application. Clicking the Retry button gets a little more interesting. In the Web Development Server, clicking the Retry button calls Debugger.Launch, which brings up the Visual Studio Just-In-Time Debugger dialog box, in which you can choose the debugger with which you want to debug the application. When running under IIS, the Retry button does not trigger the debugger dialog box. While I wish we still had the option to see the dialog box, it does expose a security hole to have the debugger dialog box pop up when the logged-in user might not be someone you want debugging applications. Fortunately, it's easy enough to start the debugger and attach it to the ASP.NET worker process that's showing the assertion. Once you've attached the debugger, clicking the Retry button will break inside the debugger, and you'll be on your way to assertion nirvana. The last point I need to make about assertions in ASP.NET applications is that you must have the compilation element, debug attribute in Web.Config set to true for any calls made in your ASP.NET code to be compiled in through conditional compilation. With the debug attribute set to false, Aspnet_Compiler.exe compiles your binary on the fly without the /define:DEBUG switch passed to CSC.exe or VBC.exe.
SUPERASSERT.NETIn the previous edition of this book, which covered both .NET and native C++ debugging, I presented what I'd like to think was the ultimate in native C++ assertions, SUPERASSERT. Many people liked it, and I've lost track of the number of companies that had integrated the code into their applications. Nothing is better than when I'm working on a super-difficult bug for a client and run across some of my own code in their application. It's happened many times, and it's still an amazing thrill for me to see that someone found my code good enough to use. When we all started turning to .NET development, many people kept asking for a version of SUPERASSERT that worked with .NET. After a lot of thinking, I came up with a version that I first published in my "Bugslayer" column for the November 2005 issue of "MSDN Magazine" (http://msdn.microsoft.com/msdnmag/issues/05/11/Bugslayer/default.aspx). Many people liked it, but that version always bothered me because it just wasn't as useful as the native C++ version. After even more thought, I have finally come up with a worthy successor to the native SUPERASSERT. SUPERASSERT.NET RequirementsAs with any project, you need a good set of requirements so you know what to develop and if you're meeting your goals. Based on the success of the native SUPERASSERT, the idea of a user interface much better than a message box is mandatory to present even more information and, most importantly, allow you to debug deeper without starting a debugger. You'll see some screenshots of the dialog box in a few pages. The user interface is nothing fancy, but it allows you to see the key information quickly and efficiently. The primary mission of the user interface is to offer better assertion-ignoring capabilities. For example, with the DefaultTraceListener, if you had a misplaced assertion that triggered every time through a loop counting to 1,000, you'd see 1,000 message boxes, which would drive you to distraction. With SUPERASSERT.NET, I wanted the option to mark an assertion as ignored for a specific number of times it's triggered. Additionally, I wanted to be able to completely disable a particular assertion for the remainder of the application's instance. Finally, I wanted to be able to turn off all assertions at any time. As you'll see when I start talking about Son of Strike (SOS) and WinDBG in Chapter 6, "WinDBG, SOS, and ADPlus," minidump files of your application are critical to solving the toughest problems. By getting that snapshot of all the memory currently in use, you can start looking at the tough problems, such as why a particular object is in Generation 2 and who's referencing it. When it comes to .NET assertions, you need that ability to write the minidump file to be able to look at the state of the application after the fact, so I wanted to include that functionality in SUPERASSERT.NET. I had two requirements under "getting the information out of an assertion." The first was the ability to copy all the data in the assertion dialog box onto the clipboard. Because SUPERASSERT.NET shows much more data than DefaultTraceListener, I wanted to be able to get all that data to the clipboard. Because I'm talking about the clipboard, I'll toss in here one of my favorite undocumented tricks in Windows: In any application that calls the standard Windows message box, you can press CTRL+C to copy the entire contents to the clipboard, title, text, and even button text. This isn't a screenshot, but the text values of everything in the message box. I have no idea why Microsoft has never documented this wonderful message box shortcut. The second informational requirement is to be able to e-mail the assertion to the developer. This is especially important in testing environments so the tester can get as much information to the developer as quickly as possible. While some of you might be shuddering in horror right now, I assure you that this is an extremely valuable feature. If you're getting the same assertion messages in your inbox repeatedly, that's a very good sign that you need to look at why this particular assertion is popping up all the time. Although Visual Studio is an outstanding debugger, there are times when you need to look at a process with SOS and WinDBG, or its close cousin, the console-based CDB. With Default-TraceListener supporting only managed debugger attaching, I wanted the option to get more debuggers on the process. Additionally, I wanted WinDBG and CDB to have SOS loaded and ready to rock when they attached. The final two features are the big ones. I wanted SUPERASSERT.NET to run perfectly on all operating systems and CPUs that .NET supports. That means handling 32-bit and 64-bit versions in addition to the specific CPU differences. The last requirement sounds simple, but in practice, is extremely difficult: I want to be able to see call stacks from all the threads in the application in addition to all the parameters and local variables. If you look carefully at Figure 3-1, which shows the DefaultTraceListener message box, it's wonderful that you get to see the call stack, but do you see anything that shows the parameter or local values? There's no way to get those values, because if you could, you would break all the security in .NET. For example, if your code is used in a secure context and you can crawl up the stack to look at local variables, you could steal secrets. The same goes for looking at the call stacks of other managed threads in your application. Even though you can get the Process class instance that represents your process and can even enumerate the threads as ProcessThreads, there's no way to get at the call stack. However, when you're debugging, all the information that the great .NET security hides from you is exactly what you need to see. I wanted my code to get that information because the more you can see in an assertion, the less need you'll have for the debugger to do, thus your work will get done faster. Of course, working around the .NET security to show the good stuff is something you'll want to have enabled only in the development shopnot for the customer. Finally, I felt that without the ability to see the other stacks and all their variables, there was no way I was going to be able to call my assertion SUPERASSERT.NET. I know you're dying to see the implementation details to see if I was able to fulfill all the requirements, but I need to show you how to use SUPERASSERT.NET first. Using SUPERASSERT.NETSUPERASSERT.NET is composed of three assemblies that you'll need to incorporate with your application: Caudal.Windows.Forms.dll, Wintellect.Diagnostics.dll, and Wintellect.Utility.dll. Three other applications, DiagnosticHelper-AMD64.exe, DiagnosticHelper-i386.exe, and DiagnosticHelper-IA64. exe, must be in the path on the machine. If you want to e-mail assertions through Microsoft Office Outlook, you'll also need to include Wintellect.Diagnostics.Mail. Outlook.dll. Note that Wintellect.Diagnostics.Mail.Outlook.dll is not built by default because it relies on the Office Primary Interop Assemblies (PIA) and there's no way for me to know which version of Office is on your computer. You can find the main binaries in the .\Debug or .\Release directories in the directory where you installed the book's source code. In the implementation section, I'll describe what each of the assemblies does. With any development tool, there's always the implied requirement that the tool be easy to use. To accomplish that, I derived the SuperAssertTraceListener class in Wintellect.Diagnostics.dll directly from the DefaultTraceListener class, so all the same rules about adding and loading TraceListener classes through code or configuration files apply just the same. Because it's derived from DefaultTraceListener, SUPERASSERT.NET properly pays attention to the assert element's assertuienabled attribute in App.Config or Machine.Config and won't pop up if you don't want it to. Once you have SUPERASSERT.NET integrated into your application, and you encounter an assertion, you'll see the dialog box in Figure 3-2. The text box control at the top of the window shows the message and detailed message parameters you passed to Debug.Assert. You also see the module, source, and line where the assertion occurred. So far, it's the same information you'd see in the standard DefaultTraceListener. Figure 3-2. SUPERASSERT.NET's main dialog box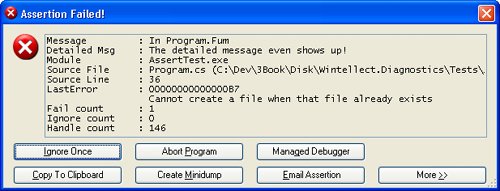 The LastError value shows you the last native Windows error as reported by GetLastError, which can be helpful, especially if you're doing lots of interop. Note that the value displayed here might not have anything to do with the assertion you're seeing. My code saves off the last error value as soon as it's called. However, the last error value could have been changed by a previous TraceListener in the Listeners collection. After the last error value comes the number of times this particular Debug.Assert failed. The penultimate value is the number of times this particular assertion has been ignored. The last value in the edit control is the number of native Windows handles your process currently has open. Leaking handles is a huge problem in both native and managed code. So seeing the total number of handles can, in fact, help you detect potential problems. I'm sure that you can guess what the Ignore Once button does for the current assertion. The Abort Program button is a true death button, as it will call the GetCurrentProcess().Kill() method to rip the process completely out of memory. To save accidental clicks on this button, you'll always be prompted to ensure that this is what you want to do. The Managed Debugger button triggers the managed debugger. If you are debugging the process, it will call Debugger.Break to stop in the debugger. If there is no debugger present, SUPERASSERT.NET will call Debugger.Launch to start the Just-In-Time debugger process so that you can choose the debugger to use. As you would expect, you need to have sufficient operating system privileges to debug the process. The Copy To Clipboard button does exactly what you'd expect and copies all the text values in the dialog box to the clipboard. The Create Minidump button brings up the standard file Save dialog box in which you can specify the name of the minidump file you want to write. If you look at the code, you'll see that I had to do the interop to call the native Windows GetSave-FileName function in order to show the Save dialog box. The reason is that the standard .NET SaveFileDialog class uses COM, so it's not safe to use without an Single Threaded Apartment (STA) main thread, which is an onerous requirement just to use an assertion. The minidump files that I created are the appropriate full-memory minidump files, which means that you can fully use SOS on them and really see what's going on in your application. That also means that minidump files can get huge. For the simple test program, I created full-memory minidump files on Windows XP Professional x64 Edition that were 421 MB! The Email Assertion button allows you to e-mail the assertion to a developer. By default, the To e-mail address will be blank, but a very small change to your code can make it easier for the user. The CodeOwner attribute from the Wintellect.Diagnostics namespace in Wintellect. Diagnostics.dll allows you to specify the e-mail address. Add it to your classes, as shown in the following snippet: [CodeOwner ( "Assertion Report" , "assertreport@mycompany.com" )] class Program ... SUPERASSERT.NET will look up the stack of the assertion for the first class with the CodeOwner attribute and use that e-mail address as the To field for the message. When using the CodeOwner attribute, you probably don't want to include an actual developer name as that address because your binary has the address embedded in it. You'll want to set up a separate account for receiving all assertions or use conditional compilation so that the CodeOwner attribute appears only in debug builds. As I mentioned earlier, if you include the Wintellect.Diagnostics.Mail.Outlook.dll with the code, you could also use Office Outlook to send the message. To choose the e-mail program to use, in the SUPERASSERT.NET dialog box, select Options from the System menu, which you access by clicking the icon in the dialog box's caption bar. On the Mail tab, select the e-mail program to use. Figure 3-3 shows the Options dialog box. As you can see in the dialog box, there are other tabs to set such as the path to CDB.exe, stack walking options, and other options, such as if you want SUPERASSERT.NET to play a sound when it pops up on the screen. Any settings are stored for the user in the appropriate %SystemDrive%\Documents and Settings\user_name\Local Settings\Application Data\Wintellect\SUPERASSERT.NET\version directory. This allows settings that are global for the current Windows user. Figure 3-3. SUPERASSERT.NET Options dialog box
If you've chosen to use the SMTP mail option, SUPERASSERT.NET will assume initially that the appropriate settings are in the App.Config/Web.Config as described in the SmtpClient class. You can change the SMTP settings in the Options dialog box by selecting SMTP Mail as the Default mail plugin and clicking the Plugin Options button. You can also set the same settings when sending a message. If you've chosen Office Outlook to send the messages, things are a little more annoying because the only way to access Office Outlook across all operating systems is through COM. That means that you'll get all the scary dialog boxes about an application accessing your e-mail and have to navigate the timeout dialog boxes. It's enough to make you want to find a virus writer and smack him silly. I strongly suggest that you always use the SMTP e-mail, but depending on how draconian your network administrators are, getting SMTP e-mail set up in your environment may be very difficult. If you can't set it up, you can always use Google's Gmail because it is free and fully supports SMTP sending. It's what I used to test the SUPERASSERT.NET code. Once you click the Email Assertion button, you'll see the dialog box in Figure 3-4, which is the simple e-mail dialog box in which you can type in additional data about the bug. If the user enters her own SMTP settings, she will be prompted for a password when sending messages. No password is stored in any of the SUPERASSERT.NET settings. Figure 3-4. Sending the assertion by e-mail
The More button in the SUPERASSERT.NET dialog box is where the excitement is. Because I don't do much UI programming, I expect you to oooh and aaah every time you click it. The expanded SUPERASSERT.NET dialog box, shown in Figure 3-5, has all sorts of interesting information in it. The Ignore group contains advanced options for disabling specific assertions or even all assertions and should be used with care. Make sure to read the section "A Word About Ignoring Assertions" later in this chapter. Figure 3-5. The expanded SUPERASSERT.NET dialog box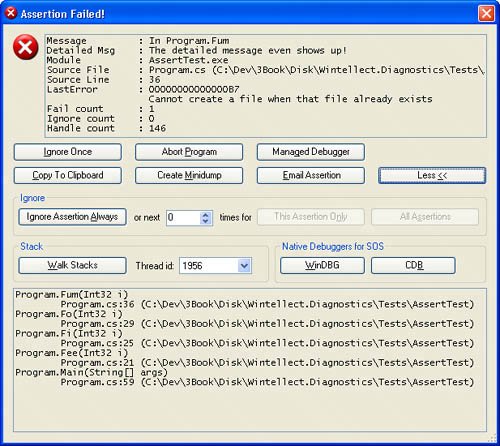 The Native Debuggers for SOS section allows you to choose which debugger you want to spawn to look at the process with SOS. When you start one of the native debuggers, SUPERASSERT.NET automatically loads SOS in the native debugger, so you're all set to start exploring to your heart's content. When you are finished poking at the process, use the qd command to detach and quit the debugger to return to the asserting process. Looking at the dialog box in Figure 3-5, you can see that the stack walk shown looks identical to what you'd see in regular DefaultTraceListener, and you're wondering what the excitement is all about. The magic begins when you click the Walk Stacks button. The edit control that contained the stack turns into a tree control, and as you start clicking the plus signs, or right-clicking and selecting Expand All, a big smile will appear on your face. I almost didn't include a screen shot here because the effect the first time you see it is quite amazing! Since a picture is worth a thousand words, I need to include one so I can explain what's going on. Figure 3-6. The amazing SUPERASSERT.NET!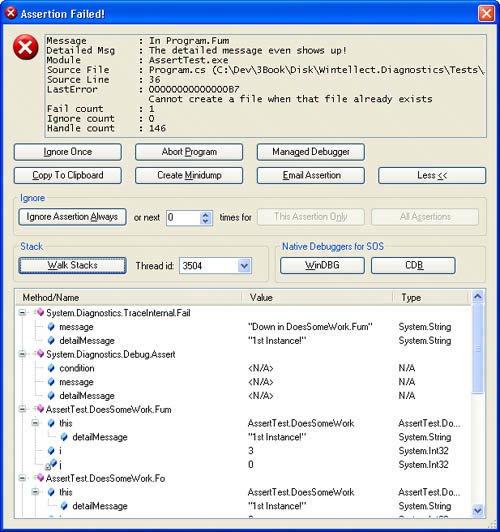 What you're seeing in the tree control are all the methods on the stack, their parameters, and their locals, and you have the ability to expand objects to show all the field values. The blue icons with the lock next to them denote local variables. What I can't show in the book text is clicking the Thread id combo box and showing you that you'd be looking at the call stacks with full detail for any other managed thread in your application. Of course, if you do show the cool stack display, all the call stack data is copied to the clipboard and any e-mail messages you send from SUPERASSERT.NET, just as you would expect. The object expansion defaults to a single level, so you'll see parameter and local object fields. If you need to drill down more, go into the SUPERASSERT.NET Option dialog box, and on the Stack Walking tab, set the Stack variable expansion up-down control to the level you want. You can also elect to have arrays expanded in the display. After changing the values and closing the dialog box, click Walk Stacks again in the main dialog box to see the changed expansion. Because SUPERASSERT.NET has to gather all the thread detail at once, you'll want to be careful about expanding too far because you'll use a ton of memory and it will take quite a while to generate the data. Console and Windows Forms applications in addition to any ASP.NET applications running under the development Web server will now have all the glory of SUPERASSERT.NET to help keep you out of the debugger more than ever. Of course, things are a little different if you're running an ASP.NET application under Internet Information Services (IIS). The rules are different there, and there's no clean way to show Windows Forms or spawn applications because both would potentially open security holes. Consequently, SUPERASSERT.NET degrades gracefully by falling back to the DefaultTraceListener to generate the output. It's not ideal, but it's better than changing the account IIS runs under and having it interact with the desktop. If you are going to those extremes, that's exactly what the development Web server is all about. A Word About Ignoring AssertionsIt's always a bad moment when another developer or tester drags you over to his machine to blame your code for a crash. It's even worse when you start diagnosing the problem by asking him if he clicked the Ignore button on an assertion that popped up. Many times he'll swear to you that he didn't, but you know that there's no way that crash could have occurred without a particular assertion trigger. When you finally pin him down and force him to admit that he did click that Ignore button, you're on the verge of ripping his head off. If he had reported that assertion, you could have easily solved the problem! The Ignore button, if you haven't already guessed, is a potentially very dangerous option because people are so tempted to click it! Although it might have been a little draconian, I seriously considered not putting an Ignore button on SUPERASSERT.NET to force users to deal with the assertion and its underlying cause. I specifically added the ignore count to the upper text box to ensure an easy way to check whether a specific assertion has been ignored. This allows you to see at a glance if the Ignore button has been clicked before wasting your time looking at the crash. What you might want to consider adding to the Debug.Listeners collection is a second listener, such as the FixedTextWriterTraceListener, so you have complete logging of all assertions that are triggered. That way you'd automatically have a running total of the number of Ignore values clicked by users, allowing you to validate the user actions that led to the crash. Some companies automatically log assertions to a central database so that they can keep track of assertion frequencies and determine whether developers and testers are improperly using the Ignore button. Since I've talked about protecting yourself against the user's reflex reaction of clicking the Ignore button, it's only fair that I mention that you might be doing it, too. Assertions should never pop up in normal operationonly when something is amiss. Here's a perfect example of an improperly used assertion that I encountered while helping debug an application. When I chose an item on the most recently used menu that didn't have a target item, an assertion fired before the normal error handling. In such a case, the normal error handling was more than sufficient. If you're getting complaints that assertions are firing too much, you need to carefully analyze whether those assertions really need to be there.
SUPERASSERT.NET ImplementationI do have to admit that I had a great time developing SUPERASSERT.NET. In the end, I wrote four different versions of the core code to achieve the results. While I was able to achieve my ultimate goal, I also learned a good bit of .NET along the way. Most of the assertion code is in the Wintellect.Diagnostics.dll assembly, so you might want to open that project to follow along as I describe some of the initial interesting highlights. As I mentioned, SUPERASSERT.NET starts out as a TraceListener, SuperAssertTraceListener, derived from DefaultTraceListener. All of the work takes place in the overridden Fail method. The first challenge I had to tackle was trying to figure out how to uniquely identify the spot where the assertion occurred so I could keep track of the assertion count. Because the StackTrace class always returns a stack starting at the location where it's created, I had to walk the frames back to the point before the call to Debug.Assert so I would not be showing a call stack starting inside SuperAssertTraceListener. Realizing that I now had the location where the call occurred, I could use the StackFrame class for that location to build up a unique key because it has the class, method, and module name, along with the IL offset into the module making the call to Debug.Assert. That meant that I could just toss all the assertions I saw into a hash table so I could keep track of the number of times triggered, and I could ignore counts easily. If the assertion is not ignored, the next challenge in SuperAssertTraceListener.Fail is to figure out if it's safe to show the assertion dialog. Because I wanted to respect the DefaultTraceListener assertuienabled attribute, I started looking at how I was going to read App.Config and Machine.Config to determine if they were set. It was looking as if it were going to be quite hard to do the configuration parsing because the configuration classes provided by the Framework Class Library (FCL) were returning an internal-only class, SystemDiagnosticsSection, which was causing all sorts of InvalidCastExceptions when I'd try to access it. Thinking I was going to have to do my own XML parsing, I was getting a little desperate when I saw the DefaultTraceListener. AssertUiEnabled property, which does all the work I needed. There's nothing like trying to completely reinvent the wheel. Checking if the user interface is enabled is only the first check I needed to make before I could bring up the dialog box. In order to play well in a limited-rights settings, I demand unrestricted UIPermission rights. The DefaultTraceListener does not need full rights, but my dialog box is doing much more than a message box, so I need full UIPermission to have any hope of it to work. If the configuration settings are for no user interface or there are insufficient rights to show a full user interface, I'll call the DefaultTraceListener.WriteLine method to at least log that an assertion occurred. See the SuperAssertTraceListener.UiPermission property for how I demand the appropriate permissions. The final check is the usual SystemInformation.UserInteractive to see if the process is running in user interactive mode. Form.ShowDialog makes the same check and will throw an InvalidOperationException if you call it without checking first. If I can't show my dialog box in this case, I'll try calling the DefaultTraceListener.Fail method because it will just show a message box and, as I explained earlier, you'll at least see that with ASP.NET under IIS. If you are familiar with my native SUPERASSERT, you know that it has a very cool feature that would suspend all the other threads in the application other than the one with the assertion. This allowed the assertion to have as minimal an impact on the application as possible. In showing the new SUPERASSERT.NET to numerous developers, they asked if I kept that excellent feature. If you think about it for a moment, that would be a very bad idea in the .NET world. What's one of the most important threads in .NET? The garbage collector thread! Because SUPERASSERT.NET uses .NET, I'd end up deadlocking or terminating the process if I suspended all other threads, which would not make my assertion very useful. The assertion dialog box itself, which is in AssertDialog.cs, is derived from Wintellect.Utility.System-MenuForm, which allows me to easily add the Options and Center on Screen commands to the system menu. If you're interested in how to make your own folding dialog boxes, you can search for the Folding/Unfolding Handling region, which shows how it's done. There are only two key items about the user interface I wanted to point out. The first is that clicking the Abort Program button calls Process.GetCurrentProcess ( ).Kill ( ), which is identical to calling the TerminateProcess API. I originally started to call the .NET Application.Exit method, but looking at what it does with Lutz Roeder's Reflector (http://www.aisto.com/roeder/dotnet/), it is a little too kind in how it asks the windows and threads in your application to shut down. Because an assertion is indicating that you have a bad state, I felt that it was safer to have this button do the death kill to avoid partial transactions or race conditions. The last interesting thing in the user interface was getting the clipboard to always work. Like the OpenFileDialog, the ClipBoard class in .NET relies on COM to do some of its work. While we would all love for COM to finally die the hard death it deserves, we're stuck with it and its nasty Single Threaded Apartment (STA) model. In order for it to work, the clipboard code requires that your thread be marked with the STAThreadAttribute. I wanted to solve this because that is an onerous requirement and because copying the assertion data is so important. I was all set to do the interop work to directly call the Windows clipboard API functions when I ran across a cool trick from Jeff Atwood (http://www.codinghorror.com/blog/archives/000429.html): spawn your own thread, set its state to STA, and do the clipboard operation in that thread. I wrapped up Jeff's idea in the Wintellect.Utility.SmartClipboard class so you could reuse it. The first major hurdle I wanted to tackle was getting a minidump file of the process written. It's simple enough to make a call to MiniDumpWriteDump, the Windows API that does all the work, but that minidump file won't be readable by any debugger. The problem is that the API is designed for writing dumps of other processes, not for being called from your own process. In the native version of SUPERASSERT, I used inline assembly language to simulate making the call to MiniDumpWriteDump and allow you to write a perfect minidump file from inside your own process. Even though there's no inline IL in .NET applications, which is a scary thought all on its own, I figured there had to be a way I could do some Ninja hacking and get MiniDumpWriteDump working inside the process. Alas, no amount of sneaking around the code in a black suit worked. I tried everything to get this working inside the process with just .NET code. The only way I was able to write a minidump file from inside the process was to write a native C++ DLL that mimicked the way I had done the writing in the native version of SUPERASSERT. Given the fact that I was then going to have to support three separate DLLs, one for each CPU type .NET runs on, that was going to be a mess to manage. However, I could get good minidump files from MiniDumpWriteDump when using it to write dumps of other processes. That meant that to keep the code all .NET, I was going to have to write a process that my assertion would spawn. The assertion code would pass on its process ID or name on the command line to this other program to tell it what to dump, which is basically the same thing as writing the dump from inside my own process. Although it's not exactly how I wanted the code to be, the DiagnosticHelper executables achieves the desired result of a minidump file that SOS can process. The big feature of course, is getting all the thread's call stacks and variables. As you can guess, that one was the hardest to get working. At the initial glance, I thought it might be relatively easy because I'd noticed in the .NET Framework 2.0 documentation that the StackTrace class has a new constructor that takes a Thread object. The idea is that you can pass in any Thread object and get that thread's stack. That gave me some hope of enumerating the threads from inside the application and getting their corresponding Thread objects. You may have noticed that the Process.Threads property is a ProcessThreadCollection that contains the ProcessThread objects for all the native threads in the process. Thinking that there might be a way to convert those ProcessThread objects into the equivalent Thread object, I spent some serious quality time with the compiler and Reflector trying and looking at ideas. Alas, there's absolutely no way to get the list of Thread objects that I could in turn pass to StackTrace. Even if I could, that would still not achieve the goal of getting the locals and parameters. What I really wanted was a way that I could work around the whole security system in .NET so I could get those locals and parameters. Although the security protections are a great feature of .NET, they can sometimes get in the way of fun tools. If given enough time, I probably could find some way to wander the stack and extract the locals, but I certainly wouldn't be doing it from straight .NET code. That meant that I had to do some serious thinking and look at the big picture. As we all know, a debugger can see everything inside a process. My thinking was that there was nothing stopping me from spawning off a debugger on myself. That would definitely work and get me the information that I wanted to present. Because I already had the dialog box set up to spawn off CDB, I couldn't see any reason why I couldn't tell CDB to load SOS and gather all the data for me. When I presented the first version of SUPERASSERT.NET in my Bugslayer column, that's exactly what I did. I created a temporary file with the commands to execute and passed that on the CDB command line. Those commands loaded SOS, opened up a logging file I specified, and ran the SOS !clrstack command to perform the magic. The bad news was that the !clrstack command is essentially broken and doesn't always return the parameters and locals correctly. The other problem with this approach is that you're required to install the Debugging Tools for Windows on every machine to have access to CDB. To get what I wanted, I turned next to the CLR Debugging API, which you can read about at http://msdn2.microsoft.com/en-us/library/ms404520(VS.80).aspx. This certainly looked like the way to go, but with approximately 102 COM interfaces, I certainly wasn't looking forward to grinding through writing a native C++ EXE to be a debugger. Just as I was starting to sketch out exactly what I was going to have to do, the CLR Debugging Team handed all of us a major present: the CLR Managed Debugger Sample, also known as MDBG. You can download MDBG at http://www.microsoft.com/downloads/details.aspx?familyid=38449a42-6b7a-4e28-80ce-c55645ab1310&displaylang=en. As part of their internal testing of the debugging APIs, the CLR Debugging Team had written a test system completely in .NET that wrapped the entire COM-based API. This eventually evolved into MDBG, and they released it as source code so others could write debugging tools without grinding through the mind-numbing COM interfaces. The CLR Debugging Team did a major service to the community by releasing this code and certainly made my life a heck of a lot easier! This meant that I could do a complete .NET solution for the debugger portion. From a high level, the idea is to spawn the debugger and have it attach back to the process with the assertion. Once attached, it will open up a file where it can write data. The debugger will enumerate the threads and walk the stack for each thread. In each stack frame, it will dump the parameters and locals. The code I wrote turns out to be almost as easy as that description. Listing 3-2 shows the .\DiagnosticHelper\StackWriter.cs file that does the work to do all the CLR debugger work and stack writing. As you can see, most of the code is concerned with writing out the XML file. If the code looks a bit familiar, that's because it's based on a blog entry by Mike Stall, http://blogs.gotdotnet.com/jmstall/archive/2005/11/28/snapshot.aspx. Mike is a developer on the CLR Debugging Team, and you definitely need to subscribe to his blog because there are all sorts of interesting tips about debugging and using the CLR Debugging API.
As you read Listing 3-2, you can see how trivial it actually is to attach a debugger to the process. You create an instance of MDbgEngine and call its Attach method. Right after you attach, in a regular debugger, you'd ask for notifications for all thread creates, module loads, and other interesting events, because that's the CLR Debugging API telling you what's in the process. In the case for my code, I don't care about those, so I'm going to drain all of those off events in the DrainAttachEvents method at the bottom of the file. The CLR Debugging API is interesting because of the fact that if you attach to a process that has no .NET in it, the CLR Debugging API will wait in the process until the hosted runtime shows up. In my case, I want only to do the actual debugging attach if .NET is already loaded and running in the process. Consequently, before I call Attach, I take a quick peek to ensure that MScorwks.dll is loaded in the process. If it's not, I'll report that there's no .NET in the process. If SUPERASSERT.NET spawns the DiagnosticHelper code, .NET is there and running. However, there's nothing stopping someone from executing the DiagnosticHelper executable from a command prompt. I wanted to handle the case in which .NET wasn't loaded. The reason is that the DiagnosticHelper code will just sit there until .NET loads. If you accidentally attach to Notepad.exe, you're going to be waiting a very long time for .NET to load. The DumpAllThreads and DumpFrame methods take care of enumerating the threads and call stacks respectively. While I could have chosen to show threads that had native code or managed-native transitions, I chose to limit the dumping to only the managed code parts. If you would like to extend SUPERASSERT.NET, it would be nice to offer the option to show all the data. The DumpFrame method is also where the key work of dumping out the parameters and locals occurs. In .NET applications, you'll always have the parameter values because that information is part of the metadata in the assembly itself. The locals are part of the .pdb files, so unless they are found by the CLR Debugging API, you won't see them. The .pdb files are loaded only locally, not out of your Symbol Server, so they must be next to the binaries in the file system. I don't know about you, but it amazes me that 388 lines of code, including comments, can do that much work. Whereas it's easy to use the CLR Debugging API, integrating it into your application is a completely different matter. Originally, I had my DiagnosticHelper executable linking against the MDBGCore.dll that shipped as part of the Framework SDK. In a meeting with the CLR Debugging Team, they pointed out two issues with that version of MDBGCore.dll. The first was that there were numerous bugs fixed in the released MDBG source code, so I'd be much better off with that version. The second was that the licensing agreement would not allow me to redistribute that DLL. When I started linking my code against the MDBG source code versions, I found that parts of the MDBGCore.dll had been pulled out into separate DLLs, MDBGEng.dll, Corapi.dll, and Corapi2.dll. Because I didn't want to add three more DLLs to what you had to distribute, I started looking for a way to combine the code for those DLLs into the actual DiagnosticHelper executable. My initial thought was that I could use Michael Barnett's excellent ILMerge utility (http://research.microsoft.com/~mbarnett/ilmerge.aspx) to combine the binaries together. ILMerge will take separate .NET assemblies and mash them together into a single assembly. The .NET 2.0 version also merges the .pdb files together so you'll have full source debugging. Initially, this approach worked, and I was very happy to have a single DiagnosticHelper.exe that took care of minidump file writing in addition to the stack walking. Regrettably, I ran into a problem with my DiagnosticHelper.exe. I had a utility that did a ton of interop, and I recompiled it to run under .NET 2.0 so I could take advantage of the better startup performance and working set tuning. Because I didn't want to tackle the many P/Invoke declarations to ensure that it worked with 64-bit, I took the easy route and set the compiler's /platform switch to x86 to force the utility to run with the 32-bit version of the CLR when running on my x64 machine. Being the good developer I think I am, I added SUPERASSERT.NET through the App.Config file so I could get the killer assertion dialog box. On the first assertion in my utility, I clicked the Walk Stacks button and was looking at a crash dialog box from the spawned off Diagnostic-Helper.exe. The unhandled exception follows and is wrapped for readability: Unhandled Exception: System.ComponentModel.Win32Exception: Only part of a ReadProcessMemory or WriteProcessMemory request was completed at System.Diagnostics.NtProcessManager.GetModuleInfos(Int32 processId, Boolean firstModuleOnly) at System.Diagnostics.Process.get_Modules() at DiagnosticHelper.StackWriter.IsDotNetInProcess() in C:\Dev\3Book\Disk\DiagnosticHelper\StackWriter.cs:line 343 at DiagnosticHelper.StackWriter.Execute() in C:\Dev\3Book\Disk\DiagnosticHelper\StackWriter.cs:line 58 at DiagnosticHelper.Program.Main(String[] args) in C:\Dev\3Book\Disk\DiagnosticHelper\Program.cs:line 79 The exception is occurring at the for loop in IsDotNetInProcess where I'm calling targetProc. Modules.Count to get the module count. I was quite stumped when I ran the AssertTest.exe program, which is the unit test for the whole SUPERASSERT.NET code, and was able to manually execute the exact same DiagnosticHelper.exe and get the correct stack output. Whenever I ran DiagnosticHelper.exe against my utility, I always had the unhandled Win32Exception. That's when it dawned on me that what was happening was as I described in Chapter 2; the default on Win64 systems is for the .NET application to run as a 64-bit binary. My 32-bit utility was asking a 64-bit binary to walk its stack, and the CLR Debugging API does not support that. I thought that all I would have to do is build the DiagnosticHelper.exe code, set the /platform switch to the three CPUs that .NET runs on, run ILMerge on each of those to jam in the three MDBG DLLs, and I'd be set. The first run of ILMerge gave me an error stating that it did not support merging assemblies that had different PE architectures set, so the only step left was to bring the source code for the three MDBG DLLs I needed into DiagnosticHelper and build it three different ways. I was already going to have three separate DiagnosticHelper-CPU.exe programs, and I didn't want a total of three separate MDBG DLLs just to run ILMerge on them. Of course, I would immediately run into a doozy of a problem bringing the code together: Corapi2.dll is written entirely in IL. That's the DLL that has all the P/Invoke marshalling definitions in it. I'm not sure why it's all written in IL when it could have accomplished the same thing in C#. However, I was certainly not looking forward to the prospect of manually converting all the IL to C# to bring it into the DiagnosticHelper project. Fortunately, I'm a man armed with tools and wouldn't let the piddling problem of different languages stop me. I took the compiled Corapi2.dll, loaded it into the amazing Reflector, loaded Denis Bauer's fantastic Reflector.FileDisassembler add-in (http://www.denisbauer.com/NETTools/FileDisassembler.aspx), and decompiled the IL directly to C#. I threw the output files together into the DiagnosticHelper project along with the C# source code for MDBGEng.dll and Corapi.dll and had everything compiling together in no time. In the .\DiagnosticHelper directory are the three different projects that all contain the same source files but compile to the three CPU-specific versions. I also updated the AssertDialog.cs file, where Diagnostic-CPU.exe is started, to look at the ImageFileMachine type of MScorlib.dll because that has CPU-specific code in it so it always will reflect the type of runtime you're actually executing under. The Wintellect.Utility.RuntimeInfo class does the actual work, and you can look at that code if you're curious. The DiagnosticHelper-CPU.exe utility might be something you want to consider using on its own because it can generate minidump files and call-stack XML files any time you need them. I've found it much easier to use in ASP.NET test systems than messing with WinDBG or CDB to simply snap a minidump file. Run the CPU-specific version you need at a command prompt to look at all the options you can pass to the program to output the dumps or call stacks any way you want. To display the cool tree list view, I used an article from the always excellent Code Project by Thomas Caudal (http://www.codeproject.com/cs/miscctrl/treelistview.asp). The code was written for .NET 1.0 and was three years old when I looked at it. I ported the code over to .NET 2.0 and tweaked the code to work on all Microsoft operating systems. Note that I concentrated only on the parts of the code I needed for SUPERASSERT.NET, so not everything's been tested under .NET 2.0. I greatly appreciate Thomas's letting me use his code. In the .\Caudal.Windows.Forms\Test\StackReader directory is a standalone test program that will let you view DiagnosticHelper-CPU.exeproduced stack walks. It was the unit test for the control, but it's there if you need it. It's not built as part of the normal book code build, so you'll need to build it on your own. |
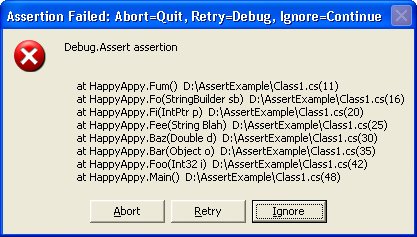
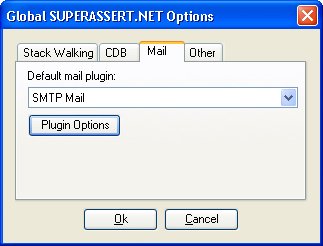
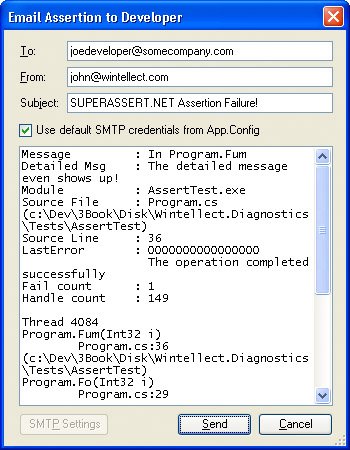
EAN: 2147483647
Pages: 99