Tips and Tricks
|
Before I turn to ILDASM and the fun of Microsoft intermediate language (MSIL), I want to cover a few tips and tricks for managed code.
DebuggerStepThroughAttribute and DebuggerHiddenAttribute
Two very interesting attributes show the real power of attributed programming in .NET: DebuggerStepThroughAttribute and DebuggerHiddenAttribute. They can be specified on properties, methods, and constructors, but the common language runtime (CLR) never looks at or uses them. However, the Visual Studio .NET debugger uses them at run time to control how stepping occurs. Before I describe how to use DebuggerStepThroughAttribute and DebuggerHiddenAttribute, I must warn you that if you're not careful, these attributes can make debugging your code extremely difficult (if not impossible), so use them at your own risk. You've been warned!
The more useful of the two attributes is DebuggerStepThroughAttribute. When this attribute is applied to classes, structures, constructors, or methods, the Visual Studio .NET debugger automatically steps over those items even when you use the Step Into command. You can still set breakpoints in the items if you do want to debug them. This attribute is best used on items that have only a single line of code in them, such as get and set accessors. You'll also see this attribute used with the InitializeComponent method, added automatically by the Visual Basic .NET Windows Forms Designer–generated code. You might want to add it to your C#, J#, or Managed Extensions for C++ Windows Forms InitializeComponent method.
Whereas DebuggerStepThroughAttribute at least lets you set breakpoints, DebuggerHiddenAttribute both hides the method or property it is applied to and doesn't allow any breakpoints to be set within that method or property. I would strongly discourage you from using this attribute because using it means that you can't debug that part of the code. However, it might come in handy to completely hide internal methods. DebuggerHiddenAttribute won't be a foolproof antidebugging technique because it's up to the debugger implementers to read the metadata for the attribute. As of the time of this writing, Visual Studio .NET and the .NET Framework SDK debugger, DBGCLR.EXE, respect the attribute, but CORDBG.EXE does not.
Mixed Mode Debugging
Debugging a native code DLL at the source level when it's brought into a managed application is called mixed mode debugging. The first step to starting mixed mode debugging is figuring out how to turn it on. Figure 6-5 shows the setting for C# applications, and Figure 6-6 shows the setting for Visual Basic .NET applications. For the life of me, I still can't figure out why two completely different property page settings for C# and Visual Basic .NET are necessary when all the command-line options to the compilers, as well as most of the settings, are essentially identical.
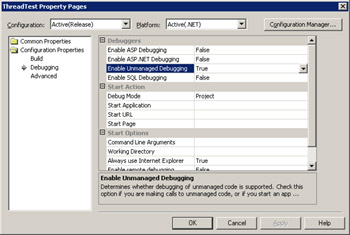
Figure 6-5: Turning on mixed mode debugging in a C# project
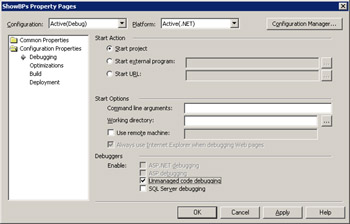
Figure 6-6: Turning on mixed mode debugging in a Visual Basic .NET project
The biggest drawback to mixed mode debugging is that it can be very slow. Your best bet is to take care of your managed and native debugging separately if possible. If you have to do mixed mode debugging, you should first turn off property evaluation, as shown in Figure 6-7, because most of the slowing down is related to the work necessary to evaluate items in the Watch window family. After turning off the property evaluation, mixed mode debugging is still slower than straight managed or native debugging, but it is faster than if you leave it turned on. One big difference between straight managed debugging and mixed mode debugging is that if you have mixed mode debugging on, you can right-click in the Modules window and select Show Modules For All Programs, which allows you to see all the modules loaded by your managed process.
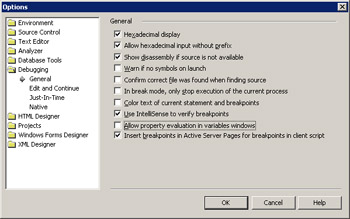
Figure 6-7: Turning off property evaluation
There are also a few smaller drawbacks to mixed mode debugging. The first is that even though you are doing native mode debugging on the process, you can't use any data breakpoints, which I'll discuss in the next chapter. Additionally, you cannot create mini dumps of the process, unless the debugger is sitting in a native function call.
Remote Debugging
Microsoft deserves a Nobel Peace Prize for helping to bring peace between two of the most contentious groups in history, developers and network administrators. Prior to managed applications, developers had to be part of the Administrators group on any machine they were going to use for debugging applications. However, when developers needed to debug on a production server, network administrators were very reluctant to give them that much power over the system—especially because developers occasionally abused that power and changed system settings that would, for example, force administrators to change their passwords for every login and require that password be 65 characters long. Not that I have done that, but I have heard tales about others who have done it.
The process that brought peace to all is remote debugging. I don't want to rehash the documentation here, but I do want to clear up a few issues I consistently hear developers ask about in regard to setting up and using remote debugging. The first is that you don't have to install a full copy of Visual Studio .NET on the remote machine for remote debugging to work; you need only the remote debugging components of Visual Studio .NET. Install the remote debugging pieces by clicking the "Remote Components Setup" link at the bottom of the Visual Studio .NET Setup application, as shown in Figure 6-8. In the screen that pops up, follow the directions under Full Remote Debugging Support and install the .NET Framework on the machine before clicking the Install Full button. It's very easy to forget to install the .NET Framework SDK, and if you do forget, you'll be scratching your head wondering why you can't debug or run any managed applications. Keep in mind that even though you don't have to be a part of the Administrators group to do remote debugging, you must be a member of the Administrators group to install the remote debugging components.
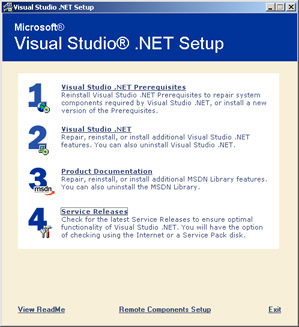
Figure 6-8: Installing just the remote debugging portion of Visual Studio .NET
The whole key to remote debugging is ensuring your account is in the Debugger Users group on the remote machine. Of course, to be able to add users to the Debugger Users group, you must be a member of the Administrators group on that machine. The most common problem I've seen with setting up remote debugging is forgetting to add your account to the Debugger Users group on the remote machine.
This can be a very common error when debugging XML Web services. Either in your code or in the Watch window, set the TimeOut property on the XML Web service object to -1 to indicate infinite timeout.
|
EAN: 2147483647
Pages: 177