Working Set Tuning
|
What you might intuitively realize but don't consider the ramifications of is that when you compile and link your binaries, the linker simply orders the functions starting with the first OBJ file first, the second OBJ second, and so on. In other words, the functions are placed in order of link, not in order of execution. However, the problem is that this process doesn't take into account the locality of the most commonly called functions.
Figure 19-1 shows a stylized example of what happens. In this example, the operating system supports only six fixed-length functions per memory page and can hold only four pages in memory at a time. Additionally, the 10 functions being called are the most commonly called functions in the program.
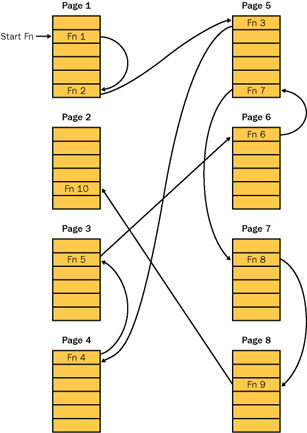
Figure 19-1: Model nonoptimized system
When the operating system loads the program in Figure 19-1, it naturally loads the first four pages of the binary in memory. The first function executes and calls function 2, which happens to reside in the same page. However, function 2 calls function 3, which resides in page 5. Since page 5 isn't in memory, a page fault occurs. Now the operating system has to throw out one of the loaded pages. Since page 4 hasn't been touched, the operating system throws it out and in its place puts page 5. Now it can execute function 3. Unfortunately, function 3 calls function 4, which happens to reside in page 4, which was just swapped out, so our second page fault occurs. The operating system will have to swap out page 3, as it's the least recently used, so it can bring page 4 back into memory to execute function 4. As you can see, another page fault will happen because function 4 calls function 5, which was just swapped out. Feel free to continue to walk through all the calls, but as you can see, there's lots of work going on in those page faults.
The key issue to remember here is that page faults take huge amounts of time to process. The program shown in Figure 19-1 is spending a lot of time in the operating system code instead of executing. If we could specify the function order regarding how the linker puts the code in the pages, we could avoid much of the overhead necessary to process all those page faults.
Figure 19-2 shows the same program after all the most commonly called functions have been packed together and moved to the front of the binary. The program as a whole takes the same amount of memory, the four page limit, but because the most commonly called functions are now packed together, they don't cause any page faults while calling each other, and the application runs faster.
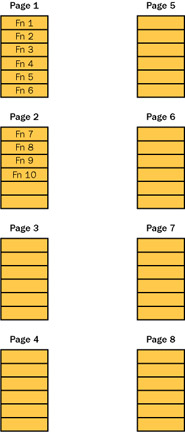
Figure 19-2: Model optimized system
The process of finding the most commonly called functions so that you can reorder them is called working set tuning and is a two-stage process. The first stage is to determine which functions are called the most, and the second stage is to tell the linker how to order the functions so that everything is packed together.
The work involved in counting the function executions is all hidden by SWS, and I'll discuss how you do it in the next section, "Using SWS." Telling the linker what order to put the functions in is fairly trivial. You do this through the /ORDER command-line option to LINK.EXE. The parameter to the /ORDER option is simply a text file, called the order file, which lists each function on a single line in the order in which you want them to appear. Interestingly, each of the functions listed in the order file must be in its full-name decorated glory. Essentially, the idea behind SWS is to produce the order file for your application.
Those of you who are old Microsoft Windows salts like me might have the initials WST floating around in the back of your head right now. WST stands for Working Set Tuner. It was a tool that Microsoft used to distribute with the Platform SDK to do, well, working set tuning. However, you might also remember three distinct facts about WST: the first is that it was extremely difficult to use, the second is that it was broken quite a bit, and the third is that it's no longer on the Platform SDK. SWS is a much easier-to-use replacement for WST.
For more background on working set tuning and an excellent primer on Windows performance, I strongly suggest you see whether you can find Volume 4 of the Microsoft Windows NT 3.51 Resource Kit, Optimizing Windows NT (Microsoft Press, 1995), which was written by Russ Blake and is an excellent introduction to the topic. Russ was in charge of performance tuning on the Microsoft Windows NT team. The book used to be on MSDN, but alas, it's since disappeared. Russ's team developed WST and in his book, Russ says you should see a 35–50 percent reduction in your working set after using a working set tuning tool. Any time your application can lose that much fat, you should sit up and take notice!
Before I jump into using SWS, I need to pause for a reality check. First, SWS isn't a magic elixir. If you have terrible performance before running SWS, you'll have terrible performance after running SWS. Second, tuning your working set should be the final performance tweak you perform after you've perfected your algorithms and taken care of any incidental performance bugs you find. Finally, you should be concerned about running SWS only towards the end of the development cycle. You need the code changes to be on a rapidly decreasing curve to ensure you get the benefits of SWS.
Sometimes you might not need to run SWS. If you have a small application whose total compiled size for all binaries is less than 2 to 3 MB, you might not see any working set reduction at all. The maximum benefit is achieved when you tune the working set on larger applications because the more pages you have, the more room there is for improvement.
Although you can always use PerfMon to perform a quick check, nothing is better than the amazing Task Manager. In the Processes tab, you're allowed to add a column that reports various performance monitor statistics. Since resources are handle-based, you'll need to monitor the handle count for the process. Activate the Processes tab, choose Select Columns from the View menu, and in the Select Columns dialog box, check Handle Count. If you need to watch GDI objects, check GDI Objects as well. Figure 19-3 shows both columns added to Task Manager, sorted by handles.
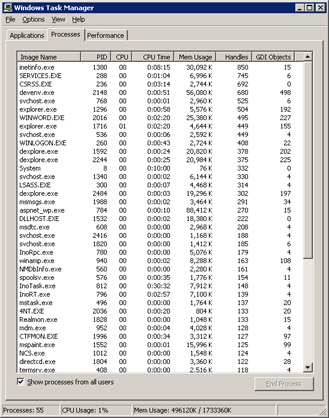
Figure 19-3: Task Manager showing handles and GDI objects
By default, Task Manager automatically updates every few seconds, but you'll have to keep an eye on the handle or GDI values to determine whether the value is sliding up. What I like to do is pause the updating by setting the Update Speed menu to Paused on the View menu. This way I can perform an operation, shift back to Task Manager, and press F5 to update the display. Make sure you also watch the Mem Usage column because handle values are backed by memory—if both are sliding up, you're seeing a resource leak in action.
|
EAN: 2147483647
Pages: 177