Debugging Services
|
As you've seen, the unique nature of services alone means that you need to deal with many issues that don't come up when you're programming regular user-mode applications. Keep in mind that the discussion so far has been about the bare minimum functionality necessary for getting a service up and running. I haven't even touched on the fundamental requirement of ensuring that your general algorithms and implementation work for the one-of-a-kind pieces of your service. The easiest and best way to debug services without becoming completely overwhelmed is to approach the debugging in stages.
Two main stages are involved when you're debugging services:
-
Debugging the core code
-
Debugging the basic service
In the following sections, I'll describe what you need to do in each stage to make sure that you stand the best chance of debugging your service with a minimal amount of hassle.
Debugging the Core Code
Before you even consider running your application as a service, you need to run and test your application as a standard user-mode executable until you've debugged all your core code. Once you've done that, you can start working on the issues specific to services.
When debugging your core code, you should debug everything on the same machine, running under your developer account; that is, your service core code as well as any client code should be on the same machine. With this approach, you won't have to worry about any security or network issues. Once you debug your logic, you can move on to the joy of other problems you'll encounter with services, such as security and service initialization orders.
COM+ Services
If you're building a COM+ service with the Active Template Library (ATL), you don't have to do anything with security. By default, ATL runs as a user-mode executable until you register your application with the -Service command-line option.
ISAPI Filters and Extensions
The exported functions you must provide for your filters and extensions are fairly simple, and you can easily write a test harness that acts as a fake IIS system. You can test all your core algorithms in a controlled environment so that you have them completely debugged before you run your service under IIS proper.
Exchange Server
You can build Exchange Server services that run as console applications if you use the helper functions in WINWRAP.LIB. Starting your service with the notserv startup parameter will force running as a normal process. The notserv parameter must be the first parameter specified.
Debugging the Basic Service
After you test and debug your general logic, you can start debugging your code while running as a service. All your initial debugging should take place on a system on which you can control everything. Ideally, you should have a second machine sitting right next to your main development machine that you can use for your initial debugging. The second machine should have the version and flavor of Windows you're recommending to your customers for the environment your service will run under. Whereas the reason for debugging the core code was to verify your basic logic, the reason for preliminary service debugging is to shake out your basic service-specific code. You need to complete four tasks as part of debugging your first-cut service code:
-
Turn on Allow Service To Interact With Desktop.
-
Set your service identity.
-
Attach to your service.
-
Debug your startup code.
As I discuss each task, I'll mention particular issues relevant to the different technologies as appropriate.
Turn On Allow Service To Interact With Desktop
No matter what type of service you're debugging, you'll want to turn on Allow Service To Interact With Desktop on the Log On tab of your service's Properties dialog box. Although you shouldn't have any user interface elements with your service, having assertion notifications that allow you to gain control with the debugger is very helpful. Assertion notifications combined with excellent logging code, such as the code that ATL gives you for writing to the event log, can make it much easier to debug services.
In the initial stages of development, I turn on SUPERASSERT dialog assertions just so that I can quickly gauge the general health of my code. (For more information on SUPERASSERT, see Chapter 3.) As I get more and more of the service running, however, I set the assertion options so that all assertions just go through trace statements.
Until I'm confident of the service code, I generally leave the Allow Service To Interact With Desktop setting checked. One nasty bug that cropped up in a service I once wrote took me a while to track down because I turned off this option and I still had a message box that popped up. Because the operating system security won't allow normal services to show a message box, my service just appeared to hang. Before I do turn off Allow Service To Interact With Desktop, I double-check that my service—and any DLLs that it uses—don't call message boxes by using DUMPBIN / IMPORTS to verify that neither MessageBoxA nor MessageBoxW are imported when I don't expect them to be.
If you're using SUPERASSERT as your assertion code, you're in luck. Even when you forget to turn off its dialog notifications, SUPERASSERT checks to see whether the process is running with a visible desktop before it shows the cool notification dialog box. In fact, this feature is so useful that I encapsulated it in the BSUIsInteractiveUser function (BSUFUNCTIONS.CPP) in ![]() BugslayerUtil.DLL.
BugslayerUtil.DLL.
Set Your Service Identity
To avoid security problems when you're trying to get your service running, you can set the identity of your service. By default, all services run under the System account, which is sometimes referred to as the LocalSystem account. However, you can set your service to start under a user account with higher security access, such as someone who is a member of a group with higher rights.
In your service's Properties dialog box, click on the Log On tab. Select the This Account radio button, click the Browse button, and choose the appropriate account from the Select User dialog box. After selecting the user, you'll need to type in and confirm the password for that account. For COM+ executable services, the DCOMCNFG.EXE can also set the logon identity of your service if you're more comfortable using it.
Attach to Your Service
Once your service has started, debugging isn't usually that difficult. All you need to do is to attach to your service process from the Microsoft Visual Studio .NET debugger. Depending on your service and the complexity of your code, attaching to the service with a debugger might be all you need to do to debug. Follow these simple steps to attach to an active process from the Visual Studio .NET debugger:
-
Start DEVENV.EXE.
-
From the Tools menu, select Debug Processes to bring up the Processes dialog box.
-
Check the Show System Processes check box, and click the Refresh button so that you can see all the service processes. Select the process you want to debug from the list, and click the Attach button. If you hold down either Ctrl key while clicking the Attach button, you'll automatically start Native debugging, bypassing the Attach To Process dialog.
-
If the Attach To Process dialog box does appear, ensure that Native is checked and click OK.
One very nice new feature of the Visual Studio .NET debugger is that you can now avoid going through the preceding steps every time you want attach to your service because you can create a project that will attach to the service as you start debugging. Set up your special attach projects with the following steps. Please note that these steps assume you're running the debugger under an account that has full administrator privileges and is in the Debugger Users group for the machine.
-
Build your application. When the build finishes, close the existing solution.
-
From the File menu, select Open Solution.
-
In the Open Solution dialog box, change the Files Of Type drop-down list to Executable Files and navigate to where the built service EXE resides. Select the EXE as the solution and click the Open button.
-
Save the solution by selecting Save All from the File menu and give the solution a name such as <project>_Attach.SLN in the Save File As dialog box.
-
Right-click on the .EXE node in the Solution Explorer window, and select Properties from the shortcut menu.
-
In the Debugging page of the project Property Pages dialog box, set the Attach field to Yes, as shown in Figure 14-1.
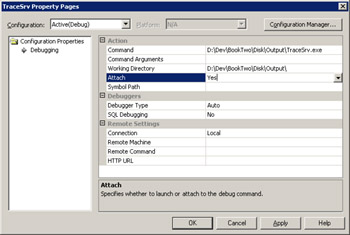
Figure 14-1: The Attach Debugging property page -
Click OK in the project Property Pages dialog box.
-
Install and start your service in the usual manner.
-
When you're ready to debug the service, simply press F5 in Visual Studio .NET with your attach project loaded and you'll be all set.
An alternative method of attaching the debugger is just to call the DebugBreak API function. When the Application Error dialog box pops up, simply click the Cancel (Windows 2000) or Debug (Microsoft Windows XP and Windows Server 2003) button and debug as you normally would. Keep in mind that if you're building a COM+ service, you should make the DebugBreak call outside any COM method or property invocations. If you don't, COM will eat the breakpoint exception generated by DebugBreak and you'll never get a debugger attached. In addition, you shouldn't call DebugBreak as part of your service's initial startup code; see the section "Debug Your Startup Code" later in this chapter for reasons why.
Yet another means to attach the debugger to your service—if you're logged in with Administrator rights—is to use Task Manager. Bring up Task Manager, select the Processes tab, right-click on the process you want to debug, and select Debug from the shortcut menu. The operating system makes it easy to attach your debugger if you know what process you want to debug.
Only users who are authenticated as Administrators on the local machine are allowed to attach a debugger to services. If you're not an Administrator, the Debug option will show you an Unable To Attach Debugger message box when you try to debug a process that's not running under your user account.
IIS ISAPI filters and extensions Prior to IIS 5, all ISAPI filters ran inside INETINFO.EXE, the main IIS service, which meant you simply connected to INETINFO.EXE and debugged the single process. In IIS 5 and later versions, extensions run in DLLHOST.EXE because of the new pooled out-of-process model. ISAPI filters still run inside the IIS process, INETINFO.EXE. The new model makes IIS much more stable, and according to Microsoft, much more scalable. The only problem for debugging is that you might not know which DLLHOST.EXE process your extension is running under.
The IIS documentation mentions that you should set up your extensions to run inside IIS so that you can debug them. The only problem with changing where your extensions run is that you should deploy your extensions so that you use the pooled out-of-process model. Because I'm a believer in debugging in scenarios like those your users will experience, I want to show you the trick to debugging extensions even when they're running under DLLHOST.EXE, which is how your extensions will run.
Before I talk about using the debugger, though, I need to talk about how to figure out which process is running your filter or extension because multiple instances of DLLHOST.EXE will be running. First, you need to download a fantastic free utility, Process Explorer, from Mark Russinovich and Bruce Cogswell's Web site, www.sysinternals.com. I first mentioned Process Explorer in Chapter 2 because it's an excellent tool you can use to determine whether DLLs loading in your address space are being relocated.
Process Explorer will show you the handles that a process has open and, most important, which DLLs are loaded into which processes. To find your DLL using Process Explorer, first press Ctrl+D to indicate you want to view DLLs, then press Ctrl+F, and in the Process Explorer Search dialog box, type the filename of your DLL in the DLL Substring edit control. Click the Search button, and Process Explorer will list the names and process IDs (PIDs) of the processes that have your DLL loaded. After you have the PID, you can attach the Visual Studio .NET debugger to the process using the Debug Process command on the Tools menu. Make sure you read the sidebar about what other tasks Process Explorer can perform because it's one of the best tools you can put on your hard disk.
If you're looking for the command-line equivalent tool to Process Explorer, it's the TLIST.EXE program that comes with the Debugging Tools for Windows (that is, WinDBG). It can show you the MTS packages as well as which processes have which DLLs loaded. Running TLIST -? will show you all the command-line options supported by TLIST.EXE. The –k command-line switch shows all processes that have MTS packages in them. The –m command-line switch shows which processes have a particular DLL loaded in them. The –m switch supports regular expression syntax. So, for example, to see all modules that load KERNEL32.DLL, you'd specify *KERNEL32.DLL as the pattern.
Because you're looking for a loaded DLL, you obviously have to make sure that it loads before you can debug it. Filters run inside INETINFO.EXE, so you can't attach the debugger before the IIS service starts. Therefore, you're out of luck if you want to debug the initialization. If you're debugging extensions, you can debug your initialization if you're ingenious. The idea is to create a dummy extension that you force IIS to load by connecting to your Web site with Microsoft Internet Explorer, which will make IIS start the DLLHOST.EXE pooled out-of-process executable. After you hunt down the PID for the new DLLHOST.EXE, you can attach the debugger. You can then set a breakpoint on LdrpRunInitializeRoutines so that you can step directly into your extension's DllMain. Matt Pietrek clarifies exactly what you need to do to set the LdrpRunInitializeRoutines breakpoint in his "Under the Hood" column from the September 1999 Microsoft Systems Journal. After you've set the breakpoint, you can load your real extension with Internet Explorer and debug your initialization.
Debug Your Startup Code
The hardest part of debugging services is debugging the startup code. The SCM will wait only 30 seconds for a service to get started and call StartServiceCtrlDispatcher to indicate that the service is running fine. Although this time is almost a lifetime on the CPU, you can easily spend that amount of time single-stepping through your code looking at variables.
The only clean way to debug your service startup code is to use trace statements if all you have is the Visual Studio .NET debugger. Using Mark Russinovich's DebugView, which I refer to in Chapter 3, you can see the statements as your service rolls along. Fortunately, your service startup code is generally more lightweight than the main service code, so debugging with trace statements isn't too painful.
The SCM timeout limit can cause problems for services that can't start quickly. A slow piece of hardware or the nature of your service can sometimes dictate a long startup time. The SERVICE_STATUS structure you pass to SetServiceStatus has two fields, dwCheckPoint and dwWaitHint, which might help you if your service is likely to time out on startup.
When your service does start, you can tell the SCM that you're entering the SERVICE_START_PENDING state, place a large hint in the dwWaitHint field (the time is in milliseconds), and set the dwCheckPoint field to 0 so that the SCM won't use the default times. If you need more time in your service startup, you can repeat the call to SetServiceStatus as many times as necessary as long as you increment the dwCheckPoint field before each successive call.
The final point I want to address about debugging startup code is that the SCM will add entries to the event log explaining why it can't start a particular service. In the Event Viewer, look in the Source column for "Service Control Manager." If you also use the event log for your lightweight tracing, between the SCM entries and your tracing, you should be able to solve many of your startup problems. If you use the event log, make sure your service dependencies are set so that your service will be started after the event log service.
I've already mentioned that Mark Russinovich's wonderful Process Explorer program makes it trivial to find which instance of DLLHOST.EXE has a particular DLL loaded and to determine whether you have relocated DLLs in a process. However, there's so much more to Process Explorer—such as being an outstanding debugging tool—and I want to take a moment to discuss some of its excellent features.
By default, Process Explorer updates periodically, just like Task Manager. Although this updating is great for general monitoring, it can make you miss some details when debugging. It's best to set Process Explorer to manual updating by selecting the View menu, and then setting Update Speed to Paused.
Probably the best way to show you the power of Process Explorer is to run through a little demonstration. You might want to follow along so that you can see the tool in action. The first step is to start Process Explorer followed by NOTEPAD.EXE because I'll use it for the demonstration. Set Process Explorer to manual updating by selecting the View menu, and then setting Update Speed to Paused.
The first trick you can perform with Process Explorer is determining which DLLs are coming into your address space because of a particular operation. In Process Explorer, press F5 to refresh the display, select the instance of NOTEPAD.EXE you started up a moment ago, and then press Ctrl+D to change the view to show the DLLs for Notepad. Activate Notepad and select Open from Notepad's File menu. Leave the Open dialog box open in Notepad and switch back to Process Explorer. Press F5 to refresh Process Explorer's display and you'll see a bunch of lines appear in green in NOTEPAD.EXE's DLL view, as shown in Figure 14-2. The green indicates which DLLs came into the address space since the last refresh. Of course, you can also see which DLLs leave the address space by switching back to Notepad and closing the Open dialog box, returning to Process Explorer, and refreshing the display with F5. All DLLs that have left the address space are shown in red. This ability to quickly see what's coming into and out of your processes is very helpful in determining what's causing module loads and unloads. An added benefit is that the color highlighting showing what's been loaded and unloaded also applies to the EXE listing in the upper half of the Process Explorer display.
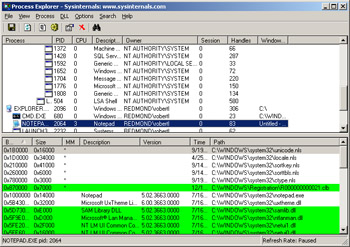
Figure 14-2: DLL view for Process Explorer showing new DLLs added to the Notepad process
Process Explorer's second trick lets you peek at all sorts of excellent information about a process simply by double-clicking it. The dialog box that pops up shows you four or five tabs depending on the process. The first tab, Image, shows you information such as the path and current directory for the process, as well as offers a button to let you kill the process. The second tab, Performance, shows you the important performance data information related to the CPU, memory, I/O, and GDI handles. The third tab, Security, shows you the security information such as groups for the process and granted access. If the process is a Microsoft Win32 service or host, the Services tab shows you the name of the particular services running in that process. The final tab, Environment, lists the environment variables active for that process. In using the Security and Environment tabs, I've tracked down some very interesting problems related to security programming because Process Explorer is about the only tool that makes this information easy to see.
The final trick with Process Explorer lets you see which handles are currently open for any process! I've utilized this feature to track down many different handle problems in the past. In Process Explorer, press Ctrl+H to change the bottom half of the display to handle viewing. The first column displayed is the handle value, and the second column is the type of handle (see the explanation in Chapter 8 in the discussion of !handle). The third column contains the access bits for that handle, and the fourth column is the name of the object. As I mentioned back in Chapter 8, naming your handles is crucial to tracking down problems. If you want more details about a particular handle, double-click it to see the handle properties and more than you ever wanted to know about that handle's particular permission values.
As with DLL view, you can see handles being created and closed inside your process. Select the instance of NOTEPAD.EXE you started earlier. Press Ctrl+H to get the handle view, and refresh the display by pressing F5. Switch back to Notepad, and reopen the Open dialog box. Once the dialog box is open, switch back to Process Explorer and refresh the display again. All new handles in the Notepad process show up with green highlighting. If you close Notepad's Open dialog box and refresh Process Explorer once more, all the closed handles will show up with red highlighting.
I've used the handle view in Process Explorer to help track down handle leaks more times than I can count. By default, Process Explorer will show you only those handles that have names. You can also view all unnamed handles by pressing Ctrl+U. If you're tracking down handle issues, you'll probably want to view all the handles so that you can see all types that might be leaking.
One pretty interesting feature in handle view gives you the option to forcibly close a particular handle by right-clicking on it and selecting Close Handle. When I asked Mark why he put that feature in, he said, "Because I could." When I laughed and said that it was pretty dangerous, he said it was my job to come up with a reason for having it. The key reason for randomly closing handles in Process Explorer is so that you can sneak into your manager's office and close half the handles in Outlook to keep him from sending you annoying e-mail. I figure that's a plenty good enough reason!
|
EAN: 2147483647
Pages: 177