Consumer demographics
Consumer demographics
Population
Population is a factor in market size. For some products whose consumers are potentially every walking person, the total population represents the customer base and a percentage of the population would be the target of sales efforts. For other products, the population size would need to have a denominator before a company can assess the market. In other words, the size of the population does not determine a market that a company can address economically and realistically reach. It is an onion of which the outer skins need to be peeled off.
At the end of 2001, China registered a population of 1,276.7 million (excluding Hong Kong, Macao, Taiwan and other southern islands). Evidently China is now the most populous country in the world, while India is catching up. Some experts predict that India will replace China as the world's largest country. One underlying reason for this expectation is that China's population growth has slowed and the family planning policy has been effective in controlling the once explosive population. Table 1.7.1 below depicts the trend of China's population growth over the last two decades or so and the slow growth trend is obvious. According to one estimate, by 2010 the population is expected to stay at
1.4 billion, and by the middle of this century the population growth will halt at a peak of 1.6 billion. Thereafter, the population is expected to decline.
| Year | Total population (000) | Natural growth rate(%) |
|---|---|---|
| 1978 | 96,2590 | 12.00 |
| 1979 | 97,5420 | 11.61 |
| 1980 | 98,7050 | 11.87 |
| 1981 | 1,000,720 | 14.55 |
| 1982 | 1,016,540 | 15.68 |
| 1983 | 1,030,080 | 13.29 |
| 1984 | 1,043,570 | 13.08 |
| 1985 | 1,058,510 | 14.26 |
| 1986 | 1,075,070 | 15.57 |
| 1987 | 1,093,000 | 16.61 |
| 1988 | 1,110,260 | 15.73 |
| 1989 | 1,127,040 | 15.04 |
| 1990 | 1,143,330 | 14.39 |
| 1991 | 1,158,230 | 12.98 |
| 1992 | 1,171,710 | 11.60 |
| 1993 | 1,185,170 | 11.45 |
| 1994 | 1,198,500 | 11.21 |
| 1995 | 1,211,210 | 10.55 |
| 1996 | 1,223,890 | 10.42 |
| 1997 | 1,236,260 | 10.06 |
| 1998 | 1,248,100 | 9.53 |
| 1999 | 1,259,090 | 8.77 |
| 2000 | 1,265,830 | 7.58 |
| 2001 | 1,276,270 | 6.95 |
| Source: China Statistical Yearbook 2001 and China Statistical | ||
Population distribution by administrative divisions
Geographically, the Chinese population is distributed over 31 administrative regions, excluding Taiwan, Hong Kong and Macao. On its mainland China has four provincial level municipalities under the direct jurisdiction of the central government (Beijing, Shanghai, Tianjin and Chongqing), 5 autonomous regions (Inner Mongolia, Guangxi, Tibet, Ningxia and Xinjiang) and 22 provinces .
The top ten most populous provinces are Henan,(95.55 million), Shandong (90.41 million), Sichuan (86.4 million), Jiangsu (73.55 million), Guangdong (77.83 million), Hebei (66.99 million), Hunan (65.96 million), Anhui (63.28 million), Hubei (59.75 million) and Guangxi (47.88 million). These ten most populous places account for 57 per cent of the total population (see Figure 1.7.1).
| Region | Total population (000) | Natural growth rate(%) |
|---|---|---|
| Beijing | 13,830 | 0.80 |
| Tianjin | 10,040 | 1.64 |
| Hebei | 66,990 | 4.98 |
| Shanxi | 32,720 | 7.16 |
| Inner Mongolia | 23,770 | 4.98 |
| Liaoning | 41,940 | 1.64 |
| Jilin | 26,910 | 3.38 |
| Heilongjiang | 38,110 | 2.99 |
| Shanghai | 16,140 | -0.95 |
| Jiangsu | 73,550 | 2.41 |
| Zhejiang | 46,130 | 3.77 |
| Anhui | 63,280 | 6.61 |
| Fujian | 34,400 | 6.04 |
| Jiangxi | 41,860 | 9.38 |
| Shandong | 90,410 | 4.88 |
| Henan | 95,550 | 6.94 |
| Hubei | 59,750 | 2.44 |
| Hunan | 65,960 | 5.08 |
| Guangdong | 77,830 | 8.33 |
| Guangxi | 47,880 | 7.73 |
| Hainan | 7,960 | 9.47 |
| Chongqing | 30,970 | 2.80 |
| Sichuan | 86,400 | 4.37 |
| Guizhou | 37,990 | 11.3 |
| Yunnan | 42,870 | 10.94 |
| Tibet | 2,630 | 12.10 |
| Shaanxi | 36,590 | 4.16 |
| Gansu | 25,750 | 7.15 |
| Qinghai | 5,230 | 12.62 |
| Ningxia | 5,630 | 11.71 |
| Xinjiang | 18,760 | 11.13 |
| National total | 1,276,270 | 6.95 |
| Source: China Statistical Abstract 2002
| ||
Urban and rural population distribution
China began to practise a residence control system in 1951. Migration from rural to urban residences has been under strict control, as a result of which the rural population has remained predominantly high. In 1978 the proportion of rural population was 82.08 per cent, against an urban population share of 17.92 per cent. With the progress of urbanization, the share of urban population has increased to 37.65 per cent. This is a remarkable progress compared vertically with the past, but it is still quite low if compared horizontally with the world average of 47 per cent, not to mention a 70 per cent ratio of urban populations in developed countries .
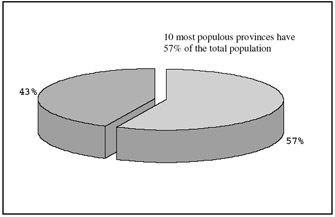
Figure 1.7.1: Share of the ten most populous provinces
| Year | Urban population (million) | % of total | Rural population (million) | % of total |
|---|---|---|---|---|
| 1978 | 72.45 | 17.92 | 790.14 | 82.08 |
| 1980 | 191.40 | 19.39 | 795.65 | 80.61 |
| 1985 | 250.94 | 23.71 | 807.57 | 76.29 |
| 1987 | 276.74 | 25.32 | 816.26 | 74.68 |
| 1988 | 286.61 | 25.81 | 823.65 | 74.19 |
| 1989 | 295.40 | 26.21 | 831.64 | 73.79 |
| 1990 | 301.91 | 26.41 | 841.42 | 73.59 |
| 1991 | 305.43 | 26.37 | 852.80 | 73.63 |
| 1992 | 323.72 | 27.63 | 847.99 | 72.37 |
| 1993 | 333.51 | 28.14 | 851.66 | 71.86 |
| 1994 | 343.01 | 28.62 | 855.49 | 71.38 |
| 1995 | 351.74 | 29.04 | 859.47 | 70.96 |
| 1996 | 359.50 | 29.37 | 864.39 | 70.63 |
| 1997 | 369.89 | 29.92 | 866.37 | 70.08 |
| 1998 | 379.42 | 30.40 | 868.68 | 69.60 |
| 1999 | 388.92 | 30.89 | 870.17 | 69.11 |
| 2000 | 458.44 | 36.22 | 807.39 | 63.78 |
| 2001 | 480.64 | 37.65 | 795.63 | 62.34 |
| Source: China Statistical Yearbook 2001 and China Statistical Abstract 2002 | ||||
Following China's accession to the WTO, agriculture is going to be one of the industries most impacted and labour migration from rural to urban areas is expected to increase. At the same time, the urbanization process will quicken in order to absorb the surplus labour from rural areas. There are indications that policies regarding control over the migration of the rural population into urban areas have been relaxed and rural residents are expected to receive 'national treatment'. Undoubtedly, urbanization is going to be vitally important in narrowing the gap between rural areas and urban districts, boosting China's economic growth and creating more jobs. According to a report by Guangming Daily in July 2002, the number of people living in Chinese cities is expected to reach 1.12 billion by 2050, accounting for 70 per cent of the country's total population. More than 600 million Chinese people will shift from rural areas to urban districts in the next 50 years . The same report says that the Chinese mainland now has more than 660 cities and 19,000 towns, and by 2050, 80 per cent of towns will have grown into small or medium- sized cities. By then, China will have 50 ultra -large cities, each with an urban population of more than 2 million, 150 big cities, 500 medium-sized cities and 1,500 small cities.
Population breakdown by gender
As shown in Table 1.7.4, the male population as a percentage of the total population has been higher than that of females. The Chinese Constitution and legislation give equal rights to both male and female in terms of social status and employment opportunities, but the culture's preference for masculinity is considered to be the key reason for a greater male population. This is particularly true in the less developed rural areas. In 2001 the female population reached a historical low of 48.31 per cent over the period from 1988 to 2001. Although the imbalance between the male and female populations is not so significant as to cause problems with social and economic implications, experts have expressed concerns for social stability if this trend continues.
| Year | Male | Female | Total population (million) | ||
|---|---|---|---|---|---|
| Population (million) | % of total | Population (million) | % of total | Population (million) | |
| 1988 | 572.01 | 51.52 | 538.25 | 48.48 | 1,110.26 |
| 1989 | 580.99 | 51.55 | 546.05 | 48.45 | 1,127.04 |
| 1990 | 589.04 | 51.52 | 554.29 | 48.48 | 1,143.33 |
| 1991 | 594.66 | 51.34 | 563.57 | 48.66 | 1,158.23 |
| 1992 | 598.11 | 51.05 | 573.60 | 48.95 | 1,171.71 |
| 1993 | 604.72 | 51.02 | 580.45 | 48.98 | 1,185.17 |
| 1994 | 612.46 | 51.10 | 586.04 | 48.90 | 1,198.50 |
| 1995 | 618.08 | 51.03 | 593.13 | 48.97 | 1,211.21 |
| 1996 | 622.00 | 50.82 | 601.89 | 49.18 | 1,223.89 |
| 1997 | 631.31 | 51.07 | 604.95 | 48.93 | 1,236.26 |
| 1998 | 636.29 | 50.98 | 611.81 | 49.02 | 1,248.10 |
| 1999 | 641.89 | 50.98 | 617.20 | 49.02 | 1,259.09 |
| 2000 | 653.55 | 51.63 | 612.28 | 48.37 | 1,265.83 |
| 2001 | 656.72 | 51.69 | 619.55 | 48.31 | 1,276.27 |
| Source: China Statistical Yearbook 2001 and China Statistical Abstract 2002 | |||||
Age distribution
According to China's Population Report, over 30 per cent of the population were under 20 years of age. On the other hand, the population segment of the people aged over 60 accounted for over 10 per cent, and those above 65 reached 6.95 per cent in the 2000 census. Population aging will become increasingly felt. By 2010 the people born in the baby boom period in the 1950s and 1960s will enter the elderly groupings and the elderly segment will experience the fastest growth. In the next 25 years the elderly population will be double today's count.
When studying the age distribution, marketers are invited to look into the two extremes of the population,10 most populous provinces have 57% of the total population one of which is the population of teenagers or what is called the 'little emperors' generation, and the other is the growing aging population. Marketers have already invested efforts to address the needs of the pampered little emperors but little attention has been given to the elderly population.
The little emperors have enjoyed higher living standards and better education and training than previous generations in China. But they have also displayed distortions in behaviour. Research indicates that the little emperors do not only represent a group of consumers, but also have increasing influence over parents' purchase decision-making. Over time, there will be more 'only' children joining the workforce. They will have better education as a result of their parents' investment in only children schooling. Considerable study effort is necessary to understand the behavioural characteristics of only children, as they will soon become the core of Chinese society.
Household structure
The average household size is getting smaller. In 2001 average household size in urban areas was 3.10 persons compared to 3.97 persons in 1990. One of the reasons for the decline in average family size is the low birth rate as a result of family planning. Social, economic and cultural factors have also contributed to the reduction in the average family size. There is an increasing number of DINK (double income no kids ) families in urban areas, particularly among those who have higher education.
Urban households are characterized by high proportions of childless families while rural households average four-person families. The average size of rural households was 4.15 persons. Experts have commented that the urban household structure resembles that of developed countries and will not change much in the foreseeable future. With the continued family planning effort, the average size of rural households is expected to reduce.
China's family planning policy, which was designed to reduce the population, encourages late marriage and late childbearing. Better and fewer births are strongly advocated and a single-child family is promoted as state policy. The basic principle of family planning policy is to integrate the state instruction with individual consent . While respecting and safeguarding the individual's basic rights, the policy calls for individual's social responsibility and obligations. Health care institutions throughout the country are providing various kinds of services for mothers, children and couples at the child- bearing age. However, at the same time, from 2003, most young people of marriageable age in urban areas will be only children. The one-child policy is expected to be relaxed. When two only children marry, they will be allowed to have more than one child.
| Region | Population by age group (10,000) | % of total population | Total (10,000) | ||||
|---|---|---|---|---|---|---|---|
| Age 0 “14 | Age 15 “64 | Age 65+ | Age 0 “14 | Age 15 “64 | Age 65+ | ||
| Beijing | 188 | 1,078 | 1,382 | 116 | 13.60 | 78.04 | 8.36 |
| Tianjin | 168 | 750 | 1,001 | 83 | 16.75 | 74.93 | 8.33 |
| Hebei | 1539 | 4,742 | 6,744 | 463 | 22.82 | 70.32 | 86 |
| Shanxi | 851 | 2,242 | 3,297 | 204 | 25.80 | 68.00 | 6.20 |
| Inner Mongolia | 506 | 1,743 | 2,376 | 127 | 21.28 | 73.37 | 5.35 |
| Liaoning | 749 | 3,157 | 4,238 | 332 | 17.68 | 74.49 | 7.83 |
| Jilin | 517 | 2,051 | 2,728 | 160 | 18.96 | 75.19 | 5.85 |
| Heilongjiang | 697 | 2,792 | 3,689 | 200 | 18.90 | 75.68 | 5.42 |
| Shanghai | 204 | 1,277 | 1,674 | 193 | 12.19 | 76.28 | 11.53 |
| Jiangsu | 1,462 | 5,325 | 7,438 | 651 | 19.65 | 71.59 | 8.76 |
| Zhejiang | 845 | 3,418 | 4,677 | 414 | 18.07 | 73.09 | 8.84 |
| Anhui | 1,528 | 4,012 | 5,986 | 446 | 25.52 | 67.03 | 7.45 |
| Fujian | 799 | 2,445 | 3,471 | 227 | 23.02 | 70.44 | 6.54 |
| Jiangxi | 1,076 | 2,811 | 4,140 | 253 | 25.99 | 67.90 | 6.11 |
| Shandong | 1,893 | 6,457 | 9,079 | 729 | 20.85 | 71.12 | 8.03 |
| Henan | 2,401 | 6,211 | 9,256 | 644 | 25.94 | 67.10 | 6.96 |
| Hubei | 1,379 | 4,269 | 6,028 | 380 | 22.87 | 70.82 | 6.31 |
| Hunan | 1,428 | 4,543 | 6,440 | 469 | 22.17 | 70.54 | 7.29 |
| Guangdong | 2,089 | 6,030 | 8,642 | 523 | 24.17 | 69.78 | 6.05 |
| Guangxi | 1,178 | 2,991 | 4,489 | 320 | 26.24 | 66.64 | 7.12 |
| Hainan | 216 | 519 | 787 | 52 | 27.47 | 65.95 | 6.58 |
| Chongqing | 678 | 2,168 | 3090 | 244 | 21.93 | 70.17 | 7.90 |
| Sichuan | 1,887 | 5,822 | 8329 | 620 | 22.65 | 69.90 | 7.45 |
| Guizhou | 1,068 | 2,253 | 3525 | 204 | 30.29 | 63.92 | 5.79 |
| Yunnan | 1,116 | 2,915 | 4,288 | 257 | 26.02 | 67.98 | 6.00 |
| Tibet | 82 | 168 | 262 | 12 | 31.20 | 64.30 | 4.50 |
| Shaanxi | 902 | 2,490 | 3,605 | 214 | 25.01 | 69.06 | 5.93 |
| Gansu | 692 | 1,742 | 2,562 | 128 | 27.00 | 68.00 | 5.00 |
| Qinghai | 138 | 358 | 518 | 22 | 26.62 | 69.05 | 4.33 |
| Ningxia | 160 | 377 | 562 | 25 | 28.38 | 67.15 | 4.47 |
| Xinjiang | 526 | 1312 | 1,925 | 87 | 27.30 | 68.17 | 4.53 |
| National total | 28,979 | 88,793 | 126,583 | 8,811 | 22.89 | 70.15 | 6.96 |
| Note |
|
Source: China Statistical Yearbook 2001
Education
The proportion of the illiterate among adults has decreased from 182 million or 15.9 per cent of the population in 1990 to 84.81 million (6.7 per cent) in 2000.
The government education fund in proportion to GDP has increased from the historical average of 2.4 per cent to 3.1 per cent. However, it is still below the world average of 4.8 per cent. As shown in Figure 1.7.2, 69.7 per cent of the population have received primary and junior high school education while 11.1 per cent have had senior high school education. The percentage of population that has received education at college level or above was only 3.6 per cent.
| Year | Number of households (000) | Average householdsize |
|---|---|---|
| 1990 | 288,300 | 3.97 |
| 1991 | 294,580 | 4.01 |
| 1992 | 300,390 | 3.95 |
| 1993 | 305,740 | 3.92 |
| 1994 | 311,040 | 3.89 |
| 1995 | 316,580 | 3.70 |
| 1996 | 321,680 | 3.70 |
| 1997 | 326,630 | 3.64 |
| 1998 | 341,190 | 3.63 |
| 1999 | 336,512 | 3.58 |
| 2000 | 348,370 | 3.13 |
| 2001 | n.a. | 3.10 |
| Source: China Populations Statistics Yearbook 1998, China Statistical Yearbook 2001 and China Statistical Abstract 2002 | ||
There still exists a marked disparity in the levels of education received by urban and rural populations. The segment of rural population aged 15 and above has a predominant share of primary education, accounting for 43.29 per cent. The percentages of rural population having received junior high school, senior high school and college and above education were 28.2 per cent,4.48 per cent and 0.27 per cent respectively. In contrast, a majority of the urban population has a higher level of education than the rural population.
The current education structure is such that urban education has shifted its focus to middle level education while rural education is still concentrating on primary education.
Per capita disposable income
Since the economic reforms and opening door policy adopted in 1978, China has made remarkable progress in the improvement of the national standard of living. The pattern of growth is moving from the former, simple quantitative expansion to quality enhancement. As a result the quality of people's lives has been improved.
Although Chinese people, both urban and rural, have more income, the income disparity between urban and rural households has widened in absolute terms. In 1991, the gap between rural income and urban disposable income was RMB992, which rose to RMB4493.2 in 2001. In the 10-year period from 1991 to 2001, the average growth of rural incomes was 12.82 per cent while that of urban was 14.97 per cent.
Urban household income
Apart from the disparity between rural and urban income, urban household income also varies among cities of different sizes. The per capita disposable income in extra-large cities is predominantly higher than all other cities of varying sizes. An interesting phenomenon is that the per capita disposable income in small cities is higher than both large and medium-sized cities.
Urban household incomes were unevenly distributed among different income groups and the gap between the highest income group and lowest income group has also widened. In 1997, for example, the gap between the lowest and highest income group was RMB9758.09. In 2000, however, the disparity was RMB10712.17.
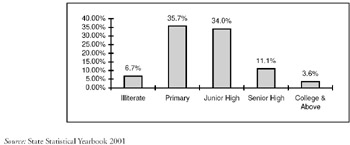
Figure 1.7.2: Level of education by percentage of population in 2000
| Year | Per capita net incomeof rural residents (RMB) | Per capita disposable income of urban residents (RMB) |
|---|---|---|
| 1978 | 133.6 | 343.4 |
| 1980 | 191.3 | 477.6 |
| 1985 | 397.6 | 739.1 |
| 1986 | 423.8 | 899.6 |
| 1987 | 462.6 | 1,002.2 |
| 1988 | 544.9 | 1,181.4 |
| 1989 | 601.5 | 1,375.7 |
| 1990 | 686.3 | 1,510.2 |
| 1991 | 708.6 | 1,700.6 |
| 1992 | 784.0 | 2,026.6 |
| 1993 | 921.6 | 2,577.4 |
| 1994 | 1,221.0 | 3,496.2 |
| 1995 | 1,577.7 | 4,283.0 |
| 1996 | 1,926.1 | 4,838.9 |
| 1997 | 2,090.1 | 5,160.3 |
| 1998 | 2,162.0 | 5,425.1 |
| 1999 | 2,210.3 | 5,854.0 |
| 2000 | 2,254.4 | 6,280.0 |
| 2001 | 2,366.4 | 6,859.6 |
| Source: China Statistical Yearbook 2000, 2001 and China Statistical Abstract 2002 | ||
Source: State Statistical Bureau
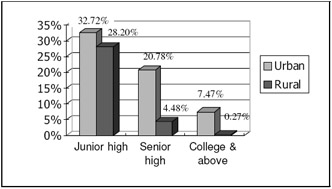
Figure 1.7.3: Comparison of urban and rural education
Regional differences in urban per capita disposable income
Households in the relatively developed areas in Eastern China have the highest income compared with Middle and Western China. Guangdong, Shanghai and Beijing were the top three provinces (municipalities) having the highest per capita disposable income, while Henan, Jilin and Gansu, Shanxi, Ningxia and Inner Mongolia stayed at the bottom. Table 1.7.10 provides a picture of the regional differences in urban per capita disposable income and their changes over the last five years.
| City size | Per capita disposable income (RMB) | |
|---|---|---|
| 1999 | 2000 | |
| All cities and county towns | 5,854.02 | 6,279.98 |
| Extra-large cities | 7,667.78 | 8,371.66 |
| Large cities | 5,825.21 | 6,309.57 |
| Medium-sized cities | 5,449.25 | 5,860.92 |
| Small cities | 6,167.14 | 6,655.91 |
| County towns | 4,890.42 | 5,162.17 |
| Source: China Statistical Yearbook 2000, 2001 | ||
| Income group | Per capita disposable income (RMB) | |
|---|---|---|
| 1997 | 2000 | |
| Lowest income households | 2,325.70 | 2,678.32 |
| Low income households | 3,492.27 | 3,658.53 |
| Lower middle income households | 4,363.78 | 4,651.72 |
| Middle income households | 5,512.12 | 5,930.82 |
| Upper middle income households | 6,904.96 | 7,524.98 |
| High income households | 8,631.94 | 9,484.67 |
| Highest income households | 12,083.79 | 13,390.49 |
| Source: China Statistical Yearbook 1998, 2001 | ||
| Region | 1997 | 1998 | 1999 | 2000 | 2001 |
|---|---|---|---|---|---|
| Beijing | 7,813.2 | 8,472.0 | 9,182.8 | 10,394.7 | 11,577.8 |
| Tianjin | 6,608.4 | 7,110.5 | 7,649.8 | 8,140.5 | 8,958.7 |
| Hebei | 4,958.7 | 5,084.6 | 5,365.0 | 5,661.2 | 5,984.8 |
| Shanxi | 3,989.9 | 4,098.7 | 4,342.6 | 4,724.1 | 5,391.1 |
| Inner Mongolia | 3,944.7 | 4,353.0 | 4,770.5 | 5,129.1 | 5,535.9 |
| Liaoning | 4,518.1 | 4,617.2 | 4,898.6 | 5,357.8 | 5,797.0 |
| Jilin | 4,190.6 | 4,206.6 | 4,480.0 | 4,810.0 | 5,340.5 |
| Heilongjiang | 4,090.7 | 4,268.5 | 4,595.1 | 4,912.9 | 5,425.9 |
| Shanghai | 8,438.9 | 8,773.1 | 10,931.6 | 11,718.0 | 12,883.5 |
| Jiangsu | 5,765.2 | 6,017.9 | 6,538.2 | 6,800.2 | 7,375.1 |
| Zhejiang | 7,358.7 | 7,836.8 | 8,428.0 | 9,279.2 | 10,464.7 |
| Anhui | 4,599.3 | 4,770.5 | 5,064.6 | 5,293.6 | 5,668.8 |
| Fujian | 6,143.6 | 6,485.6 | 6,859.8 | 7,432.3 | 8,313.1 |
| Jiangxi | 4,071.3 | 4,251.4 | 4,720.6 | 5,103.6 | 5,506.0 |
| Shandong | 5,190.8 | 5,380.1 | 5,809.0 | 6,490.0 | 7,101.1 |
| Henan | 4,093.6 | 4,219.4 | 4,532.4 | 4,766.3 | 5,267.4 |
| Hubei | 4,673.2 | 4,826.4 | 5,212.8 | 5,524.5 | 5,856.0 |
| Hunan | 5,209.7 | 5,434.3 | 5,815.4 | 6,218.7 | 6,780.6 |
| Guangdong | 8,561.7 | 8,839.7 | 9,125.9 | 9,761.6 | 10,415.2 |
| Guangxi | 5,110.3 | 5,412.2 | 5,619.5 | 5,834.4 | 6,665.7 |
| Hainan | 4,849.9 | 4,852.9 | 5,338.3 | 5,358.3 | 5,838.8 |
| Chongqing | 5,322.7 | 5,466.6 | 5,896.0 | 6,276.0 | 6,721.1 |
| Sichuan | 4,763.3 | 5,127.1 | 5,477.9 | 5,894.3 | 6,360.5 |
| Guizhou | 4,441.9 | 4,565.4 | 4,934.0 | 5,122.2 | 5,451.9 |
| Yunnan | 5,5583 | 6,042.8 | 6,178.7 | 6,324.6 | 6,797.7 |
| Tibet | 6,908.7 | 7,426.3 | 7,869.2 | ||
| Shaanxi | 4,001.3 | 4,220.2 | 4,654.1 | 5,124.2 | 5,483.7 |
| Gansu | 3,592.4 | 4,009.6 | 4,475.2 | 4,916.3 | 5,382.9 |
| Qinghai | 3,999.4 | 4,240.1 | 4,703.4 | 51,700.0 | 5,853.7 |
| Ningxia | 3,836.5 | 4,112.4 | 4,472.9 | 4,912.4 | 5,544.2 |
| Xinjiang | 4,844.7 | 5,000.8 | 5,319.8 | 5,644.9 | 6,395.0 |
| National total | 5,160.3 | 5,425.1 | 5,854.0 | 6,280.0 | 6,859.6 |
| Source: China Statistical Abstract 2002 | |||||
Rural household income and regional variations
With deepening of economic reform in the agricultural sector and development of the agricultural economy, rural household income has been increasing. In the period 1992 “1997 per capita net income of rural households increased from RMB784 yuan to RMB2090 yuan (about US$251.8), with an annual average rate of increase of 21.7 per cent. However, the rate of growth between 1997 and 2001 slowed down considerably to an average annual growth rate of 3.1 per cent.
Source: China Statistical Yearbook 2000, 2001 and China Statistical Abstract 2002
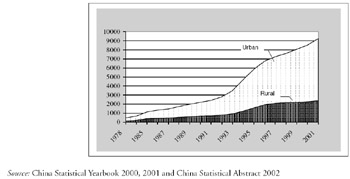
Figure 1.7.4: Income disparity among urban and rural residents “ a widening gap
The regional differences in rural incomes resemble the pattern of urban income. The per capita net income of rural households in the developed eastern areas of China is higher than in the middle and western areas. In 2001 the per capita net income of rural households in Shanghai was the highest of all other provinces and municipalities, being RMB5870.87, followed by Beijing (RMB5025.5), Zhejiang (RMB4582.34), Tianjin (RMB3947.72), Jiangsu (RMB3784.71) and Guangdong (RMB3769.79).
Tibet 's rural per capita net income was the lowest, being RMB1404.01, followed by Guizhou (RMB11411.73), Shaanxi (RMB1490.8), Gansu (RMB11508.61) and Yunnan (RMB 1533.74).
Savings
The rate of saving in China has surpassed all other countries in the world since the 1970s. In 1978, the first year of China's economic reform and opening up, the total urban and rural household savings were only RMB21.06 billion yuan. Ten years later, the total household savings jumped to over RMB500 billion in 1989. Twenty years later, the savings by urban and rural households rocketed to RMB4627.98 billion yuan (about US$557.6 billion), with the rate of savings reaching over 30 per cent. By the end of 2001, the household savings further increased to RMB7.38 trillion (US$892.38 billion).
Although recently the saving rate has slowed down as a result of big-ticket consumption such as housing, the saving rate remains high. Although the government has introduced interest income tax, which has effectively reduced proceeds from bank savings, the rate of increase in savings is still rising . As shown in Figure 1.7.5, urban and rural household savings rose steeply from 1993, the first year after China's official adoption of the socialist market economy. The average annual rate of increase from 1991 to 2001 is 23.09 per cent.
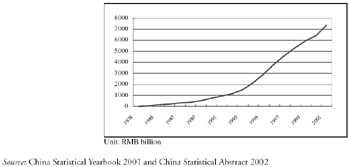
Figure 1.7.5: The growth of urban and rural household savings (1978 “2001)
Interestingly, however, the high savings rate is not motivated by the pursuit of monetary increments . The People's Bank of China (PBOC) conducted a survey on people's propensity to save in 34 cities in May 1998. The survey results indicated that 53.4 per cent of the respondents stated that they would continue to save when asked what they would do with their money if the interest rate remain unchanged. Nearly 70 per cent of the low and middle income residents interviewed stated that they are saving for long-term expenditures such as retirement, children's education, personal misfortunes and illnesses. The savings deposits tend to be mid-to- long term , and the interest earnings are regarded as an extra benefit. Even when the interest rate is low, the propensity to save would not be likely to change very much. Economic Daily explained that this unusually high propensity to save characterized the mentality of the Chinese people in the economic transition, which has increased uncertainty. Since the economic reform and opening up, factors of uncertainty have increased and people tend to choose to sacrifice today's consumption for the sake of future consumption. Housing, children's education, medical care and pension, which were covered by the government in the past, are now increasingly paid by the Chinese people themselves . There are indications that even if inflation were to increase, the people's propensity to save would continue to rise, which is very different from the 'rules of the game' in Western economies and it reflects the unique features of the socialist market economy with such Chinese characteristics.
To sum up, the factors underlying such a persistently high saving rate are:
-
household income has increased as a result of the sustained high GDP growth;
-
consumer aspirations are dampened by the lack of new consumption lure;
-
the expectation that future spending on housing, children's education and medical care will increase as a result of relevant reforms;
-
an expectation of future uncertainties;
-
cautious attitudes toward investment in financial products such as securities, bonds and funds.
According to the prediction of the State Information Centre, the savings rate will be about 12.2 per cent in the next five years.
EAN: 2147483647
Pages: 648