Geographical dispersion of the market
The geographic dispersion by province of passenger vehicles in use at the end of 2000 casts further interesting light on the development of the market. Table 6.1.1 confirms that only 14 municipalities and provinces registered passenger vehicle PARCs of more than 2.5 million.
Together they account for 72 per cent of the total passenger vehicle PARC nationally and generally accurately reflect the GDP per head among the more developed areas of the Chinese economy.
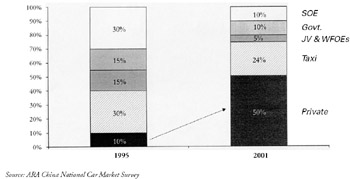
Figure 6.1.2: Customer segmentation: growth of private customers
| Province | No of vehicles (million) |
|---|---|
| Beijing | 8.2 |
| Tianjin | 2.5 [*] |
| Hebei | 5.0 |
| Shanxi | 2.5 [*] |
| Liaoning | 4.4 |
| Heilongjiang | 3.1 |
| Shanghai | 3.3 [*] |
| Jiangsu | 4.1 |
| Zhejiang | 3.2 [*] |
| Shandong | 5.3 [*] |
| Henan | 4.6 |
| Guangdong | 8.5 [*] |
| Sichuan | 4.4 |
| Yunnan | 2.8 [*] |
| Total | 61.9 |
| [*] average <10 seats per vehicle Source: China Association of Automobile Manufacturers | |
The motorcycle PARC is dispersed less evenly with higher than average usage in both urban and sparsely populated areas. Between 1990 and 2000, motorcycles in use per 1,000 head of population nationally multiplied tenfold from 3.0 to 29.8. Table 6.1.2 indicates the variation in popularization by listing the 10 municipalities and provinces where usage per 1,000 is above the national average of 29.8.
| Province | Units per 1,000 people |
|---|---|
| Tianjin | 44.6 |
| Hebei | 37.3 |
| Shanghai | 32.1 |
| Jiangsu | 59.9 |
| Zhejiang | 39.4 |
| Fujian | 44.7 |
| Shandong | 54.4 |
| Guangdong | 78.7 |
| Guangxi | 35.7 |
| Hainan | 47.5 |
| Source: China Association of Automobile Manufacturers | |
EAN: 2147483647
Pages: 648