Creating Other Chart Types
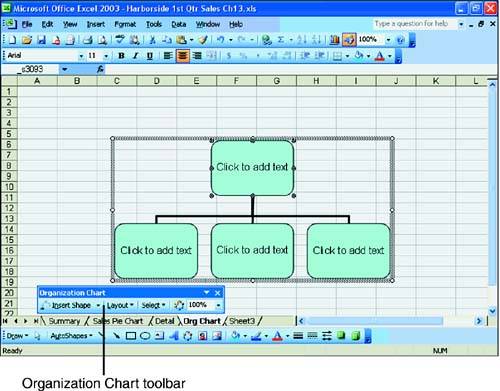
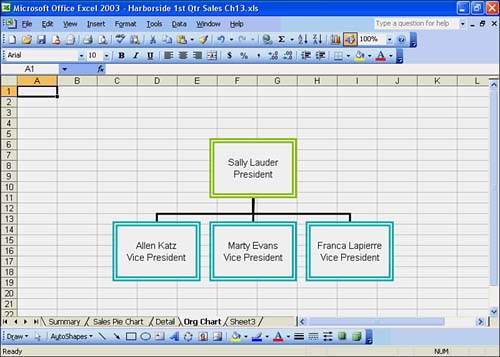
| A few other chart types that you can create in Excel are organization charts and picture charts . Excel's organization chart program lets you illustrate the structure of authority and responsibility (chain of command) in an organization. You don't have to draw boxes and lines with the program because it automatically inserts the boxes and lines for you. After you build the organization chart, you can change the font, font size, and font color for the text in the boxes; the box style; the line style; and the background color for the chart. A picture chart contains pictures in each data series instead of a solid color or pattern. Creating an Org ChartThe Organization Chart feature enables you to build an organization chart in an Excel worksheet from scratch. You can access this program with Excel's Insert Picture Organization Chart command. When you create an organization chart, Excel treats it as an object in a worksheet. You can show the levels of hierarchy and various members of departments within your company in a chart with boxes and lines. In the following To Do exercise, you create an organization chart and examine how it works. First you insert a new sheet in the Sales 1st Qtr Workbook so that you can place the org chart on a sheet by itself. To Do: Create an Org Chart
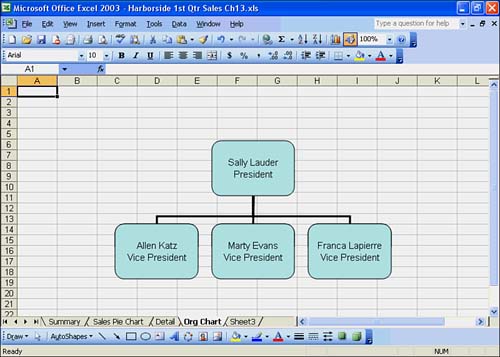
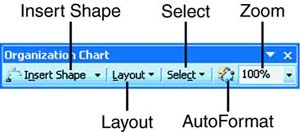
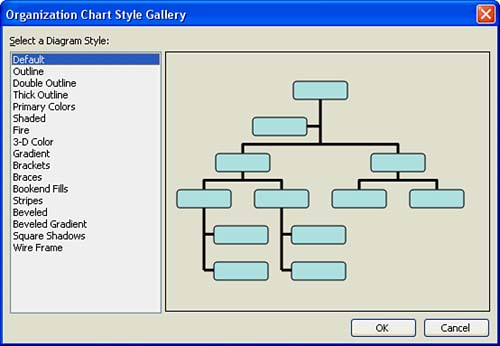
Modifying an Org ChartYou can add more boxes to your org chart if you want. Several types of boxes are available: a subordinate box, a co-worker box, a manager's box, and an assistant box. The Organization Chart toolbar, accessed by double-clicking on the chart, supplies a set of tools for modifying an org chart, as shown in Figure 13.3. Figure 13.3. Organization Chart toolbar. To add boxes, click the button on the Organization Chart toolbar that matches the relationship to an existing box that you want to create. For example, to add a subordinate to a box that is already on the chart, click the Subordinate button and then click the box to which you want to attach it. A box with placeholder text appears in the chart. Then you can fill in the name and title in the box. To delete a box, select it and then press the Delete key. You should no longer see the box on the org chart. Because an organization chart is handled as an object in an Excel worksheet, you can move and resize the organization chart, just as you would any object in Excel. To move the organization chart, point to the chart in the worksheet and, when you see a four-headed arrow, drag the org chart to the new location. If you want to resize the org chart in the worksheet, move the mouse pointer to a side border or corner until you see a double-headed arrow. Then drag the border to stretch or shrink the chart. Formatting an Org ChartAfter you add and remove boxes in your org chart, you can format it with the AutoFormat command on the Organization Chart toolbar. In the next To Do exercise, we add color, a shadow to the boxes, and change the line style and color of the connecting lines. To Do: Format an Org Chart
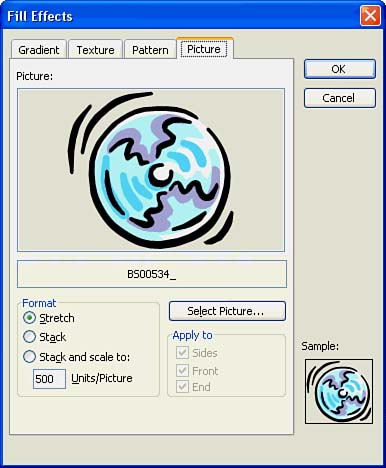
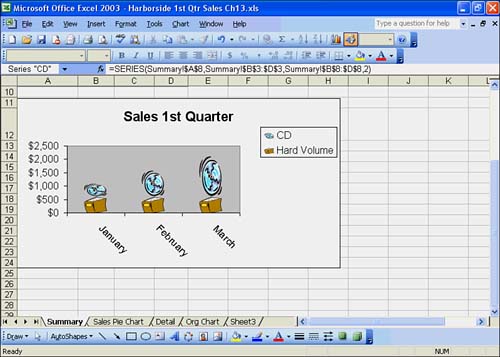
Creating a Picture ChartTo create a picture chart, which is a chart that has pictures representing each data series, first create a chart using the Chart Wizard. Then select a data series in the Chart Objects list on the Chart toolbar. Click the Format Data Series button on the Chart toolbar. Next click the Patterns tab. Click the Fill Effects button at the bottom of the Area section, and the Fill Effects dialog box appears. Click the Picture tab. Click the Select Picture button and change to the drive and folder that contain pictures. Pictures are stored either in the My Pictures subfolder under the My Documents folder, in a subfolder under the Program Files folder, or on a CD-ROM. Select a picture file and click OK. The picture appears in the Picture box on the Picture tab, as shown in Figure 13.6. Click OK to return to the Picture tab displaying a sample of the selected picture. Click OK to insert the picture in the data series. Figure 13.7 shows a picture chart. Figure 13.6. The Picture tab in the Fill Effects dialog box. Figure 13.7. A picture chart with stacked columns . |
EAN: 2147483647
Pages: 279
- Structures, Processes and Relational Mechanisms for IT Governance
- An Emerging Strategy for E-Business IT Governance
- Measuring and Managing E-Business Initiatives Through the Balanced Scorecard
- Measuring ROI in E-Commerce Applications: Analysis to Action
- Technical Issues Related to IT Governance Tactics: Product Metrics, Measurements and Process Control