MULTIDIMENSIONAL ANALYSIS
The textual warehouse must allow decision-making, which implies the ability to implement new processes for textual information analysis. The multidimensional model is an option which is better adapted to data analysis than a relational model. Indeed, it considers a subject to be analyzed as a point in a space with several dimensions. The data are organized so as to implement the analyzed subject and the different perspectives of the analysis. Several formalisms for the multidimensional model have been proposed: hypercube (Agrawal et al., 1995), multidimensional table (Gyssens & Lakshmanan, 1997), cube (Thomas et al., 1997), f-tables (Cabibbo & Torlone, 1998), etc. In what follows , we detail, multidimensional tables, which are the basic concept of our contribution. The multidimensional table is the logical model commonly used in multidimensional analysis. Its representation in tabular form is wellsuited for any user , insofar as he is already accustomed to interpreting this common type of representation.
| A multidimensional schema is defined by a schema and instances. |
|---|
|
The attributes belonging to the set P = ˆ 1 ‰ i ‰ n param(d i ) are the parameters of the analysis. The attribute A m belonging to the set M = A ˆ’ ˆ 1 ‰ i ‰ n param(d i ) is called the measures of the analysis (they are the attributes other than those of the parameters). Figure 5 represents a multidimensional table. The symbol * indicates that there is no value.
Conceptual Modeling of the Textual Marts
The multidimensional model represents data in a mart in the form of a schema grouping, which is a set of facts and dimensions. A textual mart is specialized for an activity type, an analysis type, and a user group .
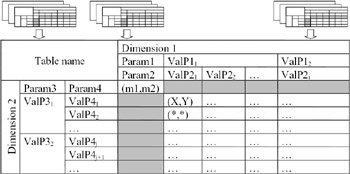
Figure 5: Visualization of a Multidimensional Table
The documents implemented in the warehouse are organized according to their DTD. These last ones organize the elements among them according to a hierarchy dependence.
| A hierarchy dependence between two elements A i and A j , |
By basing itself on these dependencies, it is possible to define a hierarchy.
| A hierarchy H is defined on a set of elements by: |
A textual mart contains one or more facts. A fact constitutes a subject of analysis (the different measures of activity that must be analyzed).
| A fact is defined by ( Name F , E_Mes F , Fct F , H F ):
|
The measures of an activity can be observed according to different perspectives. Every perspective is represented by a dimension.
| A dimension D is defined by (Name D , E_Par D , H D ):
|
Every textual mart is characterized by its multidimensional schema. We define a multidimensional schema as a model composed of facts and dimensions.
| A multidimensional schema S is defined by (Name S , Dim S , Fact S ):
|
Graphic Construction of Textual Marts
In this section, we present the stages involved in building textual marts that perform multidimensional analyses.
-
Stage 1: Automatic display of generic logical structures and documents.
-
Stage 2: The user must choose a generic logical structure or a document.
-
if the user chooses a generic logical structure, then the analysis concerns all the documents belonging to this structure;
-
if the user chooses a document, the analysis concerns only this document.
-
-
Stage 3: The system must automatically display the generic logical structure:
-
if the user chose a generic logical structure, the system displays the elements of this structure;
-
if the user chose a document, it is necessary to refer to the corresponding generic logical structure to display its elements.
-
-
Stage 4: The user must specify the role (i.e., dimension or fact) of some elements to build the textual mart by using contextual menus . The elements chosen by the user are highlighted by using different shapes and colors for the dimensions and facts.
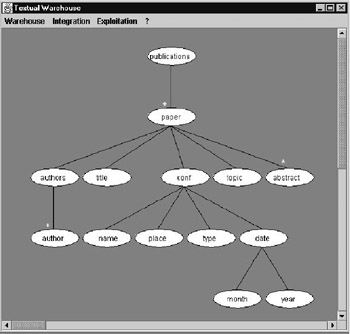
Figure 6: Generic Logical Structure Chosen by the User
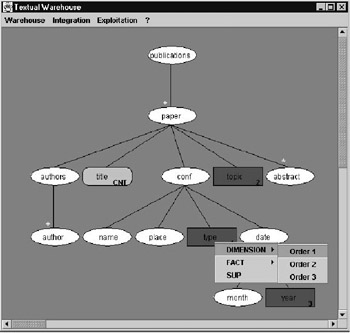
Figure 7: Generic Logical Structure Modified by the User
In this example, the first dimension is the type, the second dimension is the topic, and the third dimension is the year. However, the fact is the number of papers. This textual mart, then, determines the number of papers by type, topic and year. At this time, the user task is finished. The result will be a multidimensional table. Figure 8 presents the schema of textual mart.
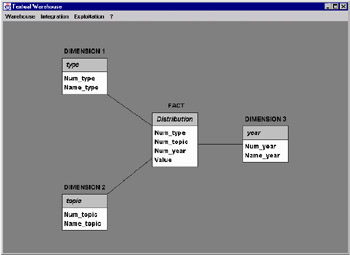
Figure 8: Schema of Textual Mart
-
Stage 5: Automatic generation of views: for every element e chosen by the user, the system must generate a view containing several attributes:
-
the first attribute corresponds to the document number of the element e ;
-
the second attribute is the number of the element constituting the ancestor common to all the elements chosen by the user;
-
the last attribute corresponds to the information of the element e .
-
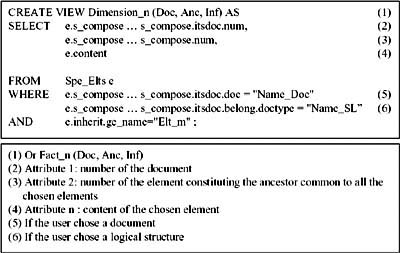
| Note | The number of "s_compose" for the attributes is determined by calculating the level number between the corresponding element (document or ancestor element) and the chosen element e . |
For the first dimension, the view that the system must generate is the following:
CREATE VIEW Dimension_1 (doc, paper, type) AS SELECT e.s_compose.s_compose.s_compose.itsdoc.num, e.s_compose.s_compose.num, e.content FROM Spe_Elts e WHERE e.s_compose.s_compose.s_compose.itsdoc.belong.doctype = "publications" AND e.inherit.ge_name = "Type" ; |
In the same way, the system must generate all the other views. We will then have four views: Dimension_1 (doc, paper, type), Dimension_2 (doc, paper, topic), Dimension_3 (doc, paper, year), and Fact_1 (doc, paper, title).
From these views, the system must then generate another view by a joint on the first two attributes (in our example "doc" and "paper"):
CREATE VIEW Joint (type, topic, year, title) AS SELECT d1.type, d2.topic, d3.year, f1.title FROM Dimension_1 d1, Dimension_2 d2, Dimension_3 d3, Fact_1 f1 WHERE d1.paper = d2.paper AND d2.paper = d3.paper AND d3.paper = f1.paper AND d1.doc = d2.doc AND d2.doc = d3.doc AND d3.doc = f1.doc ; |
To generate a last view, the system must apply the aggregation operation by grouping the dimensions:
CREATEVIEW Distribution (type, topic, year, number) AS SELECT j.type, j.topic, j.year, count (j.title) FROM Joint j GROUP BY j.type, j.topic, j.year ; |
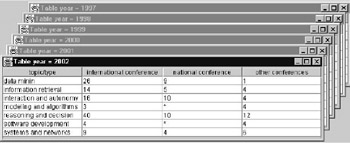
Figure 9: Multidimensional Table "Distribution"
The view generated by the system must be visualized according to a multidimensional table "Distribution".
EAN: N/A
Pages: 171